Comparative evaluation of soft tissue changes in
Class I borderline patients treated with extraction and
nonextraction modalities
Aniruddh Yashwant V.1, Ravi K.2, Edeinton Arumugam3
1 Senior lecturer, Department of Orthodontics and Dentofacial Orthopedics,
Indira Gandhi Institute of Dental Sciences, MGMCRI campus, SBV University, Pillayarkuppam, Pondicherry, India.
2 Professor and Head of Department, Department of Orthodontics and
Dentofacial Orthopedics, SRM Dental College, Ramapuram, Chennai, India.
3 Associate professor, Department of Orthodontics and Dentofacial Orthopedics,
SRM Dental College, Ramapuram, Chennai, India.
Objective: To compare soft tissue changes in Class I borderline cases treated with extraction and nonextraction
mo-dalities. Methods: A parent sample of 150 patients with Class I dental and skeletal malocclusion (89 patients treated with
premolar extraction and 61 patients without extraction) was randomly selected and subjected to discriminant analysis which identified the borderline sample of 44 patients (22 extraction and 22 nonextraction patients). Pretreatment and post-treatment cephalograms of the borderline subsample were analyzed using 22 soft tissue parameters. Results: Upper and lower lips were
more retracted and thickness of the upper lip increased more in the borderline extraction cases (p < 0.01). The nasolabial
angle became more obtuse and the interlabial gap was reduced in the borderline extraction cases (p < 0.01). Lower lip,
interlabial gap and nasolabial angle showed no changes in the borderline nonextraction cases. Conclusion: The soft tissue
parameters which can be used as guideline in decision making to choose either extraction or nonextraction in Class I borderline cases are upper and lower lip protrusion in relation to the E-plane and Sn-Pg’ line, lower lip protrusion in relation to the true vertical line (TVL), upper lip thickness, nasolabial angle and interlabial gap.
Keywords: Angle Class I malocclusion. Borderline cases. Discriminant analysis. Soft tissue changes.
DOI: http://dx.doi.org/10.1590/2177-6709.21.4.050-059.oar
How to cite this article: Aniruddh YV, Ravi K, Edeinton A. Comparative
eval-uation of soft tissue changes in Class I borderline patients treated with extraction and nonextraction modalities. Dental Press J Orthod. 2016 Jul-Aug;21(4):50-9. DOI: http://dx.doi.org/10.1590/2177-6709.21.4.050-059.oar
Submitted: October 10, 2015 - Revised and accepted: January 08, 2016
» The authors report no commercial, proprietary or financial interest in the products or companies described in this article.
Contact address: Aniruddh Yashwant V.
E-mail: [email protected]
Objetivo: comparar as alterações sofridas nos tecidos moles em casos limítrofes de Classe I tratados com extrações e sem
extra-ções. Métodos: uma amostra inicial de 150 pacientes com má oclusão esquelética e dentária de Classe I (89 pacientes tratados
com extrações de pré-molares e 61 pacientes tratados sem extrações) foi aleatoriamente selecionada e submetida a uma análise discriminante, a qual permitiu selecionar uma amostra de 44 pacientes limítrofes (22 tratados com extrações e 22 tratados sem extrações). Telerradiografias obtidas antes e depois do tratamento dessa subamostra de pacientes limítrofes foram analisadas, utilizando-se 22 grandezas em tecidos moles. Resultados: nos casos limítrofes tratados com extrações, houve maior retração
dos lábios superior e inferior e um maior aumento na espessura do lábio superior (p < 0,01); bem como o ângulo nasolabial
tornou-se mais obtuso e o espaço interlabial sofreu redução (p < 0,01). Já nos casos limítrofes tratados sem extrações, o lábio
inferior, o espaço interlabial e o ângulo nasolabial não apresentaram alterações significativas. Conclusão: as grandezas em
teci-dos moles que podem ajudar na tomada de decisão entre o tratamento com e sem extrações nos casos limítrofes de Classe I são: protrusão dos lábios superior e inferior em relação ao plano E e em relação à linha Sn-Pg’, protrusão do lábio inferior em relação à linha vertical verdadeira (LVV), a espessura do lábio superior, o ângulo nasolabial e o espaço interlabial.
INTRODUCTION
Orthodontics is the branch of Dentistry which mainly deals with malocclusion and dentofacial de-formities and their correction for optimal function and esthetics. Orthodontic treatment should not fo-cus only on occlusal relations, but also on facial es-thetics, in particular profile eses-thetics, as they are the primary motive that encourages most patients to seek orthodontic treatment.1 In the present era,
sev-eral treatment modalities emphasize soft tissue para-digm.2,3 Wuerpel E.H 4 discussed the changes in soft
tissue that must be considered during orthodontic treatment, instead of moving teeth without anticipat-ing soft tissue outcomes after treatment.
In treating a Class I malocclusion, there are two main approaches in comprehensive Orthodontics: ex-traction and nonexex-traction. Exex-tractions are routinely used to correct dental crowding and protrusion of teeth and the overlying sot tissue. The nonextrac-tion approach requires expansion of the arches, molar distalization or proximal stripping. The common de-merits of extraction treatment were hypothesized to be “dished-in proiles,” narrower dental arches, increased width of the buccal corridor; while those of nonex-traction treatment were hypothesized to be poor sta-bility and protrusive proile in borderline cases.5
There have been numerous studies about post-treatment soft tissue changes in Class II malocclu-sions, but the impact of facial esthetics in Class I cases has seldom been given importance.6,7,8 This study was
undertaken to compare the soft tissue changes seen in extraction and nonextraction treatment modalities in Class I borderline malocclusions.
MATERIAL AND METHODS
The treatment records of 150 patients with dental and skeletal Class I malocclusion were randomly selected from the record archive of patients treated over the past ive years in the Department of Orthodontics and Dentofacial Or-thopedics, SRM Dental College, Ramapuram, Chennai, India. Only patients whose treatment was inished with bilateral Class I canine and molar relationship were includ-ed in the study. Pretreatment and post-treatment cephalo-grams, which were taken from the same cephalostat with teeth occluding in centric occlusion and lips relaxed, were gathered. The study design was approved by the institu-tional Ethics Committee.
It is difficult to segregate borderline Class I maloc-clusions based only on specific parameters, especially when a large sample of patients is to be studied. Dis-criminant analysis is a multivariate statistical method wherein many parameters that influence treatment modality can be assessed. It can also help in identify-ing the predictors of treatment modality and also to identify borderline patients.6,8
Hence, in this study, a stepwise discriminant analysis was performed to segregate the borderline subsample of patients who could have been treated with either extrac-tion or nonextracextrac-tion treatment modalities. A total of 15 cephalometric variables, 4 model measurements, besides age and sex (demographic variables) were used for the discriminant analysis (Table 1). The values of the 21 vari-ables were noted for all the 150 cases of the parent sample and data were subjected to discriminant analysis using Statistica sotware (StatSot, Inc. USA). At each step of the discriminant analysis, all the 21 variables were re-viewed and evaluated to determine which variable would contribute most to the discrimination between groups. That variable was then included in the discriminant
Table 1 - Variables for discriminant analysis.
No PARAMETERS CHARACTERISTIC
1. SNA Maxillary position
2. SNB Mandibular position
3. ANB Maxillomandibular relationship
4. FMA Facial height/orientation of mandible
5. U1-SN Maxillary incisor protrusion
6. U1-NA (linear) Maxillary incisor protrusion
7. U1-NA (angular) Maxillary incisor inclination
8. L1-NB (linear) Mandibular incisor protrusion
9. L1-NB (angular) Mandibular incisor inclination
10. Wits appraisal Maxillomandibular relationship
11. N-S-Ar Mandibular position
12. Z angle Proile convexity
13. L lip-E-plane Lower lip protrusion
14. L1-APog Mandibular incisor position
15. Jarabak ratio Growth pattern/facial height
16. Overbite
17. Overjet
18. Maxillary tooth material- arch discrepancy
19. Mandibular tooth material- arch discrepancy
20. Age Demographic variable
model, and analysis was restarted. Thereby, the variables entered the discriminant function individually based on their discriminating power.
Based on the data incorporated for the parent sample, only the variables that were significant were deemed eligible to be included in the discriminant analysis. From the inferential statistics, the discrimi-nant function used three significant variables in de-scending order of importance, which were (p <0.01):
1. Maxillary tooth material – arch length discrep-ancy;
2. Mandibular tooth material – arch length dis-crepancy;
3. Mandibular incisor to NB (linear).
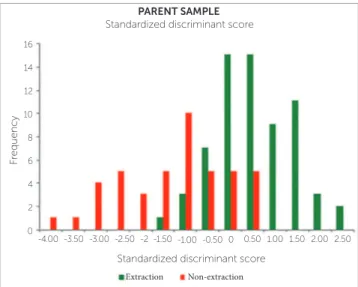
By means of the discriminant analysis, a standardized discriminate score (Dz) was achieved for each of the 150 patients. The univariate representation of the scores is shown in Graph 1. The mean of the discriminate scores (group centroid score) was calculated for each group. The group centroid score was -0.7170 for the extraction group and 1.046 for the nonextraction group.
Using the formula below for calculating critical cutting score value for unequal group sizes, the opti-mal cutting score was obtained.9
ZCS = NAZB + NBZA NA + NB
In which:
» Group A: Extraction. » Group B: Nonextraction.
» ZCS: Critical cutting score between Group A and Group B.
» NA: Number of observations in Group A. » NB: Number of observations in Group B. » ZA: Centroid score for Group A.
» ZB: Centroid score for Group B.
The borderline subsample of patients was inferred to be those scores which were closest to the critical cut-ting score. Sot tissue landmarks were identiied for sot tissue analysis of the 22 extraction and 22 nonextrac-tion borderline cases, using the 22 parameters enlisted in Table 2 (Figs 1 to 13).
Ten random cephalometric radiographs were taken and assessed for the second time to test for the standard deviation of error in repeated measures for each sot tis-sue cephalometric measurement by means of Dahlberg’s formula (√ (∑d)2/2N).
Mean and standard deviation of the 22 sot tissue pa-rameters were calculated for the extraction and nonex-traction borderline samples before and ater treatment. The mean and standard deviation for the diferences that each treatment group experienced from pretreat-ment to post-treatpretreat-ment were also obtained.
Independent sample t-tests were used to test the sig-niicance of diferences between treatment change values of the two diferent treatment groups. The null hypothesis stating that no diference exists in the cephalometric vari-ables in each treatment group before and ater treatment was tested using paired t-tests (p < 0.05 was considered
sta-tistically signiicant). The standard deviation of error of the repeated measures for sot tissue cephalometric measure-ments was calculated by means of Dahlberg’s formula.
Figure 1 - 1 = Angle of facial convexity (G’-Sn-Pg’). 2 = Protrusion of upper lip (Ls to E-plane). 3 = Protrusion of lower lip (Li to E-plane).
Graph 1 - Standardized discriminant scores for parent sample. *p < 0.05 (significant at 5% level).
G’
Sn
Ls
2
3 1
Li
Pg’ E-plane
Non-extraction Extraction
Standardized discriminant score -4.00
0 2 6
4 8 10 12 14 16
-3.00 -1.50 0
-3.50 -2.50 -2 -1.00 -0.50 0.50 1.00 1.502.00 2.50
PARENT SAMPLE
Standardized discriminant score
F
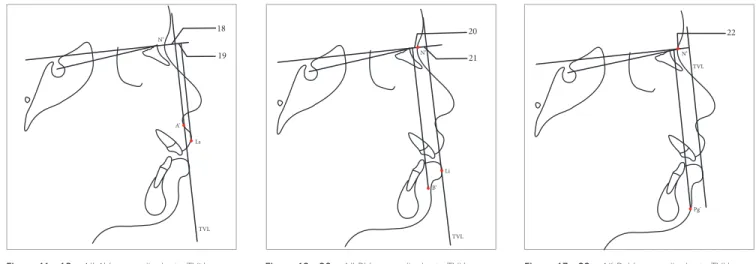
Figure 10 - 17 = N’ - Pn (perpendicular to TVL). Figure 8 - 15 = Vertical height ratio (G’-Sn’:Sn’-Me’). Figure 9 - 16 = Incisal exposure [ULi-Is (on TVL)].
N’ Pn TVL
ULi
Is 16
Figure 4 - 7 = Thickness of upper lip (Is-Ls). 8 = Thickness of lower lip (Ii-Li). Figure 2 - 4 = Protrusion of upper lip (Ls–Sn-Pg’
line). 5 = Protrusion of lower lip (Li–Sn-Pg’ line).
Figure 3 - 6 = Maxillary incisor exposure (Is-Stm).
Ls
Li
Pg’
Sn 4
5
Is Stm FH plane
6
Ls
Li Is Ii FH plane
7 8
Figure 7 - 12 = Lower lip length (LLs - Me’).
13 = Up-per lip length (Sn’-ULi). 14 = Interlabial gap (ULi-LLs). Figure 5 - 9 = Max. sulcus (Sn’-Ls). 10 = Mand.
sul-cus (Li-Pg’).
Figure 6 - 11 = Nasolabial angle.
Sn’
Mand. sulcus
Ls
Li
Pg’
9
10
11 Sn’
Ls
11 Sn’
ULi
LLs
Me’
13 14
12 TVL
12 14 13
Max. sulcus
G’
Sn’
Table 2 - Soft tissue analysis.
No MEASUREMENT DESCRIPTION
1. G’–Sn-Pg’ (Fig 1) Angle of facial convexity
2. Ls–E-plane (Fig 1) Protrusion of the upper lip in
relation to E-plane
3. LL–E-plane (Fig 1) Protrusion of the lower lip in
relation to E-plane
4. Ls–Sn-Pg’ line (Fig 2) Protrusion of the upper lip in
relation to Sn-Pg’ line
5. LL–Sn-Pg’ line (Fig 2) Protrusion of the lower lip in
relation to Sn-Pg’ line
6. Is-Stm [perpendicular to FH plane]
(Fig 3) Maxillary incisor exposure
7. Is-Ls [on FH plane] (Fig 4) Thickness of the upper lip
8. Ii-LL [on FH plane] (Fig 4) Thickness of the lower lip
9. Max. Sulcus - Sn’-Ls (Fig 5) Maxillary sulcus depth
10. Mand. Sulcus - LL-Pg’ (Fig 5) Mandibular sulcus depth
11. Nasolabial angle (Fig 6)
Formed by the intersection of labrale superius and columella
at subnasale
12. LLs - Me’ (Fig 7) Lower lip length
13. Sn’- ULi (Fig 7) Upper lip length
14. ULi-LLs (Fig 7) Interlabial gap
15. G’-Sn’ : Sn’-Me’ (Fig 8) Vertical height ratio
16. ULi-Is (on TVL) (Fig 9) Incisal exposure
17. N’ – Pn (perpendicular to True
Vertical Line [TVL]) (Fig 10) Projection of the nose
18. N’ – A’ (perpendicular to TVL) (Fig 11) Thickness of the upper lip
19. N’- Ls (perpendicular to TVL) (Fig 11) Protrusion of the upper lip
20. N’- B’ (perpendicular to TVL) (Fig 12) Thickness of the lower lip
21. N’-Li (perpendicular to TVL) (Fig 12) Protrusion of the lower lip
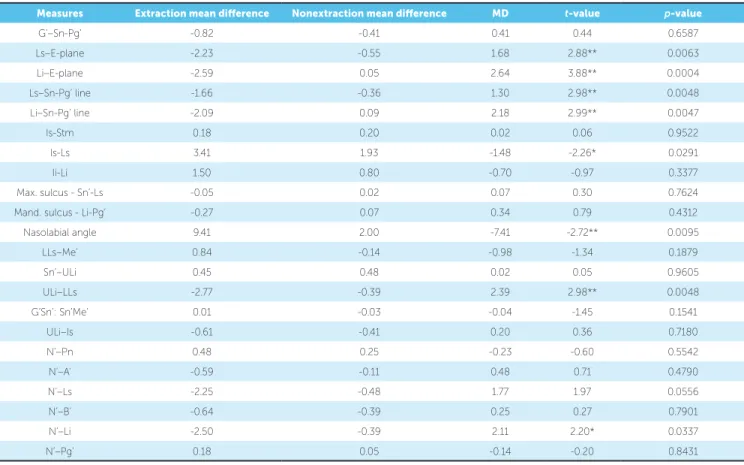
22. N’- Pg’ (perpendicular to TVL) (Fig 13) Soft tissue thickness at chin Figure 11 - 18 = N’ - A’ (perpendicular to TVL).
19 = N’ - Ls (perpendicular to TVL).
Figure 13 - 22 = N’-Pg’ (perpendicular to TVL). Figure 12 - 20 = N’-B’ (perpendicular to TVL),
21 = N’-Li (perpendicular to TVL).
RESULTS
The descriptive and inferential statistics of all the 150 Class I cases using discriminant analysis are tabulated (Table 3). A total of 89 cases were treated by extraction of either irst or second premolars and 61 cases by the nonextraction modality. Descriptive statistics of the par-ent sample of 150 cases showed that the sample consisted of patients with skeletal and dental Class I malocclusion.
Out of ten signiicant parameters in the discriminant analysis, maxillary tooth material-arch length discrepancy (Max tooth-arch length) is the most important in diferen-tiating extraction and nonextraction groups, followed by mandibular tooth material-arch length discrepancy (Mand tooth-arch length) and linear relationship of mandibular incisor to NB [L1-NB(L)], as shown in Table 4.
Comparative statistics of the borderline extraction sample and borderline nonextraction sample is listed in Tables 5 and 6, respectively. Upper lip thickness in-creased signiicantly from 12.09 mm at treatment onset to 14.02 mm at the end of treatment in the borderline nonextraction sample. The other parameters did not show statistically signiicant changes.
Comparative statistics of mean diferences between extraction and nonextraction borderline samples are listed in Table 7. In relation to the E-plane, the upper lip was retracted by 2.23 mm in the extraction and by 0.55 mm in the nonextraction group; whereas the low-er lip was retracted by 2.59 mm in the extraction and by 0.05 mm in the nonextraction group. The mean sot tissue change values for the upper lip in relation to
Pg’ N’
TVL
22
N’
A’ Ls
18
19
TVL
Li B’ N’
20
21
Table 3 - Descriptive statistics of the parent sample of 150 cases.
Table 4 - Discriminant analysis: significance of the function differentiating extraction and nonextraction cases. * p < 0.05 (Significant at 5%).
** p < 0.01 (Significant at 1%).
Measures
Extraction group n = 89
Nonextraction group
n = 61 t-value p-value
Mean SD Mean SD
SNA 82.09 2.45 81.72 3.02 0.82 0.4121
SNB 79.27 2.43 79.25 3.24 0.05 0.9592
ANB 2.81 1.09 2.48 1.21 1.77 0.0793
FMA 26.51 4.33 24.90 4.71 2.15* 0.0331
U1-SN 118.04 5.87 114.89 8.79 2.64** 0.0092
U1-NA (mm) 10.10 2.50 8.48 3.43 3.34** 0.0010
U1.NA (degrees) 35.36 5.36 32.59 7.76 2.59** 0.0107
L1-NB (mm) 9.52 2.50 7.21 2.42 5.63** < 0.0001
L1.NB (degrees) 35.76 6.22 31.10 6.76 4.36** < 0.0001
N-S-Ar 124.40 4.41 125.10 5.26 -0.87 0.3832
Z angle 72.37 5.65 72.36 5.43 0.01 0.9913
Llip-Eplane 4.23 3.28 2.13 2.85 4.06** 0.0001
L1-APog (mm) 7.41 2.68 5.79 3.03 3.45** 0.0007
Jarabak ratio 64.27 4.55 65.46 4.94 -1.52 0.1308
Overbite 2.83 1.65 2.80 1.85 0.10 0.9222
Overjet 3.88 2.00 3.50 2.52 1.03 0.3034
Max tooth-arch L -5.89 3.98 -0.34 4.62 -7.86** < 0.0001
Mand tooth-arch L -6.50 3.67 -1.42 4.26 -7.80** < 0.0001
Eigen-value
Canonical R
Wilks’
Lambda Chi-Sqr. Df p-value
0 0.8271 0.6728 0.5473 86.19 10 p < 0.0001
Raw coeicient Root 1
Standardized coeicients Root 1
FMA 0.0216 0.0970
U1-SN 0.0139 0.0998
U1-NA (mm) 0.0355 0.1035
U1.NA (degrees) 0.0133 0.0855
L1-NB (mm) 0.1422 0.3504
L1.NB (degrees) 0.0405 0.2609
Lower lip-E-plane 0.0066 0.0205
L1-A Pog (mm) -0.0440 -0.1244
Max tooth-arch length -0.1216 -0.5168
Mand tooth-arch length -0.1047 -0.4104
Constant -6.1884
the Sn-Pg’ line were -1.66 mm for the extraction and -0.36 mm for the nonextraction group; whereas for the lower lip in relation to the Sn-Pg’ line, the mean change values were -2.09 mm for the extraction and 0.09 mm for the nonextraction group. The mean sot tissue change values for the lower lip in relation to true vertical line (TVL) were -2.50 mm for the extraction
Table 5 - Borderline extraction sample: descriptive and inferential statistics of soft tissue analysis results.
Table 6 - Borderline nonextraction sample: descriptive and inferential statistics of soft tissue analysis results.
Measures Pre-treatment Post-treatment MD Paired t-test p-value
Mean SD Mean SD
G’–Sn-Pg’ 14.82 6.51 14.00 5.72 0.82 1.38 0.1806
Ls–E-plane -0.39 3.22 -2.61 2.43 -2.23 5.02** 0.0001
Li–E-plane 2.89 3.36 0.30 2.93 -2.59 5.28** < 0.0001
Ls–Sn-Pg’ line 6.09 1.78 4.43 1.94 -1.66 5.28** < 0.0001
Li–Sn-Pg’ line 6.57 2.88 4.48 2.30 -2.09 4.06** 0.0006
Is-Stm 2.39 1.63 2.57 1.26 0.18 -0.74 0.4666
Is-Ls 12.20 2.34 15.61 2.08 3.41 -6.91** < 0.0001
Ii-Li 13.84 2.06 15.34 1.55 1.50 -3.79** 0.0011
Max. sulcus - Sn’-Ls 2.27 0.74 2.23 0.77 -0.05 0.24 0.8120
Mand. sulcus - Li-Pg’ 6.02 1.98 5.75 1.45 -0.27 0.98 0.3388
Nasolabial angle 93.36 8.64 102.77 9.46 9.41 -5.20** < 0.0001
LLs–Me’ 44.95 4.13 45.80 3.73 0.84 -1.30 0.2081
Sn’–ULi 21.18 2.39 21.64 2.22 -0.45 -1.46 0.1599
ULi–LLs 3.30 3.44 0.52 0.75 -2.77 4.07** 0.0006
G’Sn’: Sn’Me’ 0.99 0.12 1.00 0.09 0.01 -0.63 0.5333
ULi–Is 3.77 2.35 3.16 1.31 -0.61 1.61 0.1219
N’–Pn 23.45 4.18 23.93 4.26 0.48 -1.43 0.1685
N’–A’ 8.27 3.88 7.68 3.99 -0.59 1.02 0.3205
N’–Ls 13.52 4.51 11.27 4.53 -2.25 2.92** 0.0081
N’–B’ 1.09 4.60 0.45 3.98 -0.64 0.85 0.4028
N’–Li 11.30 4.98 8.80 4.29 -2.50 3.21** 0.0042
N’–Pg’ 1.82 4.91 2.00 4.28 0.18 -0.29 0.7729
Measures Pre-treatment Post-treatment MD Paired t-test p-value
Mean SD Mean SD
G’–Sn-Pg’ 14.82 4.41 14.41 5.18 -0.41 0.58 0.5676
Ls–E-plane -1.48 2.25 -2.02 2.46 -0.55 1.43 0.1666
Li–E-plane 1.91 2.93 1.95 2.75 0.05 -0.10 0.9240
Ls–Sn-Pg’ line 5.64 1.90 5.27 2.02 0.36 1.21 0.2390
Li–Sn-Pg’ line 6.11 2.45 6.20 2.60 0.09 -0.18 0.8626
Is-Stm 2.34 2.09 2.55 1.91 0.20 -0.71 0.4826
Is-Ls 12.09 2.85 14.02 2.55 1.93 -4.50** 0.0002
Ii-Li 14.11 2.93 14.91 2.60 0.80 -1.31 0.2056
Max. sulcus - Sn’-Ls 2.05 0.77 2.07 0.56 0.02 -0.19 0.8525
Mand. sulcus - Li-Pg’ 5.80 1.62 5.86 1.54 0.07 -0.21 0.8364
Nasolabial angle 96.23 14.06 98.23 13.03 2.00 -0.98 0.3380
LLs–Me’ 46.36 4.20 46.23 4.05 -0.14 0.40 0.6902
Sn’–ULi 21.86 1.78 22.34 2.46 0.48 -1.43 0.1665
ULi–LLs 1.93 1.54 1.55 1.66 -0.39 0.92 0.3694
G’Sn’: Sn’Me’ 1.05 0.16 1.02 0.14 -0.03 1.34 0.1943
ULi–Is 3.91 3.03 3.50 2.34 -0.41 0.99 0.3347
N’–Pn 23.30 4.24 23.55 4.42 0.25 -1.37 0.1850
N’–A’ 8.64 4.54 8.52 4.65 -0.11 0.34 0.7344
N’–Ls 12.89 5.49 12.41 5.39 -0.48 1.02 0.3195
N’–B’ 0.80 5.97 0.41 5.63 -0.39 0.69 0.4994
N’–Li 10.20 7.01 9.82 6.37 -0.39 0.68 0.5023
Table 7 - Descriptive and inferential statistics of mean value differences: extraction versus nonextraction.
Table 8 - Standard deviation of error for repeated measures. *p < 0.05 (Significant at 5%). **p < 0.01 (Significant at 1%).
Measures Extraction mean diference Nonextraction mean diference MD t-value p-value
G’–Sn-Pg’ -0.82 -0.41 0.41 0.44 0.6587
Ls–E-plane -2.23 -0.55 1.68 2.88** 0.0063
Li–E-plane -2.59 0.05 2.64 3.88** 0.0004
Ls–Sn-Pg’ line -1.66 -0.36 1.30 2.98** 0.0048
Li–Sn-Pg’ line -2.09 0.09 2.18 2.99** 0.0047
Is-Stm 0.18 0.20 0.02 0.06 0.9522
Is-Ls 3.41 1.93 -1.48 -2.26* 0.0291
Ii-Li 1.50 0.80 -0.70 -0.97 0.3377
Max. sulcus - Sn’-Ls -0.05 0.02 0.07 0.30 0.7624
Mand. sulcus - Li-Pg’ -0.27 0.07 0.34 0.79 0.4312
Nasolabial angle 9.41 2.00 -7.41 -2.72** 0.0095
LLs–Me’ 0.84 -0.14 -0.98 -1.34 0.1879
Sn’–ULi 0.45 0.48 0.02 0.05 0.9605
ULi–LLs -2.77 -0.39 2.39 2.98** 0.0048
G’Sn’: Sn’Me’ 0.01 -0.03 -0.04 -1.45 0.1541
ULi–Is -0.61 -0.41 0.20 0.36 0.7180
N’–Pn 0.48 0.25 -0.23 -0.60 0.5542
N’–A’ -0.59 -0.11 0.48 0.71 0.4790
N’–Ls -2.25 -0.48 1.77 1.97 0.0556
N’–B’ -0.64 -0.39 0.25 0.27 0.7901
N’–Li -2.50 -0.39 2.11 2.20* 0.0337
N’–Pg’ 0.18 0.05 -0.14 -0.20 0.8431
Parameters Standard deviation of error
G’–Sn-Pg’ 0.7416
Ls–E-plane 0.1936
Li–E-plane 0.3162
Ls–Sn-Pg’ 0.5916
Li–Sn-Pg’ 0.2958
Is-Stm 0.3708
Is-Ls 1.0124
Ii-Li 0.5123
Max. sulcus (Sn’–Ls) 0.4031
Mand. sulcus (Li–Pg’) 0.3873
Nasolabial angle 3.6125
Lower Lip length 0.5701
Upper lip length 0.6021
Interlabial gap 0.1936
G’Sn’:Sn’Me’ 0.0647
Uli-Is 0.3708
TVL N’–Pn 0.3708
TVL N’–A’ 0.4472
TVL N’–Ls 0.9421
TVL N’–B’ 0.6124
TVL N’–Li 0.3354
TVL N’–Pg’ 0.3354
The values of standard deviation of error of the re-peated measures for each of the sot tissue cephalometric measurement by means of Dahlberg’s formula are listed in Table 8. These values were found to be comparable to those reported in the literature.6,10,11
DISCUSSION
There is probably no other aspect of orthodontic treatment that has caused as much controversy as the decision of whether to extract or not permanent teeth. Just like a pendulum, the popularity of premolar ex-tractions has swung between the option of nonextrac-tion at any cost and extracnonextrac-tion treatment to achieve arbitrary cephalometric norms.
Considering the changes in the upper lip in re-lation to E-plane, the borderline extraction sample showed -2.23-mm retraction while the borderline nonextraction sample showed -0.55-mm retraction. Drobocky et al.12 and Bravo13, in their studies, reported
-3.4 mm of upper lip retraction with extraction of maxillary first premolars.Kocadereli14, in his study,
showed that upper lip was retracted by -1.64 mm. Upper lip retraction in relation to the true vertical line was found to be -2.25 mm for the extraction group and -0.48 mm for the nonextraction group. In relation to the Sn-Pg’ line, upper lip protrusion was reduced by -1.66 mm in the extraction group and was insignificant in the nonextraction group. Drobocky et al.12 and Bravo13 reported upper lip
re-traction in relation to Sn-Pg’ line values to be of -2.12 mm and -2.4 mm, respectively.The insignifi-cant reduction in lip protrusion in the nonextraction group is similar to the values seen in the studies by Kocadareli14 and Konstantonis15.
Upper lip thickness was increased by 3.41 mm in the extraction group and by 1.93 mm in the nonextrac-tion group. These values are comparable to the study results of Talass et al16 who reported an increase of
up-per lip thickness of 3.7 mm in the extraction group. The nasolabial angle showed an increase of 9.41° in
the extraction borderline group. Bravo reported an in-crease of 3.7° in nasolabial angle with the extraction of
irst premolars.13 Ramos et al17 reported an increase of
4° in their study which involved extraction of maxillary
irst premolars for treatment of Class II, Division 1 cas-es. The increase in the nasolabial angle was statistically insigniicant in the nonextraction group. Contrary to the results obtained in our study, Waldman18 reported
that there was only a slight correlation (r = 0.42) be-tween retraction of anterior teeth and change in the nasolabial angle.
The changes in lower lip showed significant dif-ference between treatment groups. In relation to the E-plane, the lower lip was retracted by -2.59 mm in the extraction group. Drobocky et al.12 reported a
similar value of lower lip retraction with extraction of first premolars (-3.22 mm). In the nonextraction group, lower lip in relation to E-plane showed no change. Konstantonis15, in his study, showed that the
lower lip was brought forward by 0.67 mm. In con-trast to these findings, Battagel, Finnoy et al and
Xu et al reported lower lip retraction with values of -1.44 mm, -2.2 mm and -0.4 mm, respectively.10,19,20
With respect to the Sn-Pg’ line, the lower lip showed -2.09-mm retraction in the extraction group and no change in the nonextraction group. The findings by Konstantonis15 showed -2.55-mm retraction in the
extraction group and 1.01-mm lower lip protrac-tion. Young and Smith11 found -0.58-mm lower lip
retraction. The mean values of lower lip response to treatment vary between this study and the other studies discussed above. This can be due to factors such as variation in position of the maxillary inci-sor post-treatment, weak correlation between man-dibular incisors retraction and lower lip position, as well as weaker correlation and ratio between lower lip change and underlying hard tissue change due to treatment. In relation to the true vertical line (TVL) the lower lip showed 3.21-mm retraction in the ex-traction group. The change in the nonexex-traction group was insignificant. These values were compa-rable to the values inferred from lower lip changes in relation to the Sn-Pg’ line and E-plane. Hence, the relationship between soft tissue landmarks and the true vertical line (TVL) shows that it can be used as an adjunct parameter for assessing soft tissue changes with treatment.
The interlabial gap was found to reduce by 2.77 mm in the extraction group. This parameter did not show any significant change with nonextrac-tion treatment. Jacobs21, in his study, reported that
the decrease in interlabial gap can be predicted by retraction and intrusion of maxillary incisors. The change in interlabial gap was found only in the ex-traction group, probably because of significant lower lip retraction (-2.59 mm in relation to E-plane). This inference can be confirmed with the results of a study by Yogosawa22, which showed that to close
interlabial gap, movement of lower lip must be four times the movement of upper lip.Contrary to these results, Janson et al23 reported that nonextraction
pa-tients had greater interlabial gap reduction (2.7 mm) than observed in extraction patients (1.3 mm) in the long-term post-treatment period.
the characteristics of the patients studied, sample size, the prescription used, anchorage consider-ations and treatment mechanics. Many of the studies discussed above have shown soft tissue changes asso-ciated with Class II malocclusions.13,16-19 Moreover,
treatment mechanics and anchorage considerations were not specified in many of those studies. This in-fluences the amount of incisor retraction which, in turn, influences soft tissue changes.
In this study, all patients were treated by MBT prescription in 0.022-in slot with appropriate anchor-age preparation. Few of the studies discussed have used Tweed’s technique. It has been shown that patients treated with Tweed’s technique have shown greater lip retraction.12 These may be the reasons why the values
of sot tissue changes of this study do not coincide with values observed in other studies.
CONCLUSION
From the results obtained in this study, it can be con-cluded that upper and lower lips were retracted more niicantly, while upper lip thickness increased more sig-niicantly in the borderline extraction cases. The nasolabial angle became more obtuse and the interlabial gap was re-duced in the borderline extraction cases. The other param-eters, such as maxillary incisor exposure, upper and lower lip lengths, vertical height ratio and sot tissue changes at the chin, were found to be statistically insigniicant in both extraction and nonextraction treatment groups.
The parameters which diferentiate between extraction and nonextraction treatment modalities in Class I border-line cases are upper and lower lip protrusion in relation to E-plane and the Sn-Pg’ line, lower lip protrusion in rela-tion to the true vertical line (TVL), upper lip thickness, nasolabial angle and interlabial gap. These parameters can be used as guidelines in decision making to choose either extraction or nonextraction in Class I borderline cases.
1. Riedel RA. Esthetics and its relation to orthodontic therapy. Angle Orthod. 1950 July;20(3):168-78.
2. Peck H, Peck S. A concept of facial esthetics. Angle Orthod. 1970 Oct;40(4):284-318.
3. Burstone CJ. The integumental proile. Am J Orthod. 1958;44(1):1-25. 4. Wuerpel EH. On facial balance and harmony. Angle Orthod. 1937;7(2):81-9. 5. Germec-Cakan D, Taner TU, Akan S. Arch-width and perimeter changes in
patients with borderline Class I malocclusion treated with extractions or without extractions with air-rotor stripping. Am J Orthod Dentofacial Orthop. 2010 Juny;137(6):734.e1-7; discussion 734-5.
6. Luppanapornlarp S, Johnston LE Jr. The efects of premolar-extraction: a long-term comparison of outcomes in “clear-cut” extraction and nonextraction Class II patients. Angle Orthod. 1993 Winter;63(4):257-72.
7. Janson G, Fuziy A, Freitas MR, Castanha Henriques JF, Almeida RR. Soft-tissue treatment changes in Class II Division 1 malocclusion with and without extraction of maxillary premolars. Am J Orthod Dentofacial Orthop. 2007;132:729.e1-8. 8. Paquette DE, Beattie JR, Johnston LE Jr. A long-term comparison of
nonextraction and premolar extraction edgewise therapy in “borderline” Class II patients. Am J Orthod Dentofacial Orthop. 1992 July;102(1):1-14.
9. Hair JF Jr, Anderson RE, Tatham RL, Black WC. Multivariate data analysis with readings. New York: MacMillan; 1992.
10. Battagel JM. The relationship between hard and soft tissue changes following treatment of Class II division 1 malocclusions using Edgewise and Fränkel appliance techniques. Eur J Orthod. 1990 May;12(2):154-65.
11. Young TM, Smith RJ. Efects of orthodontics on the facial proile: a comparison of changes during nonextraction and four premolar extraction treatment. Am J Orthod Dentofacial Orthop. 1993 May;103(5):452-8.
12. Drobocky OB, Smith RJ. Changes in facial proile during orthodontic treatment with extraction of four irst premolars. Am J Orthod Dentofacial Orthop. 1989 Mar;95(3):220-30.
REFERENCES
13. Bravo LA. Soft tissue facial proile changes after orthodontic treatment with four premolars extracted. Angle Orthod. 1994;64(1):31-42.
14. Kocadereli I. Changes in soft tissue proile after orthodontic treatment with and without extractions. Am J Orthod Dentofacial Orthop. 2002 July;122(1):67-72. 15. Konstantonis D. The impact of extraction vs nonextraction treatment on
soft tissue changes in Class I borderline malocclusions. Angle Orthod. 2012 Mar;82(2):209-17.
16. Talass MF, Talass L, Baker RC. Soft-tissue proile changes resulting from retraction of maxillary incisors. Am J Orthod Dentofacial Orthop. 1987 May;91(5):385-94. 17. Ramos AL, Sakima MT, Pinto A dos S, Bowman SJ. Upper lip changes correlated
to maxillary incisor retraction: a metallic implant study. Angle Orthod. 2005 July;75(4):499-505.
18. Waldman BH. Change in lip contour with maxillary incisor retraction. Angle Orthod. 1982 Apr;52(2):129-34.
19. Finnoy JP, Wisth PJ, Boe OE. Changes in soft tissue proile during and after orthodontic treatment. Eur J Orthod. 1987;9(1):68-78.
20. Xu TM, Liu Y, Yang MZ, Huang W. Comparison of extraction versus nonextraction orthodontic treatment outcomes for borderline Chinese patients. Am J Orthod Dentofacial Orthop. 2006 May;129(5):672-7.
21. Jacobs JD. Vertical lip changes from maxillary incisor retraction. Am J Orthod. 1978 Oct;74(4):396-404.
22. Yogosawa F. Predicting soft tissue proile changes concurrent with orthodontic treatment. Angle Orthod. 1990 Fall;60(3):199-206.