A Curiosity Model for Artificial Agents
Eug´enio Ribeiro
1,2, Ricardo Ribeiro
1,3and David Martins de Matos
1,21L2F – Spoken Language Systems Laboratory – INESC-ID Lisboa, Portugal 2Instituto Superior T´ecnico, Universidade de Lisboa, Portugal
3ISCTE-IUL – Instituto Universit´ario de Lisboa, Portugal [email protected]
Abstract
Curiosity is an inherent characteristic of the animal instinct, which stimulates the need to obtain further knowledge and leads to the exploration of the surrounding environment. In this document we present a computational curiosity model, which aims at simulating that kind of behavior on artificial agents. This model is influenced by the two main curiosity theories defended by psychologists – Curiosity Drive Theory and Optimal Arousal Model. By merging both theories, as well as aspects from other sources, we concluded that curios-ity can be defined in terms of the agent’s personalcurios-ity, its level of arousal, and the interest of the object of curiosity. The interest factor is defined in terms of the importance of the object of curiosity to the agent’s goals, its novelty, and sur-prise. To assess the performance of the model in practice, we designed a scenario consisting of virtual agents exploring a tile-based world, where objects may exist. The performance of the model in this scenario was evaluated in incremental steps, each one introducing a new component to the model. Furthermore, in addition to empirical evaluation, the model was also subjected to evaluation by human observers. The re-sults obtained from both sources show that our model is able to simulate curiosity on virtual agents and that each of the identified factors has its role in the simulation.
Introduction
Curiosity is an inherent characteristic of the animal in-stinct which stimulates the need to obtain further knowl-edge and leads to the exploration of the surrounding environ-ment (Byrne, 2013). Thus, it is safe to assume that a major part of the human learning process, especially in early years, is triggered by curiosity (Gottlieb et al., 2013). In this sense, if we want an artificial agent to be able to learn in the same way that humans do, then it should be partially curiosity-driven as well (Schmidhuber, 2010). In order for that to happen, the agent must be able to model curiosity, so that it can influence its reasoning process. Work in this area is usu-ally referred to as Artificial Curiosity (AC) (Schmidhuber, 1991; Luciw et al., 2011) or Intrinsic Motivation (Schmid-huber, 2010; Oudeyer et al., 2007). In this paper we present a model of AC based on the two main curiosity theories de-fended by psychologists, as well as a simple scenario that demonstrates its applicability.
Psychologists have been divided between two different theories for curiosity – Curiosity Drive Theory (Berlyne, 1950; Litman and Jimerson, 2004; Loewenstein, 1994) and Optimal Arousal Model (Day, 1971; Kashdan et al., 2004) –, which differ mainly on how curiosity is believed to be triggered. The former theory relates curiosity to unpleas-ant experiences of uncertainty, the reduction of which is re-warding. Thus, curiosity is triggered in an attempt to avoid ignorance. On the other hand, the latter theory relates cu-riosity to the pleasure of acquiring new knowledge and an arousal state, which should be kept optimal according to cri-teria such as the Wundt curve (Wundt, 1874). Thus, curios-ity is triggered to avoid boredom and restrained when multi-ple stimuli are received in a short period of time.
While one of the theories defines curiosity as a desire to avoid negative experiences and the other as a desire to obtain rewarding experiences, there are two important aspects they share – interest and personality. Both theories state that cu-riosity is proportional to the interest of an individual towards obtaining certain knowledge. Furthermore, they state that individuals exposed to the same stimuli may show different levels of curiosity, which means that curiosity is affected by a personality factor. In fact, one may argue that both the-ories are not contradictory but rather complementary, with curiosity being the desire to obtain rewarding experiences while avoiding negative ones. This is similar to the principle of Reinforcement Learning (RL). In fact, multiple studies in AC were performed in the context of RL (Frank et al., 2014; Mohamed and Rezende, 2015). Given their comple-mentarity, Litman and Jimerson (2004) defined the Interest / Deprivation theory of curiosity, which combines both views on curiosity. The computational model presented in this doc-ument tries to be in agreement with this theory, taking both views on curiosity in consideration.
As previously stated, curiosity is believed to be related with the interest of an individual towards certain knowledge. This interest, according to Saunders and Gero (2004), can be defined in terms of the goals and previous experiences of that individual. That is, the interest of an individual to-wards certain knowledge is related to the importance of that
knowledge for the fulfillment of some goal, even if the goal is simply knowing something more. Furthermore, the previ-ous experiences of an individual and its ability to predict the outcome of a certain experience also influence the interest. For instance, people are more inclined to taste food contain-ing contain-ingredients they like, while someone who got hurt by a pointy object will be more inclined to avoid other pointy objects. Finally, still considering previous experiments, the novelty of an object or exploration zone also influences the interest, as people are often bored if they are constantly ex-periencing the same things, but also afraid of exploring what is completely unknown. Thus, people are most intrigued by what is similar to what they know but still slightly differ-ent (Schmidhuber, 1997; Saunders and Gero, 2001).
Document Structure
The next section presents our computational curiosity model, which takes both views on curiosity, as well as other aspects such as the relation between curiosity and surprise, into account. After that, we describe a scenario designed to assess the applicability of the model in practice. The follow-ing section describes the steps of the evaluation procedure designed for that scenario. We then proceed to present the results of that procedure. Finally, we end the document with a summary of the results and some proposals of future work to further assess the applicability of the model.
Curiosity Model
According to the theories presented in the previous section, we define curiosity towards a target as a function of three main factors – personality, interest, and arousal –, with the first two contributing positively and the last one negatively:
Curiosity = Personality + Interest − Arousal (1) Curiosity is typically seen as a personality trait (Naylor, 1981). We incorporate this into our model by introducing a personality factor, which can take negative – for shier agents – or positive – for more curious agents – values. Further-more, the value can be constant for each agent or change very slowly over time.
Arousal has a negative contribution to curiosity, since an agent is more inclined to explore and obtain new knowledge when it is bored and usually retracts when multiple new stimuli are received in a short period of time. Thus, from this perspective, the level of arousal decays over time and increases according to the number of received stimuli.
The interest of a target is the most complex of the three aspects as it is itself influenced by multiple factors – the agent’s goals, novelty, and surprise:
Interest =
P#Goals
i=0 Importancei
#Goals − |Novelty| + Surprise (2)
The importance to goal is a value that represents the av-erage importance of exploring a certain zone or obtaining certain knowledge to achieve the agent’s goals. For exam-ple, if an agent currently in Madrid has three goals – being in Lisbon, being in Paris, and calling a friend –, exploring Portugal contributes with a positive value to the first goal, negative to the second, and neutral to the last.
As stated in the previous section, people are intrigued by what is similar to what they know but still slightly different, and tend to get bored by what is completely known and to avoid what is completely unknown. Thus, in order to simu-late this behavior for artificial agents, interest is negatively influenced by the modulus of novelty.
Finally, surprise is also included as an influence to interest due to the fact that people tend to become curious when they are surprised by something, especially changes to what was known (Macedo and Cardoso, 2005). For instance, a build-ing painted in a different color. Takbuild-ing this into account, in our model, surprise can take neutral or positive values.
Scenario
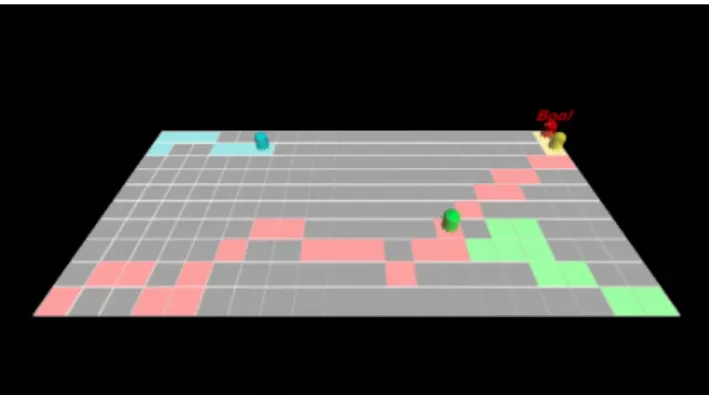
In order to assess the performance of the theoretical model presented in the previous section in practice, we devised a simple scenario consisting of a tile-based virtual world where agents live and with which they interact. A snapshot of the scenario can be seen in Figure 1.
Figure 1: A snapshot of the scenario.
World
As can be seen in Figure 1, the world is tile-based. We opted for a world representation of this kind because it limits the actions an agent may perform at a given time, reducing the complexity of the scenario. The tiles are generated by a Tile Manager, which controls the dimensions of the world and keeps information about all the tiles. Each tile contains an inner light which is turned off until an agent steps on it and changes color according to the agents that have stepped on it. These lights were introduced as visual indicators of the areas explored by each agent. Furthermore, at a given time, each tile may or may not have an object on it.
Objects
The objects present in the world are created by an Object Managerand identified by their name and a set of proper-ties, such as color, shape, and number of faces. For a matter of simplicity, there are only two different kinds of physical objects in the scenario – spheres and cubes. However, the name and properties can be different for each instance.
Agents
The agents of our scenario are virtual ghosts, created by an Agent Manager. They receive perceptions from the current and neighboring tiles and decide which action to perform according to their inner state and the received perceptions. Perceptions received from the neighboring tiles are referent to their existence and the presence of objects, while percep-tions from the current tile are only received if there is an object on it and an inspection action has been performed. As for the possible actions, the agents are able to perform five different ones:
Wait(time): Wait for a given amount of time. RotateTowards(tile): Rotate towards a tile. MoveTo(tile): Move to a tile.
Say(message): Display a text message.
Inspect(object): An instinctive action that inspects the ob-ject on the current tile every time the agent changes tile. The inner state of each agent is its most complex part and is what triggers different behaviors for the same set of re-ceived perceptions. It has four main components:
Personality: A fixed value between -1 and 1, which rep-resents the agent’s innate curiosity. Since we just want to assess the applicability of our model, we do not dwell into complex theories of personality. In fact, the agents are too short-lived for the application of such theories to be noticeable. Thus, we opted for using a fixed value, which enables the creation of agents that exhibit different levels of curiosity, independently of their experiences. Arousal: A value between -1 and 1, which decreases 0.03
each second and increases 0.3 with each new stimulus. These values were obtained empirically, with focus on the naturality of the simulation.
Goals: The agent’s goals, managed by a Goal Manager. In our scenario, the agents have goals of two different kinds – Positioning and Finding –, which represent the objective of getting to a given tile and the objective of finding an object with a given set of properties, respectively. While Findinggoals are always attributed maximum priority, the priority of Positioning goals is calculated according to the distance to the target, by attributing a higher importance
to the ones with closer targets. We introduced the notion of priority to help the agent decide in cases when there are conflicting goals.
Knowledge: The agent’s knowledge about the world, man-aged by a Knowledge Manager. Each agent’s knowledge consists of a mental representation of the tiles it has al-ready visited, as well as information about the known ob-jects. The representation of object information associates an object name with a set of properties that identify that kind of object.
According to its inner state and the perceptions received, an agent is able to calculate the utility of each possible tile, in coherence with the curiosity model presented in the pre-vious section. The utility of each tile can be though of as a combination of the utility of the tile itself and the utility of the object present on the tile, if it exists:
Utility = Tile Utility + Object Utility
2 (3)
The utility of both the tile itself and the object are calcu-lated according to Equation 1. However, the contribution of the personality and arousal factors depend on the knowledge the agent has of that tile. If the tile is unknown, personal-ity contributes positively and arousal negatively, while if the tile is known, the contributions are symmetrical. Thus, each utility factor can be calculated as follows:
Utility =
If the tile is unknown:
Interest + Personality − Arousal Otherwise:
Interest − Personality + Arousal
(4)
The interest factor in the equation is calculated according to Equation 2. However, the novelty and surprise factors are only relevant for the interest of an object. Thus, the interest of a tile on its own is given solely by its importance to the agent’s goals.
The importance to each goal is a value between -1 and 1, weighted according to the goal priority, and calculated differently according to the type of goal. In the case of Posi-tioninggoals, importance is calculated as a normalized dif-ference between the current distance to the target and the distance from the tile to the target. As for Finding goals, the importance is considered maximum if the tile is unknown and has an object on it, while if the tile is already known, interest is calculated as the level of overlapping between the properties of the object on the tile and the properties of the object the agent wants to find.
The novelty of an object is also a value between -1 and 1, which is calculated by comparing the object’s properties with the knowledge the agent has. This is done by keeping a record, on the Knowledge Manager, of all the properties, and
respective values, found for each object name. By looking at this record, the agent is able to verify how many properties of the found object are not associated with its name and, thus, calculate its novelty.
Surprise is a value between 0 and 1, which is triggered when a tile known by an agent has changed since the last visit. This happens when objects are moved or deleted. To calculate the level of surprise triggered by a known tile, its object (or the absence of it) is compared with the mental map of the world present on the agent’s Knowledge Man-ager, originating a percentage of different properties which may be understood as the level of surprise triggered.
By using the utility function, each agent is able to decide which tile is most important at each time and take action, using the following set of rules:
1. If the level of surprise triggered by the current tile is positive, the agent reveals its surprise by using the Say(“WTH?”)action, where the argument “WTH?” is a common acronym that reveals surprise.
2. If the object utility of the current tile is positive, it means that the object triggered the agent’s curiosity, which it re-veals by using the Say(“Boo?”) action.
3. If the agent was able to complete a goal, it reveals its hap-piness by using the Say(“Boo!”) action.
4. If the current tile is the one with higher utility, the agent may choose to simply wait, by using the Wait(time) ac-tion, or to rotate towards one of the neighboring tiles, by using the RotateTowards(tile) action. These actions are used to simulate indecision behaviors.
5. If the tile with higher utility is one of the neighboring tiles, the agent moves to it, by using the MoveTo(tile) action.
Evaluation Procedure
In order to assess the performance of the curiosity model in the scenario we defined an incremental evaluation procedure with four steps, each one introducing further components. The main reason to use this approach is that it allows us to identify the behavioral changes originated by each compo-nent, as well as its contribution to a natural curiosity model. Each step is evaluated according to different measures, both empirical and based on human observation. For empirical evaluation, we performed thirty 60-second iterations. Hu-man evaluation is based on a single observation of each step, in random order. The configuration of each step and its eval-uation measures are described below.
Free Exploration
The base scenario configuration consists of placing four agents in the world and letting them explore freely, accord-ing to their innate curiosity and arousal levels. The place-ment and innate curiosity values for each agent are the fol-lowing:
Yellow: top-right corner, innate curiosity = -1 Blue: top-left corner, innate curiosity = 0
Green: bottom-right corner, innate curiosity = 0.5 Red: bottom-left corner, innate curiosity = 1
In terms of empirical measures, the performance of each agent can be assessed in terms of the number of explored tiles. In terms of human observation, a perceived level of curiosity can be attributed to each agent. To do so, the observers attribute one out of four possible values to each agent, on a scale from Not Curious (0) to Very Curious (3).
Goal-Driven Exploration
This configuration builds upon the previous by introducing Positioninggoals. In this sense, each agent has the goal of being in the tile in the opposite corner from the starting po-sition:
Yellow: PositioningGoal(bottom-left corner) Blue: PositioningGoal(bottom-right corner) Green: PositioningGoal(top-left corner) Red: PositioningGoal(top-right corner)
In terms of empirical measures, in addition to the num-ber of explored tiles, the performance of the agents can be assessed in terms of the distance to the goal at the end of the iteration. In terms of human evaluation, in addition to attributing a perceived level of curiosity to each agent, the observers are prompted to answer the following questions: 1. “Do you think that the agents’ curiosity influenced their
decisions?”
2. “Do you think that the agents’ goals influenced their de-cisions?”
Finding Objects
The third configuration introduces 10 randomly-placed ob-jects in the world, with which the agents can interact. Fur-thermore, in addition to the goal from the previous step, each agent is given the goal of finding a red sphere.
In addition to the empirical measures of the previous step, we introduce two more – the number of inspected objects and whether the agent was able to find a red sphere. In terms of human evaluation, the questions of the previous step are replaced by the following:
1. “Do you think that the presence of objects in the world influenced the agents’ curiosity?”
2. “Do you think that the novelty of the objects influenced the agents’ curiosity?”
Surprise
The final configuration introduces the surprise component. Considering the scenario, we attempt to trigger surprise by moving the objects present on tiles the agents have already visited.
For this step, we introduce another empirical measure, the surprise rate, which is the ratio between the number of times an agent was surprised and the number of changes around that agent. Also, in this step, the questions to be answered by human observers are the following:
1. “Do you think that the agents were surprised when the objects changed place?”
2. “Do you think that the agents’ curiosity was influenced by surprise?”
Results
In this section we present the results obtained for each configuration described in the previous section. As previ-ously mentioned, the results for empirical evaluation were obtained from thirty 60-second iterations. In order to as-sess the statistical significance of the result differences between agents we used one-way Analysis of Variance (ANOVA) (Penny and Henson, 2006). Since the assump-tion of homogeneity of variances was violated, we used the Welch’s t-test (Welch, 1947) and the Games-Howell post-hoc test (Games and Howell, 1976). Unless explicitly stated, assume that the result differences are statistically significant. The results for human evaluation are based on the answers of 15 subjects.
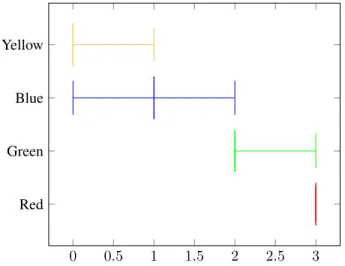
Free Exploration
Figure 2: State after 60 seconds of free exploration. Figure 2 shows the state of the scenario after 60 seconds of free exploration. Both the figure and Table 1 show that the number of tiles explored by each agent was directly pro-portional to its innate curiosity, which was the expected re-sult. Also, Figure 3 shows that most of the observers were able to identify the different levels of curiosity revealed by the agents. However, there was one observer that stated that
none of the agents were curious. Since that behavior was not repeated in the evaluation of the remaining steps, it means that the observer did not consider that the exploratory be-havior of each agent was related to curiosity factors.
Yellow Blue Green Red
Explored Tiles (F = 1418.44, p 0.001)
µ σ µ σ µ σ µ σ
2.87 .34 7.27 .64 10.20 .66 22.13 2.97
Table 1: Free Exploration: Empirical evaluation.
0 0.5 1 1.5 2 2.5 3
Red Green Blue Yellow
Figure 3: Free Exploration: Human evaluation.
Goal-Driven Exploration
Figure 4 shows the state of the scenario, not after 60 seconds, but when the first agent reached the goal. Once again, both the figure and Table 2 show that the number of tiles explored by each agent is directly proportional to its curiosity. How-ever, the explored tiles follow a pattern that gets each agent closer to its goal, which means that the goals are influencing curiosity. This can also be proved by the fact that every agent explored more tiles than during the previous step. Also, as expected, the distance to the goal at the end of each iteration was inversely proportional to the agents’ innate curiosity.
Furthermore, from Figure 5, we can conclude that by in-troducing goals the agents seemed more curious to the ob-servers, which is an interesting fact. This can be confirmed by the fact that all of the observers stated that the agents’ decisions were influenced by their level of curiosity, in spite of the influence that the goals also have, which 87% of the observers believed to exist.
Finding Objects
This configuration introduced objects in the scenario. Fig-ure 6 shows an example of an agent, the red one, revealing
Figure 4: Red agent reaching the Positioning goal.
Yellow Blue Green Red
Explored Tiles (F = 1627.23, p 0.001) µ σ µ σ µ σ µ σ 4.93 .58 9.23 .50 12.93 1.39 27.63 1.77 Distance to Goal (F = 1248.58, p 0.001) µ σ µ σ µ σ µ σ 16.30 1.12 13.33 1.24 10.00 1.72 .43 1.01
Table 2: Goal-Driven Exploration: Empirical evaluation.
0 0.5 1 1.5 2 2.5 3
Red Green Blue Yellow
Figure 5: Goal-Driven Exploration: Human evaluation.
curiosity towards an object. In Table 3, we can see that, in comparison to the previous step, the agents explored less tiles and, in general, ended up farther from the Positioning goal. In fact, the number of explored tiles was similar to the observed in the Free Exploration step. However, this can be explained by the fact that the agents showed curiosity towards the objects present in the world, which consumed time and increased the level of arousal, leading to less world exploration in the same period of time. This is supported by the fact that the agents which inspected more objects had a higher reduction in the number of explored tiles. However, given the random placement in the world, the number of in-spected objects was irregular across iterations. In fact, the difference in that number for the blue and green agents was not statistically significant. Still, in general, higher innate curiosity led to higher number of inspected objects and red sphere finding rate.
Figure 6: Red agent showing curiosity towards an object.
Yellow Blue Green Red
Explored Tiles (F = 866.78, p 0.001) µ σ µ σ µ σ µ σ 3.90 .48 7.53 .97 10.80 1.37 23.57 2.36 Distance to Goal (F = 380.01, p 0.001) µ σ µ σ µ σ µ σ 16.93 .74 14.87 1.36 11.93 2.07 2.77 2.24 Inspected Objects (F = 59.71, p 0.001) µ σ µ σ µ σ µ σ .43 .50 .97 .61 .90 .71 3.57 1.16 Red Sphere Finding Rate
.13 .30 .43 .63
Table 3: Finding Objects: Empirical evaluation. In this case, due to the reduced level of exploration, the observers were more inclined to believe that the agents were, in general, slightly less curious than in the previous step. This is shown in Figure 7. Furthermore, although 73% of the
observers believed that the presence of objects influenced the curiosity of the agents, only 64% believed that the nov-elty of an object contributed to it. This can be explained by the reduced number of object types and the reduced iteration time. 0 0.5 1 1.5 2 2.5 3 Red Green Blue Yellow
Figure 7: Finding Objects: Human evaluation.
Surprise
The final step introduced the surprise component. Figure 8 shows an example of an agent, the yellow one, being sur-prised by the sudden appearance of a cube on a previously empty tile. In Table 4, we can see that the results for the first four evaluation measures were very similar to the ones obtained in the previous step. However, the surprise rate de-creased as the innate curiosity inde-creased. This relation was especially noticeable at the extremes. While the less curious agent, the yellow one, never ignored changes, the most curi-ous, the red one, ignored over 90% of the changes. Between the yellow and blue agents, the decrease was not statistically significant. The same happened between the blue and green agents. However, the decrease between the yellow and green agents was significant. Overall, the low surprise rate of the most curious agents can be explained by the high level of curiosity induced by the unexplored tiles and their interest to goals. However, for the less curious agents, we can see that surprise is an important curiosity motivator.
As can be seen in Figure 9, in this step, the opinion of the observers about the level of curiosity of the agents slightly decreased in comparison to the previous step. The only ex-ception was the yellow agent, which due to the surprise fac-tor was able to show a little more curiosity. However, 100% of the observers claimed that the agents were surprised when the objects changed place and 73% believed that the surprise influenced curiosity, as most of the times the agents were in-clined to choose the tiles that triggered surprise.
Figure 8: Yellow agent showing surprise.
Yellow Blue Green Red
Explored Tiles (F = 554.26, p 0.001) µ σ µ σ µ σ µ σ 3.77 .63 6.67 1.73 9.13 1.63 25.03 2.95 Distance to Goal (F = 346.75, p 0.001) µ σ µ σ µ σ µ σ 16.93 .83 14.83 2.04 12.83 1.62 1.67 2.51 Inspected Objects (F = 47.06, p 0.001) µ σ µ σ µ σ µ σ .47 .51 .87 .63 1.30 .79 3.34 1.24 Red Sphere Finding Rate
.13 .20 .33 .73
Surprise Rate (F = 297.38, p 0.001)
µ σ µ σ µ σ µ σ
1.00 .00 .93 .23 .73 .40 .09 .16
Table 4: Surprise: Empirical evaluation.
0 0.5 1 1.5 2 2.5 3
Red Green Blue Yellow
Conclusions
From the results presented in the previous section, we can conclude that our computational curiosity model is able to simulate curiosity in practice and at different levels. Fur-thermore, by analyzing the differences between the multiple evaluation steps, we can see that each of its components has influence on the behavior of the agents. Thus, each of the factors that influence our model has its role in the simula-tion of curiosity for artificial agents.
The previous statements were corroborated by observers, as 93% stated that the agents were able to show different levels of curiosity and that there were behavioral changes on each evaluation step. Furthermore, 100% of the observers stated that curiosity was represented and expressed in a nat-ural way that humans are able to understand. However, it is important to notice that the level of curiosity that the ob-servers attributed to each agent seems to be related to the number of explored tiles.
Although the results show that our curiosity model is able to simulate curiosity in virtual agents, we cannot be sure about its performance when applied to physically embodied agents in real-world scenarios. Thus, it would be interest-ing to explore its applicability in those scenarios. Further-more, we still need to assess the influence of curiosity in more complex scenarios, which have multiple factors influ-encing the agents’ reasoning processes.
Acknowledgements
This work was supported by national funds through Fundac¸˜ao para a Ciˆencia e a Tecnologia (FCT) with refer-ence UID/CEC/50021/2013 and by Universidade de Lisboa.
References
Berlyne, D. E. (1950). Novelty and Curiosity as Determinants of Exploratory Behavior. British Journal of Psychology, 41:68– 80.
Byrne, R. W. (2013). Animal Curiosity. Current Biology, 23(11). Day, H. I. (1971). The Measurement of Specific Curiosity. Intrinsic
Motivation: A New Direction in Education, pages 99–112. Frank, M., Leitner, J., Stollenga, M., F¨orster, A., and
Schmidhu-ber, J. (2014). Curiosity Driven Reinforcement Learning for Motion Planning on Humanoids. Frontiers in Neurorobotics, 7.
Games, P. A. and Howell, J. F. (1976). Pairwise Multiple Compari-son Procedures with Unequal N’s and/or Variances: A Monte Carlo Study. Journal of Educational Statistics, 1(2):113–125. Gottlieb, J., Oudeyer, P.-Y., Lopes, M., and Baranes, A. (2013). Information Seeking, Curiosity and Attention: Computa-tional and Neural Mechanisms. Trends in Cognitive Sciences, 17(11):585–593.
Kashdan, T. B., Rose, P., and Fincham, F. D. (2004). Curiosity and Exploration: Facilitating Positive Subjective Experiences and Personal Growth Opportunities. Journal of Personality Assessment, 82:291–305.
Litman, J. A. and Jimerson, T. L. (2004). The Measurement of Curiosity as a Feeling-of-Deprivation. Journal of Personality Assessment, 82:147–157.
Loewenstein, G. (1994). The Psychology of Curiosity: A Review and Reinterpretation. Psychological Bulletin, 116:75–98. Luciw, M., Graziano, V., Ring, M., and Schmidhuber, J. (2011).
Artificial Curiosity with Planning for Autonomous Perceptual and Cognitive Development. In IEEE International Confer-ence on Development and Learning, volume 2, pages 1–8.
Macedo, L. and Cardoso, A. (2005). The Role of Surprise, Cu-riosity and Hunger on Exploration of Unknown Environments Populated with Entities. In Portuguese Conference on Artifi-cial Intelligence, pages 47–53.
Mohamed, S. and Rezende, D. J. (2015). Variational Informa-tion MaximisaInforma-tion for Intrinsically Motivated Reinforcement Learning. CoRR, abs/1509.08731.
Naylor, F. D. (1981). A State-Trait Curiosity Inventory. Australian Psychologist, 16(2):172–183.
Oudeyer, P. Y., Kaplan, F., and Hafner, V. V. (2007). Intrinsic Moti-vation Systems for Autonomous Mental Development. IEEE Transactions on Evolutionary Computation, 11(2):265–286.
Penny, W. and Henson, R. (2006). Analysis of Variance. In Statis-tical Parametric Mapping: The Analysis of Functional Brain Images. Elsevier, London.
Saunders, R. and Gero, J. S. (2001). A Curious Design Agent: A Computational Model of Novelty-Seeking Behaviour in De-sign. In The Sixth Conference on Computer Aided Architec-tural Design Research in Asia, pages 345–350.
Saunders, R. and Gero, J. S. (2004). Curious Agents and Situated Design Evaluations. Artificial Intelligence for Engineering Design, Analysis and Manufacturing, 18(2):153–161.
Schmidhuber, J. (1991). Curious Model-Building Control Systems. In IEEE International Joint Conference on Neural Networks, volume 2, pages 1458–1463.
Schmidhuber, J. (1997). What’s Interesting? Technical Report TR-35-97, IDSIA, Lugano, Switzerland.
Schmidhuber, J. (2010). Formal Theory of Creativity, Fun, and Intrinsic Motivation (1990-2010). IEEE Transactions on Au-tonomous Mental Development, 2(3):230–247.
Welch, B. L. (1947). The Generalization of ‘Student’s’ Problem when Several Different Population Variances are Involved. Biometrika, 34(1/2):28–35.
Wundt, W. (1874). Grundz¨ude der Physiologischen Psychologie. W. Engelman.