Universidade Nova de Lisboa
Faculdade de Ciências e Tecnologia
Departamento de Química
Liquid Crystal mobility and PDLC memory effects
by
Ana Sofia Reboredo César
Dissertation presented at Faculdade de Ciências e Tecnologia
of Universidade Nova de Lisboa to obtain the Degree of
Master in Chemical and Biochemical Engineering
Supervised by
João Carlos da Silva Barbosa Sotomayor
Jury members
Professor Maria Madalena Alves Campos de Sousa Dionísio de Andrade (FCT/UNL)
Professor João Carlos da Silva Barbosa Sotomayor (FCT/UNL)
Examiner
Professor Carlos Jorge Mariano Miranda Dias (FCT/UNL)
Lisboa
Ana Sofia Reboredo César v
Indicação dos direitos de cópia
A Faculdade de Ciências e Tecnologia e a Universidade Nova de Lisboa têm o direito, perpétuo e sem limites geográficos, de arquivar e publicar esta dissertação através de exemplares impressos reproduzidos em papel ou de forma digital, ou por qualquer outro meio conhecido ou que venha a ser inventado, e de a divulgar através de repositórios científicos e de admitir a sua cópia e distribuição com objectivos educacionais ou de investigação, não comerciais, desde que seja dado crédito ao autor e editor.
Copyright
Ana Sofia Reboredo César vii
“Life is not easy for any of us. But what of that? We must have perseverance and above all
confidence in ourselves. We must believe that we are gifted for something and that this
thing must be attained.
”Marie Curie
“You have to learn the rules of the game. And then you have to play better than anyone
else.
”
Ana Sofia Reboredo César ix
Acknowledgments
This work would not be able without the support of many people.
In first place I would like to thank Professor João Sotomayor, my supervisor, for the support and guidance during my work.
Professor Madalena Dionísio was really helpful and that is why I must thank her, for the availability, help in the dielectric relaxation spectroscopy and guidance in the DRS subject.
I would like to thank all the friends I have gained during this work, which made my work days the best days; Alexandre Maiau, for all the explanations, support and help in the laboratory work; Ana Mouquinho for her sympathy, help with my last PDLCs and with the electro-optics and encouragement to start writing; Sandra Dias that introduced me to the FTIR spectroscopy, for her partnership during the FTIR work and help every time I need it; Esther Garcia Merino, for her patience to explain me the DRS graphics, of course for the amusing stories and candies and the Spanish lessons; Andreia Rodrigues for her sympathy, talk and readiness to help.
Thank to all the personnel in general of laboratory 415, for the help, sympathy and friendship.
A special thank to Sofia Almeida, my methanol project friend, and to Ana Filipa Gomes, for the lunches, friendship and awesome conversations that sometimes was so important for me to talk.
I cannot forget to express my gratitude to my family and friends for the understanding and all the support they gave me during my university course.
Ana Sofia Reboredo César xi This work was partially funded by Fundação para a Ciência e Tecnologia through project
Ana Sofia Reboredo César xiii
Resumo
Foram estudados PDLCs compreendendo PEGDMA ou PEGDA como matriz polimérica para suportar o cristal líquido E7 da Merck, numa proporção 30/70 (p/p).
Seguiu-se a polimerização destas misturas por FTIR, quer fotoquímica quer térmica, onde se verificou uma velocidade de polimerização semelhante para ambos os oligómeros.
Usou-se a Espectroscopia de Relaxação Dieléctrica para o PDLC com E7 onde a matriz polimérica era composta por PEGDMA ou por PEGDA, para se estudar a mobilidade do cristal líquido. Verificou-se a transição vítrea e a transição nemática-isotrópica para o E7 em ambos compósitos, estando estas de acordo com as descritas na literatura para o E7 e já observadas pelo método de calorimetria diferencial de varrimento. Estudou-se também a mobilidade do cristal líquido sozinho e confinado na matriz polimérica para uma gama de temperaturas bastante próxima da temperatura de transição vítrea (-60ºC a 0ºC).
Quando é aplicado um campo eléctrico predomina o alinhamento paralelo entre todos os microdomínios do cristal líquido (o PDLC torna-se transparente), após a aplicação de campo eléctrico, se este continuar transparente, diz-se que o PDLC possui efeito de memória permanente. Por aumento de temperatura acima da temperatura de clarificação, existe uma mudança de fase: fase nemática para a fase isotrópica. Quando a célula é arrefecida as moléculas de cristal líquido no PDLC voltam a alinhar-se em cada microdomínio no entanto, os microdomínios não estão alinhados entre si (o PDLC apresenta-se opaco).
Estudou-se as propriedades electro-ópticas do PDLC utilizando o PEGDA para verificar se este teria efeito de memória permanente. Verificou-se que possui efeito de memória tanto por polimerização fotoquímica e térmica, sendo mais acentuada que no caso do PEGDMA. Relacionou-se o efeito de memória com o alinhamento paralelo permanente das moléculas de E7 dentro dos microdomínios e a mobilidade dada pela Espectroscopia de Relaxação Dieléctrica.
Palavras-chave:
Ana Sofia Reboredo César xv
Abstract
PDLCs comprising PEGDA or PEGDMA as polymer matrix to support the liquid crystal E7 from Merck, in a ratio 30/70 (w/w) were studied.
These were followed by thermal or photochemical polymerization of these mixtures by FTIR, where there was a similar rate of polymerization for both oligomers.
Dielectric relaxation spectroscopy for the PDLC with E7 was used, where the polymer matrix was PEGDMA or PEGDA to study the liquid crystal mobility. The glass transition and the nematic-isotropic transition for E7 in both composites were studied, and the temperatures are consistent with those described in the literature for E7 and already observed by differential scanning calorimetry. The mobility of the liquid crystal alone and confined in the polymer matrix was compared, in a range of temperatures near the glass transition temperature (-60ºC to 0ºC).
When an electric field is applied dominates the parallel alignment between all liquid crystal microdomains (the PDLC becomes transparent), after the application of an electric field, if it remains transparent, the PDLC have permanent memory effect. When temperature rise above the clear temperature, there is a phase transition, from the nematic phase to the isotropic phase. When the cell is cooled the liquid crystal molecules in the PDLC tend to align in each microdomain, however the microdomains are not aligned with each (PDLC presents opaque).
The electro-optical properties of PDLC using PEGDA were studied in order to find permanent memory effects. It was found that composites have permanent memory effect by both thermal and photochemical polymerization, which was more pronounced than in the case of PEGDMA. The permanent memory effect was related with a parallel alignment of molecules of E7 and the mobility given by Dielectric Relaxation Spectroscopy.
Keywords:
Ana Sofia Reboredo César xvii
Index of Contents
Acknowledgments ... ix
Resumo ... xiii
Abstract ... xv
Abbreviations ... xxv
1. Introduction ... 1
1.1. Liquid Crystals ... 1
1.2. Liquid Crystal Phases ... 3
1.3. Liquid Crystal Properties ... 4
1.3.1. Anisotropy ... 4
1.3.2. Birefringence ... 4
1.3.3. Liquid Crystal in Electric Field ... 6
1.4. Molecular Mobility ... 8
1.5. Polymer Dispersed Liquid Crystal (PDLC) ... 10
1.5.1. “Swiss Cheese” Morphology ... 11
1.5.2. “Polymer Ball” Morphology ... 12
1.5.3. Hysteresis and the permanent memory effect ... 13
1.5.4. PDLCs Applications ... 15
2. Experimental work ... 16
2.1. Materials ... 16
2.1.1. Oligomers ... 16
2.1.2. Liquid Crystal, E7 ... 17
2.1.3. Initiators ... 18
2.1.4. Cells ... 19
2.2. Methods ... 20
2.2.1. Preparation of the PDLC samples ... 20
xviii Ana Sofia Reboredo César
2.2.2.1. Photochemical polymerization ... 21
2.2.2.2. Thermal polymerization ... 22
2.2.3. Characterization methods ... 23
2.2.3.1. Fourier Transform Infrared Spectroscopy (FTIR) ... 23
2.2.3.2. Electro-optic studies ... 26
2.2.3.3. Dielectric Relaxation Spectroscopy (DRS) ... 28
3. Experimental results and their analysis ... 31
3.1. PEGDA ... 31
3.1.1. Photochemical polymerization ... 31
3.1.2. Thermal Polymerization ... 32
3.1.3. Electro-optic study ... 37
3.1.4. Dielectric relaxation spectroscopy ... 38
3.2. PEGDMA ... 43
3.2.1. Photochemical Polymerization ... 43
3.2.2. Thermal Polymerization ... 44
3.2.3. Electro-optic study ... 49
3.2.4. Dielectric relaxation spectroscopy ... 49
4. Conclusion ... 54
5. Bibliography ... 55
6. Appendix ... 59
6.1. Appendix I ... 59
6.2. Appendix II ... 61
Ana Sofia Reboredo César xix
Index of Figures
Figure 1.1 – Order of the solid, liquid crystal and liquid phases (Collings, 2002) ... 1
Figure 1.2 – Schematic representation of nematic liquid crystal, cholesteric and smectic A and C (Senyuk) ... 3
Figure 1.3 – Light travelling through a birefringent medium (adapted from (Dias, 2010)) ... 5
Figure 1.4 – Temperature dependence on refractive index of a thermotropic liquid crystal (Senyuk) ... 6
Figure 1.5 –Dipole moment parallel to the long molecular (Δε>0): a – absence of electric field; b – presence of electric field (adapted from (Senyuk)) ... 7
Figure 1.6 – Temperature dependence of dielectric permittivity in liquid crystals with Δε > 0 (Senyuk) ... 7
Figure 1.7 – Molecular motion that can be found in polymeric systems: a –(γ, δ, β processes), b – (α process) (adapted from (Viciosa, 2007)) ... 8
Figure 1.8 – Schematic PDLC in OFF and ON state (CMMPE) ... 10
Figure 1.9 – The three possible liquid crystal droplets configuration: a – radial configuration; b – bipolar configuration and c – axial configuration (Case Western Reserve University) ... 11
Figure 1.10 –SEM image of the “Swiss Cheese” morphology (adapted from (Justice, 2006)) ... 12
Figure 1.11 –SEM image of the “Polymer Ball” morphology (adapted from (Justice, 2006)) ... 13
Figure 1.12 – PDLC electro-optic study with no hysteresis (adapted from (Maiau, 2009)) ... 13
Figure 1.13 – PDLC electro-optic study with hysteresis effect (Drzaic, 1998) ... 14
Figure 1.14 – PDLC electro-optic study with permanent memory effect (Drzaic, 1998) ... 14
Figure 1.15 – Two examples of the application of a PDLC (TradersCity) ... 15
Figure 2.1 – Chemical structure of poly(ethylene glycol)diacrylate... 16
Figure 2.2 – Chemical structure of poly(ethylene glycol)dimethacrylate ... 16
Figure 2.3 – E7 mixture components (Brás, et al., 2007) ... 17
Figure 2.4 – AIBN molecular structure and radical formation ... 18
Figure 2.5 – Molecular structure of XDT, dithiocarbamate radical and carbon-centered radical ... 18
Figure 2.6 – ITO cell ... 19
Figure 2.7 – Photochemical polymerization system set... 21
Figure 2.8 – Handmade oven for thermal polymerization ... 22
Figure 2.9 – PEGDMA possible polymer structure (Oh & Rey, 2000) ... 23
Figure 2.10 – FTIR apparatus ... 24
xx Ana Sofia Reboredo César
Figure 2.12 – FTIR layout (Thermo Electron Corporation, 2005) ... 25
Figure 2.13 – Electro-optic system ... 26
Figure 2.14 – Schematic representation of the electro-optic system ... 27
Figure 2.15 – Typical electric pulse applied to the sample (adapted from (Maiau, 2009)) ... 27
Figure 2.16 – DRS apparatus ... 28
Figure 2.17 – Frequency response of dielectric displacements representing the polarization phenomena (Mautritz) ... 29
Figure 3.1 – FTIR Spectrum of PEGDA (1% XDT) photochemically polymerized ... 31
Figure 3.2 – PEGDA (1% XDT) oligomer conversion photochemically polymerized ... 32
Figure 3.3 – FTIR Spectrum of PEGDA (1% AIBN) thermally polymerized (66ºC) ... 33
Figure 3.4 – PEGDA (1% AIBN) oligomer conversion thermally polymerized (66ºC) ... 33
Figure 3.5 – Spectrum of PEGDA (1% AIBN) thermally polymerized (74ºC) ... 34
Figure 3.6 – PEGDA (1% AIBN) oligomer conversion thermally polymerized (74ºC) ... 35
Figure 3.7 – Spectrum of PEGDA (1% AIBN) thermally polymerized (80ºC) ... 35
Figure 3.8 – PEGDA (1% AIBN) oligomer conversion thermally polymerized (80ºC) ... 36
Figure 3.9 – Electro-optic study of PEGDA (1% XDT) + E7 ... 37
Figure 3.10 – Electro-optic study of PEGDA (1% AIBN) + E7 ... 38
Figure 3.11 – DRS analysis of PEGDA (1% AIBN) + E7 at a frequency of 105 Hz ... 39
Figure 3.12 – Dielectric relaxation from PDLC between -60 and 0ºC ... 40
Figure 3.13 – Activation plot of PDLC and neat E7 ... 41
Figure 3.14 – Dielectric relaxation at -40ºC for the neat E7 and PDLC before and after heating above TNI ... 41
Figure 3.15 – Spectrum of PEGDMA (1% XDT) photochemically polymerized ... 43
Figure 3.16 – PEGDMA (1% XDT) oligomer conversion photochemically polymerized ... 44
Figure 3.17 – Spectrum of PEGDMA (1% AIBN) thermally polymerized (66ºC) ... 45
Figure 3.18 – PEGDMA (1% AIBN) oligomer conversion thermally polymerized (66ºC) ... 45
Figure 3.19 – Spectrum of PEGDMA (1% AIBN) thermally polymerized (74ºC) ... 46
Figure 3.20 – PEGDMA (1% AIBN) oligomer conversion thermally polymerized (74ºC) ... 47
Figure 3.21 – Spectrum of PEGDMA (1% AIBN) thermally polymerized (80ºC) ... 47
Figure 3.22 – PEGDMA (1% AIBN) oligomer conversion thermally polymerized (80ºC) ... 48
Figure 3.23 – Electro-optic study of PEGDMA (1% AIBN) + E7 ... 49
Figure 3.24 – DRS analysis of PEGDMA (1% AIBN) + E7 at a frequency of 105 Hz ... 50
Figure 3.25 – Dielectric relaxation from PDLC between -60 and 0ºC ... 51
Ana Sofia Reboredo César xxi Figure 3.27 – Dielectric relaxation at -40ºC for the neat E7 and PDLC before and after heating
above TNI ... 52
Figure 6.1 – Chemical actinometry absorbance versus time ... 60
Figure 6.2 – FTIR Spectrum of PEGDA (1% AIBN) + E7 thermally polymerized (66ºC) ... 61
Figure 6.3 – PEGDA (1% AIBN) + E7 oligomer conversion thermally polymerized (66ºC) ... 61
Figure 6.4 – Spectrum of PEGDA (1% AIBN) + E7 thermally polymerized (74ºC) ... 62
Figure 6.5 – PEGDA (1% AIBN) + E7 oligomer conversion thermally polymerized (74ºC) ... 62
Figure 6.6 – Spectrum of PEGDA (1% AIBN) + E7 thermally polymerized (80ºC) ... 63
Figure 6.7 – PEGDA (1% AIBN) + E7 oligomer conversion thermally polymerized (80ºC) ... 63
Figure 6.8 – Spectrum of PEGDMA (1% AIBN) + E7 thermally polymerized (66ºC) ... 64
Figure 6.9 – PEGDMA (1% AIBN) + E7 oligomer conversion thermally polymerized (66ºC) ... 64
Figure 6.10 – Spectrum of PEGDMA (1% AIBN) + E7 thermally polymerized (74ºC) ... 65
Figure 6.11 – PEGDMA (1% AIBN) + E7 oligomer conversion thermally polymerized (74ºC) ... 65
Figure 6.12 – Spectrum of PEGDMA (1% AIBN) + E7 thermally polymerized (80ºC) ... 66
Figure 6.13 – PEGDMA (1% AIBN) + E7 oligomer conversion thermally polymerized (80ºC) ... 66
Figure 6.14 – DSC heating procedure (-130 – 90ºC) ... 67
Ana Sofia Reboredo César xxiii
Index of Tables
Table 2.1 – Composition of the multicomponent nematic mixture E7 ... 17
Table 2.2 – ITO characteristics ... 19
Table 3.1 – Summary of FTIR results ... 36
Table 3.2 – Summary of FTIR results ... 48
Ana Sofia Reboredo César xxv
Abbreviations
5CB–4’- Pentyl - 4 - Biphenylcarbonitrile
5CT–4’- Pentyl - 4 - Triphenylcarbonitrile 7CB–4’- Heptyl - 4 - Biphenylcarbonitrile 8OCB–4’- Octyloxy - 4 - Biphenylcarbonitrile AIBN– Azobisisobutironitrile
DRS – Dielectric Relaxation Spectroscopy DSC – Differential Scanning Calorimetry FTIR – Fourier Transform InfraRed ITO – Indium Tin Oxide
PDLC– Polymer Dispersed Liquid Crystal PEGDA– Poly(ethylene glycol)diacrylate PEGDMA– Poly(ethylene glycol)dimethacrylate PIPS– Polymerization-Induced Phase Separation SEM– Scanning Electronic Microscopy
SIPS– Solvent-Induced Phase Separation Tc– Clear Temperature
Tg– Glass transition Temperature
TIPS– Thermal-Induced Phase Separation Tm– Melting Temperature
TN-I– Nematic-isotropic Temperature
Ana Sofia Reboredo César 1
1.
Introduction
1.1.
Liquid Crystals
There are three known physical states of matter, solid, liquid and gas. The material goes from solid state to liquid state usually by heating at a specific temperature of the material (melting temperature Tm). Some organic or organometallic substances (natural or synthetic) melt
to an intermediate liquid state with a cloudy appearance, and then, at a higher temperature, clear temperature, Tc>Tm transits to a normal liquid state that have a lighter or transparent appearance.
An observation on a polarizing light microscope shows that this intermediate liquid is anisotropic from the optical and physical properties, and when observed at a higher temperature the liquid is isotropic as a normal liquid. That is why the intermediate liquid is called liquid crystal, because it has the optical properties from the crystals and the mechanical properties from the liquids (Martins, 1991).
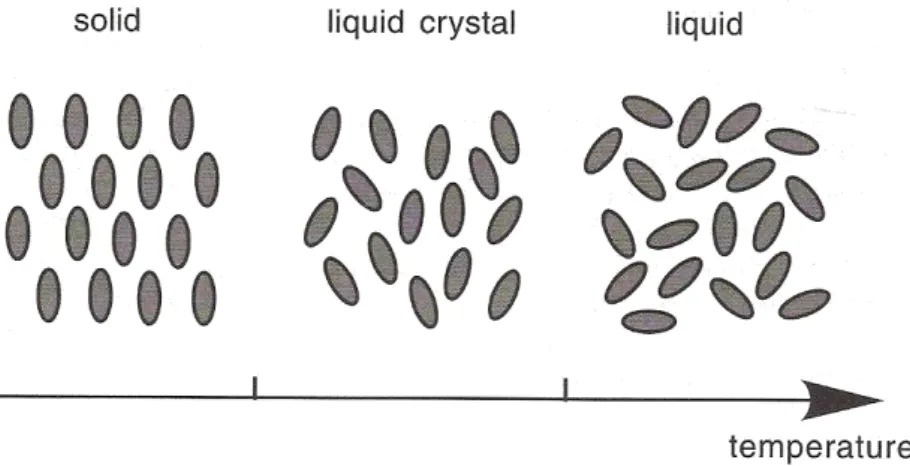
A liquid crystal is a fluid that will take the shape of its container, their molecules are free to move like a liquid, but as they do they tend to remain oriented in a certain direction. The next figure illustrates the order present in the solid, liquid crystal and liquid phases (Collings, 2002):
Figure 1.1 – Order of the solid, liquid crystal and liquid phases (Collings, 2002)
2 Ana Sofia Reboredo César
The amount of order in the liquid crystal is reduced relative to a crystal. There is a tendency for the molecules to point in one direction than others or to spend more time in various positions than others.
There are three main types of liquid crystals: thermotropics (phase transitions caused by temperature change), lyotropics (the liquid crystal phase is only formed when mixed with a solvent, the solution concentration is the main factor to determine the stability of the liquid crystal phase) and polymers (when the polymer melts to a liquid crystal phase). (Collings & Hird, 2004). The thermotropic liquid crystal will be better explained ahead because lyotropic and polymers liquid crystals will not be used in this work.
Thermotropic Liquid Crystals
When a liquid crystal phase, in a certain temperature interval, is stable, it is called a thermotropic liquid crystal. This category includes pure compounds and mixture of compounds (Collings & Hird, 2004).
Thermotropic liquid crystals can be classified by the different shapes molecules present. These shapes can be: rod-like, disc-like, pyramid and tetrahedron; originating the following mesophases, respectively: calamitic, discotic, pyramidal and tetrahedral. Calamitic is the most common liquid crystal and it must have some rigidity so it can maintain its elongated form to promote the interactions which provide their orientation (Almeida, 2003). This kind of molecule consists in a nucleus, terminal chains and lateral substituent. The nucleus is usually a linear aromatic ring system which provides rigidity; the terminal chains are straight alkyl or alkoxy chains and provide flexibility to stabilize the molecular alignment within the mesophase (Maiau, 2009).
Ana Sofia Reboredo César 3
1.2.
Liquid Crystal Phases
The calamitic liquid crystal may present three phases: nematic, cholesteric and smectic. The last two phases are outside the scope of the present work, but will be represented in the next figure to show the differences between them.
Figure 1.2 – Schematic representation of nematic liquid crystal, cholesteric and smectic A and C (Senyuk)
The nematic liquid crystal is the simplest mesophase. In this phase, the molecules are preferably oriented in one direction, called director n, and molecular dipoles are compensated, so in equilibrium this mesophase is electrically neutral. Both directions of director, +n and -n, are equivalent (Senyuk). Optical dielectric and other properties of the medium are anisotropic (Madhusudana, 2001).
4 Ana Sofia Reboredo César
1.3.
Liquid Crystal Properties
1.3.1.
Anisotropy
In the liquid phase the molecules are completely disordered producing a phase in which all directions in space are equivalent. This property of obtaining the same value no matter the observation direction is called isotropy and the phase that has this property is called isotropic (Collings, 2002). The order present in the liquid crystals destroys the isotropy, producing anisotropy (no isotropy) in which different directions in the liquid crystal are not equivalent.
The anisotropy expresses itself in the elastic, electric, magnetic and optical properties of a material. Depending in which direction it is measured, the elastic modulus, dielectric constant, magnetic susceptibility and refraction index, give different results. (Collings & Hird, 2004)
There are two main types of anisotropy, the optic and the dielectric anisotropies. The optic anisotropy is related to the refraction indices of the compound, which are two, the ordinary index (no) and the extraordinary index (ne). The dielectric anisotropy defines the orientation of the
liquid crystal in the presence of an electric field, characterized by two dielectric constants, perpendicular (ε┴) and parallel (εװ) to the principal axes of the molecule (Melo C. A., 2009). These anisotropies will be better explained ahead.
1.3.2.
Birefringence
As said before, when a nematic liquid crystal is aligned, it results an anisotropic optical medium that is characterized by two refractive indices. A light beam splits itself in an “ordinary ray” and an “extraordinary ray” (Brugioni & Meucci, 2006).
Ana Sofia Reboredo César 5
Figure 1.3 – Light travelling through a birefringent medium (adapted from (Dias, 2010))
These refraction indices of the material can be defined as the ratio of the speed of light in vacuum to that in the material (Case Western Reserve University):
The maximum value for the birefringence is given by (Senyuk):
For typical nematic liquid crystals, no is approximately 1.5 and the maximum difference,
n, may range between 0.05 and 0.5 (Nunes, 2001). In the case of uniaxial liquid crystals the optic axis coincides with the director n (Senyuk).
It is convenient here to introduce the concept of optical path in the material since for the above two wave components passing with different speeds in a birefringent material, the difference in optical paths will lead to a change in the polarization state of the wave as it progresses through the medium. We define the optical path for a wave travelling a distance L in a crystal as nL so that the optical path difference for the two wave components mentioned above will be:
The resultant phase difference between the two components (the amount by which the slow, extraordinary component lags behind the fast, ordinary one) is:
6 Ana Sofia Reboredo César
The temperature dependence on the refractive indices is shown in the following figure.
Figure 1.4 – Temperature dependence on refractive index of a thermotropic liquid crystal (Senyuk)
1.3.3.
Liquid Crystal in Electric Field
If an electric field (E ) is applied to a nematic liquid crystal, this field will cause a slight charge separation on the liquid crystal molecules, creating weak dipoles moments (Collings & Hird, 2004). The orientational order is no greater than in the absence of an electric field, the difference is that in the presence of an electric field the liquid crystal director orients along the field. The electric field strength necessary to orient the liquid crystal director is low, since its director is free to orient in any direction (Collings, 2002).
The electric dipole per unit volume is called the electric polarization (P ). The polarization and the electric field are linearly dependent, and are related by the electric susceptibility (how easily a material is polarized by an electric field).
As said before, the dielectric anisotropy defines the orientation of the nematic liquid crystal in the presence of an electric field, and has a component of the permittivity along the director (εװ) and a component perpendicular to the director (ε ). The anisotropy in the permittivity is (Collings & Hird, 2004):
װ
This can be positive or negative, depending on the permanent dipole moment and polarizability of the molecule:
Ana Sofia Reboredo César 7
Δε<0: the molecules are aligned perpendicular to the applied electric field (Yakuphanoglu, Okutan, Koyosal, Ahn, & Keum, 2008).
Figure 1.5 – Dipole moment parallel to the long molecular (Δε>0): a – absence of electric field; b – presence of electric field (adapted from (Senyuk))
The following figure illustrates the temperature dependence on the dielectric permittivity, when the molecules are aligned with the electric field:
8 Ana Sofia Reboredo César
1.4.
Molecular Mobility
The properties of polymers strongly depend on their chemical structure. But there are many other factors that determine their macroscopic behavior, for example, molecular mobility, temperature and pressure conditions.
The polymeric materials dynamics is associated to a hierarchy of relaxation processes, which can be simple rotations around simple bonds (designated as γ, δ, β processes in a
increasing order of temperature at which they are detected) and segmental mobility of higher portions (designated as α process) involving a coordinated/cooperative motion of several
monomers (Melo, Moreno, Burrows, & Gil, 2004). The next figure represents these mechanisms:
Figure 1.7 – Molecular motion that can be found in polymeric systems: a –(γ, δ, β processes), b –(α process) (adapted from (Viciosa, 2007))
Figure 1.7 a) illustrates the local mobility assigned to relaxations occurring in the glassy state, i.e, below the glass transition; and figure 1.7 b) depicts the cooperative segmental mobility assigned to glass transition dynamics (Viciosa, 2007). Dielectric relaxation spectroscopy is usually used to study these mobility mechanisms, which will be explained ahead. Firstly, a brief description on the different relaxation processes is given:
β relaxation
Ana Sofia Reboredo César 9 secondary relaxations. These secondary relaxations result from local molecular movements that are still active even when the polymer is in the glassy state. Within the secondary relaxations the β relaxation is the one that emerges at highertemperature, preceded by the δ and γ relaxations
with a more restricted dynamic character and characterized by shorter relaxation times.
The β relaxation is attributed to local movements which can result from limited rotations
of side groups. It is a process thermally activated, so the relaxation time dependency, τ, is Arrhenius type:
where τ is the relaxation time at an infinite temperature and Ea is the activation energy.
α relaxation
The α relaxation is assigned with the glass transition dynamics that is associated with micro-Brownian movements of the segmental chains (segmental mobility), which is a cooperative mechanism that means that a segment/monomer is moving together with its neighbors (cooperative motion of 20 or even 50 monomers (Williams, 1995)).
At the glass transition, the viscosity, η, and the relaxation time, τ, drastically increase so
10 Ana Sofia Reboredo César
1.5.
Polymer Dispersed Liquid Crystal (PDLC)
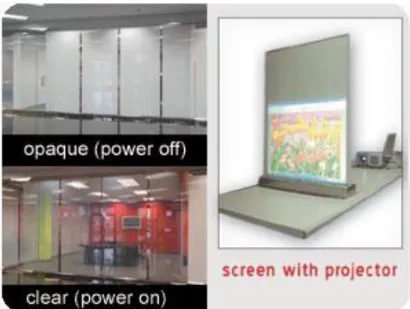
The PDLCs are nematic liquid crystal droplets dispersions in a continuous polymeric matrix, attracting the interest of researchers in the last years from both a basic and applicative point of view. The use of PDLC as electrically switchable light modulators has been widely investigated. Its principle operation is the electrically controlled re-orientation of the liquid crystal directors, which are randomly dispersed in droplets when the PDLC is in the OFF state. When an electric field is applied, the liquid crystal directors align parallel to the field direction, and the device is switched into a transparent ON state (Cupelli, et al., 2004). In the OFF state, the liquid crystal refractive indices (ne and no) are different from polymer refractive index producing a
strong light scattering that makes the sample opaque. When the PDLC is switched into the ON state, the sample appears transparent due to the matching of refractive index of liquid crystal droplets to polymer (Malik & Raina, 2004).
The transparence in OFF/ON state of the PDLC is dependent on the liquid crystal concentration, droplets size, shape and density, anchoring energy on the boundary surface, the physical properties of polymer matrix (He, Yan, Yu, Wang, Zeng, & Wang, 2007).
Figure 1.8 – Schematic PDLC in OFF and ON state (CMMPE)
PDLC films can be prepared by four different techniques: microencapsulation, thermally induced phase separation (TIPS), solvent induced phase separation (SIPS) and polymerization induced phase separation (PIPS). The method frequently used to prepare a PDLC sample is the PIPS method (Malik & Raina, 2004).
Ana Sofia Reboredo César 11 through the application of heat, light or radiation. The growing polymer chains phase separates from the liquid crystal to form a matrix (Drzaic, 1998).
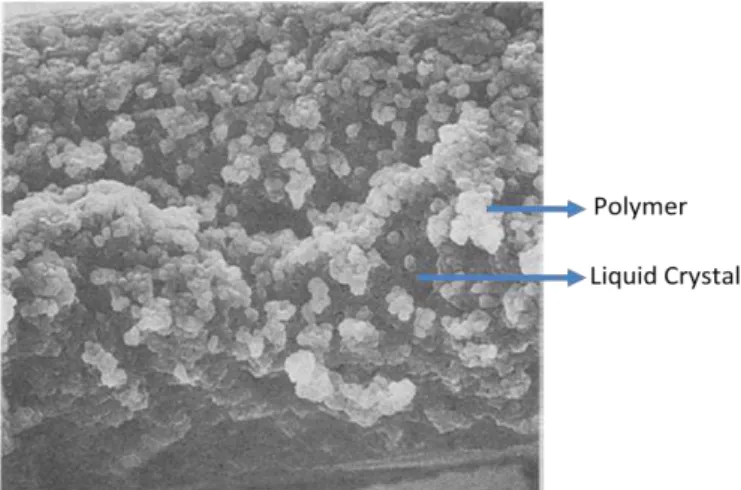
It is known from the literature there are present two types of PDLC morphology: “Swiss Cheese” and “Polymer Ball” (Torgova, Dorozhkina, Novoseletskii, & Umanskii, 2004). Both types can be electrically switched from the light-scattering (OFF) to a transparent state (ON) (Fuh, Lee, & Ho, 2002). The different configurations can be explained by the conditions under which phase separation occurs. As polymerization continues, the discontinuous phase will continue to form more nuclei and the existing nuclei will continue to grow. This process will continue until: all of the isolated regions of the discontinuous phase meet and merge, or the growth of the discontinuous phase is halted by either rigidification of the polymer matrix or cessation of polymerization. (Justice, 2006)
1.5.1.
“Swiss Cheese” Morphology
In this morphology spherical liquid crystal droplets are embedded in the polymer matrix. The nuclei of the insoluble component form a discontinuous, in this configuration the discontinuous phase is the liquid crystal (Justice, 2006).
The liquid crystal molecules can have three types of alignment with the polymer. If the molecules prefer the perpendicular alignment (radial configuration), there might be a center point defect, as we can see in the figure 1.9 a). If the molecules lie parallel to the droplet surface (bipolar configuration), two defect points occur (figure 1.9 b)) (Collings, 2002). If the molecules are oriented perpendicular to the droplet wall (axial configuration), but only when there is weak surface anchoring, this creates a line defect that runs around the equator of the spherical droplet (figure 1.9 c)) (Case Western Reserve University).
12 Ana Sofia Reboredo César
The configuration is related to the chemical nature of the polymer material, to minimize the elastic free energy (Han, 2006).
Figure 1.10 –SEM image of the “Swiss Cheese” morphology (adapted from (Justice, 2006))
1.5.2.
“Polymer Ball” Morphology
The “polymer ball” morphology have a continuous liquid crystal phase embedded in a
polymer bead matrix. The nuclei of the insoluble component form a discontinuous, in this configuration the discontinuous phase is the polymer (Justice, 2006). It is characterized by asymmetric voids in the polymer matrix in which the liquid crystal exists. The polymer phase appears as a collection of agglomerated microspheres forming an irregular network within the nematic fluid (Drzaic, 1998).
Ana Sofia Reboredo César 13
Figure 1.11 –SEM image of the “Polymer Ball” morphology (adapted from (Justice, 2006))
1.5.3.
Hysteresis and the permanent memory effect
PDLC film electro-optical property is influenced on the size and morphology of liquid crystal domains (Ryu, Choi, & Suh, 2006). As said before, by the application of electric field, PDLCs devices switch from opaque to transparent. After removal of the voltage applied the film returns to its original state. Usually PDLC devices do not exhibit any significant hysteresis (Torgova, Dorozhkina, Novoseletskii, & Umanskii, 2004).
Figure 1.12 – PDLC electro-optic study with no hysteresis (adapted from (Maiau, 2009))
14 Ana Sofia Reboredo César
Figure 1.13 – PDLC electro-optic study with hysteresis effect (Drzaic, 1998)
Sometimes, when the electric field is removed, the PDLC film transmittance does not return to its original opaque state, maintaining some of the transparency, which is called permanent memory effect. This memory effect occurs since the liquid crystal molecules could not relax back completely, but the molecules remain aligned in the direction of the electric field after its removal (He, Yan, Yu, Wang, Zeng, & Wang, 2007). Many experiences show that permanent memory effect cannot be found in samples having the “Swiss cheese” morphology, but it is found in the samples having the “polymer ball” configuration (Han, 2006).
Figure 1.14 – PDLC electro-optic study with permanent memory effect (Drzaic, 1998)
The percentage of the permanent memory effect can be defined:
ermanent emory ect
where, TON is the transmittance when the voltage is applied, TOFF the transmittance when the
Ana Sofia Reboredo César 15 The memory state is thermally destroyed at a temperature that is normally below the clearing temperature (Han, 2006).
1.5.4.
PDLCs Applications
PDLC films have a great potential for large-area displays and tunable transmission devices since they can be switched electrically between an opaque state and a transparent state (Chen, Chen, Sun, & Wu, 2006).
In principle, PDLCs have many advantages over conventional liquid crystal devices, since they do not need alignment layers and polarizers, thus increasing brightness, reducing power consumption and simplifying manufacture processing (Han, 2006) and are easier to prepare for a large area display (Ryu, Choi, & Suh, 2006).
They can be used for a wide optical applications including, switchable windows, displays, spatial light modulators, tunable filters and other devices. The PDLC materials can also be thermally switched from scattering light to transparent state, providing other types of applications such as thermal sensors and active elements in thermal memory all-optical devices (Hoppe, Galante, Oyanguren, & Williams, 2004).
16 Ana Sofia Reboredo César
2.
Experimental work
In this chapter will be described in two main sub-chapters the materials and methods used in the following work. The first sub-chapter will be about the chemical compounds used for the realization of this work (oligomers, liquid crystal and initiators). In the second sub-chapter will be described preparation methods and the different characterization techniques used.
2.1.
Materials
2.1.1.
Oligomers
In this work, two commercial oligomers were used, poly(ethylene glycol)diacrylate and poly(ethylene glycol)dimethacrylate, both from Aldrich.
Figure 2.1 – Chemical structure of poly(ethylene glycol)diacrylate
The oligomer PEGDA is colorless liquid with a molecular weight of 700 g/mol (n = 13). The CAS number is 26570-48-9.
Figure 2.2 – Chemical structure of poly(ethylene glycol)dimethacrylate
Ana Sofia Reboredo César 17
2.1.2.
Liquid Crystal, E7
In the present work the liquid crystal E7, by Merck, is used. This liquid crystal is a multicomponent nematic mixture that has been widely used to its high optical anisotropy and large temperature range where it maintains the anisotropy characteristics (Brás, et al., 2007).
E7 is made of four cyanobiphenyls in different proportions and it was used without any purification.
Figure 2.3 – E7 mixture components (Brás, et al., 2007)
Table 2.1 – Composition of the multicomponent nematic mixture E7
Liquid Crystal
(short name) Liquid Crystal
Composition (w/w)
5CB 4-Cyano-4’-n-pentyl-byphenyl 51%
7CB 4-Cyano-4’-n-heptyl-byphenyl 25%
8OCT 4-Cyano-4’-n-oxyoctyl-byphenyl 16% 5CT 4-Cyano-4’’-n-pentyl-p-terphenyl 8%
This liquid crystal shows a single nematic to isotropic transition (TNI) at 61ºC and a glass
18 Ana Sofia Reboredo César
2.1.3.
Initiators
Two types of initiators were used in this work, a thermal initiator and a photochemical initiator.
The thermal initiator used was the AIBN (azobisisobutyronitrile) from Merck and can be found under the CAS number 78-67-1. The molecular formula is C8H12N4 and it has a molecular
weight of 164.24 g/mol.
When heated at least at 64ºC, AIBN decomposes to form two free radicals with the liberation of nitrogen. The two free radicals that are initially formed can react initiating the polymerization reaction (Netherlands, 2002).
The decomposition of AIBN is shown in the following reaction:
Figure 2.4 – AIBN molecular structure and radical formation
For the photochemical polymerization the initiator used was XDT (p-xylylene bis-(N,N-diethyldithiocarbamate)) which on irradiation produces a chain-initiating carbon-centered radical and a sulfur-centered dithiocarbamate radical which can reversibly terminate the propagation chains. This initiator is named iniferter (initiator-transfer-terminator) and serves to reduce the concentration of the propagating species and thus the incidence of radical – radical termination during irradiation. When the UV radiation is off the dithiocarbamate radical terminates growing radical chains (Dean & Cook, 2002).
Ana Sofia Reboredo César 19
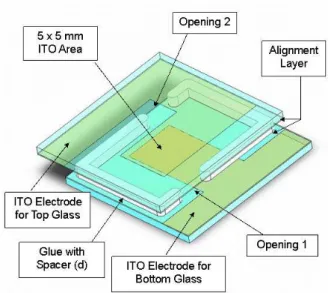
2.1.4.
Cells
To contain the PDLC film and electric field application were used commercial ITO cells from Instec, Inc. These cells have the following characteristics:
Table 2.2 – ITO characteristics
Part
Number Cell Type
ITO area (mm)
Cell gap (µm)
Cell thickness
(mm)
ITO resistance
(Ω)
LC2-9.0 Homogenous Alignment, Anti-parallel Rubbing with 1º to 3º
pre-tilted angle
5 x 5 9.0+0.2 1.5 100
LC2-20.0 20.0+0.2
The adhesive used in construction of these cells is rated to 200ºC.
Figure 2.6 – ITO cell
20 Ana Sofia Reboredo César
2.2.
Methods
2.2.1.
Preparation of the PDLC samples
The mixture oligomer, initiator and liquid crystal were weighted in a Kern 770 balance, in a Shimadzu AY120 balance or in a Radwag AS 120/C/1 balance, with the same characteristics (max=120g and d=0.1mg). These components were in an eppendorf and mixed in a Janke&Kunkel VF2 vortex until it became a homogeneous mixture. This mixture was inserted in the ITO cell (20µm) by capillarity and then polymerized photochemically or thermally.
The mixtures were always prepared the same way and in the same weight proportion. Oligomer and E7 are 30% and 70% respectively, and is included 1% relatively to the oligomer weight of initiator.
2.2.2.
Polymerization
In the present work all the polymerizations, thermal and photochemical, were based on radical polymerization. This type of polymerization is probably the most important commercial process leading to high molar mass polymers. The free radical mechanisms have three steps: initiation (the creation of the radical), growth or propagation (the successive additions of oligomer to the radical) and termination (the mutual reaction of two radicals to produce inactive polymer) (Colombani, 1997).
Initiation:
Propagation:
Ana Sofia Reboredo César 21
2.2.2.1.
Photochemical polymerization
As said earlier the initiator used for the photochemical polymerization was XDT. For a period of time, the sample is irradiated with monochromatic ultra-violet light until the oligomer is completely polymerized.
The photochemical polymerization occurred in an Oriel 60115 equipment, with a 100W mercury medium pressure lamp and powered by an Oriel 68800. The time of the polymerization is measured by the second in a guillotine-type time counter. The lamp housing is cooled by a water circuit and a rotary fan. The 366 nm UV light emission is selected by the following filters:
A water filter that absorb at wavelengths higher than 2800 nm; A glass filter that absorb at wavelengths lower than 300 nm;
A BG3 filter that transmits at wavelengths between 250 and 500 nm; A filter that transmits at wavelengths between 360 and 370 nm.
Figure 2.7 – Photochemical polymerization system set Cooling Rotary Fan
Lamp Housing
Power Supply
Time Counter Cooling Water Circuit
22 Ana Sofia Reboredo César
The actinometry (see Appendix I) is a method used to calculate the number of photons that are absorbed by the sample.
Using the following equation, it can be determined the radiation intensity by chemical actinometry:
To a 366 nm wavelength, F = 2.775x10⁻⁶.
By this method was calculated the radiation intensity that was used in this work, that is 1.119x10⁻⁵ Nhmin-1.
2.2.2.2.
Thermal polymerization
The sample is polymerized in a handmade oven, with AIBN as thermal initiator. This oven was used for the two different oligomers and in three different temperatures (66ºC, 74ºC and 80ºC), to study the polymerization time and the oligomer conversion. The PDLC samples were heated at 74ºC until all the oligomer is polymerized.
Ana Sofia Reboredo César 23 The next figure is a possible polymer structure for PEGDMA (it does not matter if the polymerization is thermal or photochemical):
Figure 2.9 – PEGDMA possible polymer structure (Oh & Rey, 2000)
For PEGDA an identical polymer structure should be expected, since the oligomer is similar to PEGDMA (it has one methyl radical on each side of the chain).
2.2.3.
Characterization methods
2.2.3.1.
Fourier Transform Infrared Spectroscopy (FTIR)
The infrared spectrum is the sample fingerprint with absorption peaks which correspond to the vibration frequencies between the bonds between the atoms. Because each material is a unique combination of atoms, there cannot be two compounds with the exact same spectrum (Thermo Electron Corporation, 2005).
24 Ana Sofia Reboredo César
Figure 2.10 – FTIR apparatus
The dispersive instruments have some limitations, to overcome that limitations was developed the FTIR spectrometry. The main difficulty was the slow scanning process (Thermo Electron Corporation, 2005). FTIR spectrometer collects all wavelengths simultaneously. It is a method of obtaining infrared spectra by first collecting an interferogram of a sample signal using an interferometer, and then performing the Fourier Transform on the interferogram to obtain the spectrum (Newport Corporation). The time element per sample is reduced from several minutes to a few seconds (Thermo Electron Corporation, 2005).
Ana Sofia Reboredo César 25
Figure 2.12 – FTIR layout (Thermo Electron Corporation, 2005)
Sample preparation
It was prepared two KBr disks and in the middle of it, there was placed a drop of the mixture (see chapter 2.2.1.). The sample is placed in a proper support and then is polymerized (thermal or photochemical). During the polymerization the sample is analyzed by FTIR a few times so the polymerization can be followed.
The spectra and oligomer conversion are analyzed in Microsoft Office Excel application developed for these propose. The oligomer conversion is calculated by a relation of the absorption peaks of the infrared spectra. The conversion measured in time can be calculated by the following formula:
26 Ana Sofia Reboredo César
2.2.3.2.
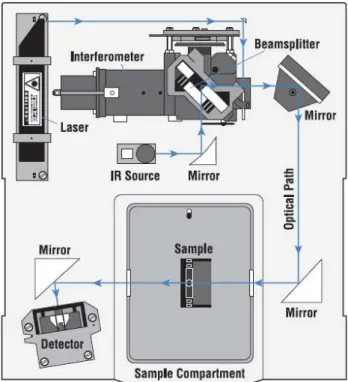
Electro-optic studies
PDLC electro-optics characterization is based on the voltage dependence of the light transmission coefficient. Where the amplitude of the alternating current excitation voltage was changed in cycles between the lower and higher selected amplitudes to verify if we are in the presence of hysteresis or memory effect.
Figure 2.13 – Electro-optic system
The optical part consists in a diode array Avantes spectrophotometer (AvaLight-DHS and AvaSpec 2048) using 633nm light by means a Halogen lamp and optical fiber cables. The electrical pulse is generated by a programmable waveform generator (Wavetek 20MHz Synthesized Function Generator Model 90), which creates an AC wave with a low amplitude between 0VRMS
and 27VRMS.The generator is linked to a Vtrek TP-430 amplifier (the current intensity will be lower;
however the voltage will be higher) reaching a voltage of 47VRMS. The transformer will multiply
the voltage in a scale of 9VRMS to 220VRMS. The first resistance (1Ω) has the purpose of securing the
amplifier form short-circuits and the second resistance (150kΩ) purpose is to standardize the voltage wave. The amplifier is fed by a Kiotto KPS 1310 power supply. The output detector (AvaSpec-2048) is connected to a computer software data acquisition.
Sample Holder Amplifier Power Supply
Amplifier
Generator Transformer and
Resistances Multivoltmeter
Ana Sofia Reboredo César 27
Figure 2.14 – Schematic representation of the electro-optic system
All measurements were performed at 1KHz. The applied voltage is measured by a multivoltmeter (Iso-Tech IDM71) and the waveshape is observed by an oscilloscope (Tektronix TDS 210).
The study is divided in three cycles, corresponding to 1/3, 2/3 and 3/3 of the maximum voltage applied (400V). Each cycle has 35 experimental points and each point (transmittance
versus applied voltage) is done in 1 second. The pulse is applied to the sample 10 ms after triggered and has the duration of 200 ms.
28 Ana Sofia Reboredo César
2.2.3.3.
Dielectric Relaxation Spectroscopy (DRS)
Dielectric relaxation spectroscopy has become an important tool for the characterization of materials of physical, chemical and biological application (García-Sanchez, et al., 2003). This technique may provide useful information since it monitors the molecular mobility through the reorientation of molecular dipoles under the influence of a small oscillating electric field (Brás, et al., 2008).
Figure 2.16 – DRS apparatus
Dielectric relaxation is the dispersion of the real permittivity (ε’) and the occurrence of dielectric absorption (ε’’) in the frequency domain for dipolar materials. This is due to the reorientational motions of molecular dipoles (Kremer & Schönhals, 2003). The variation of the dielectric permittivity with frequency during the dielectric relaxation may be described by the classical Debye model (García-Sanchez, et al., 2003):
where ε*(ω) is the complex dielectric permittivity. The mathematical description of the dielectric
response requires the formalism of complex variables since there is some delay between the applied stimulus (oscillating electric field) and the system response (polarization).
The dielectric material under electric field induces a deformation in the charge distribution, inducing the dielectric polarization (Viciosa, 2007). This polarization can be:
Ana Sofia Reboredo César 29
Figure 2.17 – Frequency response of dielectric displacements representing the polarization phenomena (Mautritz)
The dipolar reorientations are characteristically slow and, at high frequencies, the molecular dipoles lose the orientational polarization. The relaxation time, τ, is the required time to the polarization decrease a factor of from its initial value for a process characterized by a single relaxation time. Real processes usually have, as already mentioned, a distribution of relaxation times since several dipoles are being probed simultaneously having different environments. As a consequence, the peak of the imaginary component of the dielectric response (’’) widens.
The temperature dependence of the characteristic relaxation time of an -process exhibits some curvature in an activation plot (-log vs 1/T). This departure from linearity is often described by the empirical Vogel-Fulcher-Tamman (VFT) law (Vogel, 1921) (Fulcher, 1925) (Tammann & Hesse, 1926)
where τ, B and T0, the so-called Vogel temperature, are empirical parameters characteristic of
the material.
Ana Sofia Reboredo César 31
3.
Experimental results and their analysis
In this chapter will be described and analyzed the experimental results obtained.
This work is focused on the liquid crystal mobility and in the memory effect in a PDLC. PEGDA and PEGDMA oligomers were used to form a polymeric matrix. The polymerization was performed photochemically and thermally. The polymer conversion was calculated by FTIR spectroscopy and PDLCs were studied using electro-optics and DRS techniques
These different polymers were photochemical and thermal studied, and characterized by FTIR spectroscopy, DRS and electro-optic analyzed.
3.1.
PEGDA
3.1.1.
Photochemical polymerization
The mixture contained oligomer and liquid crystal in the proportion of 30/70% (w/w). The sample is irradiated at 366nm.
Figure 3.1 – FTIR Spectrum of PEGDA (1% XDT) photochemically polymerized
0 0,2 0,4 0,6 0,8 1 1,2 1,4 1,6 1,8 2
1450 1550 1650 1750 1850 1950
A b sor b an ce
wavenumber (cm-1)
PEGDA (1% XDT)
32 Ana Sofia Reboredo César
Figure 3.2 – PEGDA (1% XDT) oligomer conversion photochemically polymerized
As it was explained before the C=C band at wavenumber 1635 cm-1 is decreasing its intensity, as it was expected. The C=O band maintains its intensity, however a second peak appears as the neighborhood of this group is not the same throughout the polymerization. As the polymerization occurs, the C=O bond can be near the acrylate group or near the C–C bond. The oligomer has almost 65% of conversion after 1 minute of polymerization.
3.1.2.
Thermal Polymerization
The thermal study was performed at three different temperatures, and with two different mixtures for each temperature. One mixture just has the oligomer and the initiator, and the other also contains the liquid crystal (see the results of the last one in Appendix II).
0 0,1 0,2 0,3 0,4 0,5 0,6 0,7 0,8 0,9 1
0 0,5 1 1,5 2 2,5
Ol
ig
o
m
e
r C
o
n
v
e
rsi
o
n
Ana Sofia Reboredo César 33
Oven at 66ºC
Figure 3.3 – FTIR Spectrum of PEGDA (1% AIBN) thermally polymerized (66ºC)
The C=C band at wavenumber 1635 cm-1 is decreasing its intensity, as it was expected. The C=O band maintains its intensity, however a second peak appears as the neighborhood of this group is not the same throughout the polymerization. As the polymerization occurs, the C=O bond can be near the acrylate group or near the C–C bond.
Figure 3.4 – PEGDA (1% AIBN) oligomer conversion thermally polymerized (66ºC)
0 0,2 0,4 0,6 0,8 1 1,2 1,4 1,6 1,8
1450 1550 1650 1750 1850 1950
A b sor b an ce
wavenumber (cm-1)
PEGDA (1% AIBN)
0 min 30 min 60 min 120 min 180 min 240 min 0 0,1 0,2 0,3 0,4 0,5 0,6 0,7 0,8 0,9 1
0 50 100 150 200 250 300
34 Ana Sofia Reboredo César
By the analysis of the previous figures, we can observe that the oligomer PEGDA at 66ºC has 78% of conversion after 100 minutes of polymerization.
Oven at 74ºC
Figure 3.5 – Spectrum of PEGDA (1% AIBN) thermally polymerized (74ºC)
The C=C band at wavenumber 1635 cm-1 is decreasing its intensity, as it was expected. The C=O band maintains its intensity, however a second peak appears as the neighborhood of this group is not the same throughout the polymerization. As the polymerization occurs, the C=O bond can be near the acrylate group or near the C–C bond.
0 0,2 0,4 0,6 0,8 1 1,2 1,4 1,6 1,8 2
1450 1550 1650 1750 1850 1950
Ab
so
rb
an
ce
wavenumber (cm-1)
PEGDA (1% AIBN)
0 min
5 min
15 min
30 min
Ana Sofia Reboredo César 35
Figure 3.6 – PEGDA (1% AIBN) oligomer conversion thermally polymerized (74ºC)
By the analysis of the previous figures, we can observe that the oligomer PEGDA at 74ºC has 70% conversion after 30 minutes of polymerization.
Oven at 80ºC
Figure 3.7 – Spectrum of PEGDA (1% AIBN) thermally polymerized (80ºC)
0 0,1 0,2 0,3 0,4 0,5 0,6 0,7 0,8 0,9 1
0 10 20 30 40 50 60 70
Ol ig o m e r C o n v e rsi o n Time (min) 0 0,2 0,4 0,6 0,8 1 1,2 1,4 1,6 1,8 2
1450 1550 1650 1750 1850 1950
A b sor b an ce
wavenumber (cm-1)
PEGDA (1% AIBN)
36 Ana Sofia Reboredo César
The C=C band at wavenumber 1635 cm-1 is decreasing its intensity, as it was expected. The C=O band maintains its intensity, however a second peak appears as the neighborhood of this group is not the same throughout the polymerization. As the polymerization occurs, the C=O bond can be near the acrylate group or near the C–C bond.
Figure 3.8 – PEGDA (1% AIBN) oligomer conversion thermally polymerized (80ºC)
By the analysis of the previous figures, we can observe that the oligomer PEGDA at 80ºC has 70% conversion after 20 minutes of polymerization.
The following table is a resume of the FTIR results, showing the maximum oligomer conversion and the necessary time to achieve it.
Table 3.1 – Summary of FTIR results
Photochemical
Polymerization
Thermal Polymerization
66ºC 74ºC 80ºC
Oligomer Conversion 65% 78% 70% 70%
Time (min) 1 100 30 20
An identical oligomer conversion was achieved for the mixtures containing liquid crystal (see Appendix II).
0 0,1 0,2 0,3 0,4 0,5 0,6 0,7 0,8 0,9 1
0 10 20 30 40 50 60 70
Ana Sofia Reboredo César 37
3.1.3.
Electro-optic study
The next two figures show the electro-optics studies for the two PDLCs. One was photochemically polymerized and the other was thermally polymerized, but both have the same oligomer.
Figure 3.9 – Electro-optic study of PEGDA (1% XDT) + E7
The cell has a good opacity (5% of transmittance) in the initial state. After applying 5V/µm the cell has a transmittance of 80% and OFF state (after the removal of the electric field) it has a transmittance of 50%. The PDLC has a permanent memory effect of 60%.
0 10 20 30 40 50 60 70 80 90 100
0 5 10 15 20
Tr
an
sm
itt
an
ce
38 Ana Sofia Reboredo César
Figure 3.10 – Electro-optic study of PEGDA (1% AIBN) + E7
The cell has a good opacity (0% of transmittance) in the initial state. After applying 7V/µm the cell has a transmittance of 80% and OFF state (after the removal of the electric field) it has a transmittance of 56%. The PDLC has a permanent memory effect of 70%.
The PDLC thermally polymerized was utilized in the DRS spectroscopy after this electro-optic study.
3.1.4.
Dielectric relaxation spectroscopy
Dielectric measurements were performed after the electro-optic study with the sample contained in an ITO cell, electrically aligned, as explained before. The sample was cooled from room temperature down to -100 ºC and several dielectric spectra were collected between -100 to 80ºC in steps of 5ºC and within a frequency range from 10-1 to 106 Hz. Figure 3.11 shows the temperature dependence of the real part of the complex permittivity at 105 Hz.
0 10 20 30 40 50 60 70 80 90 100
0 5 10 15 20
Tr
an
sm
itt
an
ce
Ana Sofia Reboredo César 39
Figure 3.11 – DRS analysis of PEGDA (1% AIBN) + E7 at a frequency of 105 Hz
From the ’(T) plot two important transitions related to the liquid crystal are observed. The first transition, marked as A, corresponds to the glass transition. By the analysis of the figure 3.11, it can be seen that the glass transition of both curves are very similar. If we take the temperature value at the onset of the transition upon heating, a value of around -40ºC is estimated. This transition is a kinetic phenomenon therefore is frequency dependent being the reason why the value is shifted comparing to the one estimated from DSC measurements to the E7 liquid crystal (-64ºC/-67ºC see figure 6.14 and 6.15 in Appendix III). To obtain a better agreement between the values provided by both techniques, the plot of the real permittivity should be made at a much lower frequency giving a concomitant shift of the estimated value to lower temperatures (we will come to this point later in text). However, the frequency, 105 Hz, was chosen since it was the frequency where the transition designated as B was more evident. This second transition corresponds to the nematic-isotropic transition. This event is not frequency dependent, because is a first order thermodynamic phenomenon. Analyzing the figure it is shown that the transition is at 55ºC for the neat liquid crystal and 65ºC for the liquid crystal in the polymeric matrix. The value is in excellent agreement with the one calorimetrically obtained (57.4ºC/58.7º see Appendix III, figures 6.14 and 6.15).
The imaginary part (’’), which appears as a bell-shaped curve, was also measured between -100 and 80ºC. Figure 3.12 shows only some representative temperatures between -60 and 0ºC for the electrically aligned sample.
0 2 4 6 8 10 12 14 16
-110 -90 -70 -50 -30 -10 10 30 50 70 90
40 Ana Sofia Reboredo César
Figure 3.12 – Dielectric relaxation from PDLC between -60 and 0ºC
From the location of the maximum in each ’’ curve collected at a specific T (enhanced in figure 3.12 by a full circle) an activation plot was drawn (figure 3.13). This plot is compared with the one obtained for the neat E7 (open symbols in figure 3.13). Although a deep analysis of the dynamical behavior is out of the scope of this work, we can infer that the mobility of the liquid crystal impregnated in the polymer does not undergo significant changes relative to the neat liquid crystal. Within the temperature range from which the maxima positions were taken (from -60 to 0 ºC) the characteristic relaxation time changes more than 6 decades in magnitude. Moreover, an estimation of its glass transition temperature can be predicted by adjusting the parameters of the VFT law to the experimental points. The VFT fit was carried out for the aligned PDLC obtaining τ = 9.03x10⁻¹² sec, B = 1200.436 K and T0 = 165.919 K. From this parameters a
dielectric glass transition temperature can be estimated by extrapolating the VFT equation to τ=100s (Richert & Blumen, 1994) giving a value of -67.26ºC in excellent agreement with the glass transition for the neat liquid crystal given by the same method (-63ºC) and by DSC (see Appendix III). 0 0,2 0,4 0,6 0,8 1 1,2 1,4 1,6
0,1 1 10 100 1000 10000 100000 1000000
Ana Sofia Reboredo César 41
Figure 3.13 – Activation plot of PDLC and neat E7
After the first run to 80ºC, the sample was cooled down to -100ºC and a second run of isotherms was carried out between -100ºC and 180ºC, in steps of 5ºC. The following figure compares the dielectric relaxation processes of the liquid crystal confined in the polymer at -40ºC in the two runs. The spectrum of neat E7 is also included for comparison. This temperature was chosen since the main peak emerges in the centre of the frequency window.
Figure 3.14 – Dielectric relaxation at -40ºC for the neat E7 and PDLC before and after heating above TNI
0 1 2 3 4 5 6 7
3,5 4 4,5 5
-lo g ( τ ) 1000/T(K) PEGDA+E7 E7 0,1 1 10
1 10 100 1000 10000 100000 1000000
Im ag in ar y Pe rm itiv ity (ε' ') Frequency (Hz)
PDLC (1st Run - aligned) PDLC (2nd Run - after TNI) E7 A||
42 Ana Sofia Reboredo César
Ana Sofia Reboredo César 43
3.2.
PEGDMA
3.2.1.
Photochemical Polymerization
The mixture contained oligomer and liquid crystal in the proportion of 30/70% (w/w). The sample is irradiated at 366nm.
Figure 3.15 – Spectrum of PEGDMA (1% XDT) photochemically polymerized
The C=C band at wavenumber 1635 cm-1 is decreasing its intensity, as it was expected. The C=O band maintains its intensity, however a second peak appears as the neighborhood of this group is not the same throughout the polymerization. As the polymerization occurs, the C=O bond can be near the acrylate group or near the C–C bond.
0 0,2 0,4 0,6 0,8 1 1,2 1,4 1,6 1,8 2
1450 1550 1650 1750 1850 1950
A b sor b an ce
wavenumber (cm-1)
PEGDMA (1% XDT)
44 Ana Sofia Reboredo César
Figure 3.16 – PEGDMA (1% XDT) oligomer conversion photochemically polymerized
By the analysis of the previous figures, we can observe that the oligomer PEGDMA photochemical polymerized has 70% of conversion after 2.5 minutes of polymerization.
3.2.2.
Thermal Polymerization
The thermal study was performed at three different temperatures, and with two different mixtures for each temperature. One mixture just has the oligomer and the initiator, and the other also contains the liquid crystal (see the results of the last one in Appendix II).
0 0,1 0,2 0,3 0,4 0,5 0,6 0,7 0,8 0,9 1
0 0,5 1 1,5 2 2,5 3 3,5
Ol
ig
o
m
e
r C
o
n
v
e
rsi
o
n