Thermal Lens Spectrometry to
Study Complex Fluids
M. L. Baesso 1
, J. R.D. Pereira 1;2
, A. C. Bento 1
, A. J.Palangana 1
, A. M. Mansanares
2
, and L. R.Evangelista 1 1Departamento de Fsica, Universidade Estadual de Maringa,
Avenida Colombo, 5790, Maringa, Parana, Brazil
2Instituto de Fsica Gleb Wataghin, Universidade Estadual de Campinas,
Unicamp, 13083-970, Campinas, SP, Brazil
Received26October,1998
We describe applications of Thermal Lens Spectrometry to study optical and thermal prop-erties of lyotropic liquid crystal. In particular, we refer to methods for measurements of thermal diusivity anisotropy at dierent temperatures and as a function of the ferrou-ids doping. The theoretical basis for quantitative measurements is discussed together with the advantages and limitations as compared with conventional methods. Finally, future developments of photothermal techniques for these applications are assessed.
PACS numbers: 61.30.-v 61.30.Gd 65.70.+y
I Introduction
The importance of studying the properties of complex uids cannot be underestimated. For the liquid crystal families there are many important applications which are crucial in everyday life, such as the displays, electro-optical components, sensing, and so on. The liquid crystals have called the attention of many scientists of dierent areas because these systems present the ab-solutely unique ow phenomena which are very di-cult to understand since they combine the ow prop-erties of liquids with the orientational order of crystals driving the induced mass motion to an specic pat-tern which depends on both the applied forces into the system and their physical and chemical properties. For example, the application of external elds induces sym-metry changes with consequent modication on their texture and basic properties, such as the values of the elastic constant, magnetic susceptibility, refractive in-dex, viscosity, etc. [1-6] Laser induced refractive index changes have been widely employed in order to under-stand the liquid crystal systems [7-16]. By changing the beam power, experimental conguration and time scale of the experiments, many optically induced nonlinear mechanisms have been investigated [7]. In all of these previous studies, the experiments and theoretical
mod-els have been applied in thermotropic liquid crystal in order to obtain their fundamental properties. Thermal Lens Spectrometry(TLS) is a photothermal technique which is based on the change in the refractive index of the sample when it is illuminated by a laser beam. Re-cently, we have introduced this technique in the study of lyotropic liquid crystals [17,18]. TLS method was employed in order to measure the thermal diusivity anisotropy of the nematic phase of this family of liq-uid crystals. The geometrical form of the micelles was correlated to the anisotropy of the heat diusion in the two directions of the samples. Subsequent works [19-22] have been devoted to the study of the role of ferrouid in the lyotropic system, but a denitive description of the composed sample thermal anisotropy still needs to be presented.
studies is the need to determine rates of heat diu-sion into and through such a system which in turn re-quires measurements of physical-chemical properties of the obtained device. Although lyotropic liquid crystals have not yet been used for technological applications, their structure presents similarities with many biolog-ical systems [25] and therefore their basic properties may be useful for the understanding of these related systems. Although being desirable, it is not often pos-sible to make bulk or interfacial measurements of the thermal properties of this system because of the need to probe non-destructively and non-invasively the sample. It is for this reason that photothermal techniques are promising for the study of this system since they are non-contacting, sensitive, remote and easy to perform [25,26-31].
The aim of this paper is to discuss some of the re-cent advances in the thermal lens methods with special reference to the measurements of thermo-optical prop-erties of lyotropic systems. In particular, the mode-mismatched thermal lens method will be described in order to analyze the quantitative measurements in un-doped and ferrouid un-doped samples.
II Theoretical basis of thermal
lens spectrometry
All photothermal techniques are based in the use of electromagnetic radiation to induce non-radiative de-exitation of excited states resulting in a change in tem-perature of the tested sample. This temtem-perature rise can be measured through dierent processes. Many of the techniques use laser as the exitation beam. This brings advantages such as: high power density, coher-ence, directional and spatial stability, the possibility of probing very small volumes and the ability of perform-ing non-contactperform-ing measurements [27].
TLS is one of the photothermal techniques which is remote and quite sensitive. The TL eect is created when the excitation beam passes through the sample and the absorbed energy is converted into heat. The consequent change in the refractive index induced by a temperature rise will produce a lenslike optical element at the sample, the so-called thermal lens. The
propa-gation of a probe beam through the TL will be aected resulting in a spreading or focusing of the beam centre. By measuring its beam center intensity in the far eld, the optothermal properties of the sample can be deter-mined. Since the rst report of the thermal lens eect [32] the sensitivity of the technique has been improved by changing the experimental conguration. The mode-mismatched TLS method has been demonstrated to be the most sensitive [26]. In this case the sample is po-sitioned at the waist of the excitation beam, where the power density is maximum, Fig. 1. In these arrange-ment a TEM00 gaussian beam illuminates a sample, causing a thermal lens. A weak probe beam passes through the the sample to probe the thermal lens. The position of the waist of the probe beam is taken as the origin along theZaxis. The sample is located atZ
1and the detector plane is positioned at Z
1+ Z
2. The waist of the probe beam is!
op, the radius of the probe beam and the excitation beam in the sample are!
opand !
e, respectively. The theoretical treatment for the thermal lens eect needs to take into account realistic boundary conditions of the sample in both radial and axial direc-tions. Their theoretical basis have been developed and presented in the references [28,29,31,33,34]. A brief re-view of this three-dimensional model will be presented in this work, with special emphasis in the approaches necessary for the liquid crystal measurements.
There are three steps in deriving the aberrant model [33]. First, the temperature rise in the sample induced by the optical energy absorption is calculated. Second, the phase shift of the probe beam caused by the refrac-tive index change is obtained and nally, the Fresnel diraction theory is used to calculate the eld distri-bution of the probe beam in the detector plane. The model uses the following considerations: both the ex-citation and the probe beam lasers are Gaussian and in the TEM00 mode; The sample is homogeneous and obey the Beer's Law; detection of the probe beam is obtained in the Fresnel region.
A. Temperature rise in the sample
The dierential equation of conduction of heat in an isotropic sample can be written as[29, 38]
c
@ [T(r
1 ;
1
;z;t)],Dr 2[
T(r 1
; 1
;z;t)] = Q(r
1 ;
1 ;z;t)
Figure 1: Scheme of the geometric position of the beams in a mode-mismatched dual beam TL experiment.
In Eq. (1) (r 1
; 1
;z) are the cylindrical coordinates in the sample; T(r
1 ;
1
;z;t) is the temperature rise in the sample (K); Q(r
1 ;
1
;z;t), the heat source, is the heat generated per unit volume and unit time (J s,1 cm,3);
D=k=cis the thermal diusivity of the sam-ple (cm2 s,1), where
kis the thermal conductivity (W cm,1 K,1),
c the specic heat (J g
,1K,1), and the density (g cm,3) of the sample;
t is time (s) . The temperature rise can be obtained by solving this heat conduction equation with suitable heat source and ap-propriate boundary conditions.
In the TL experiment the heat source in Eq. (1) is the absorbed excitation energy by the sample assuming that all of the energy is converted to heat by nonradia-tive processes. The TEM00 Gaussian laser beam can be expressed as [35-39]
I e(
r) = 2 P
e !
2 e
exp
, 2r
2
! 2 e
; (2)
where I e(
r) and P
e are the intensity (W cm
,2) and total power (W) of the excitation beam, respectively. The heat generated due to the optical absorption per unit volume and unit time at (r
1,
z) in a medium with optical absorption coecientA(cm
,1), is then [36, 37]
Q(r 1
;z) =AI e(
r 1)exp(
,Az): (3)
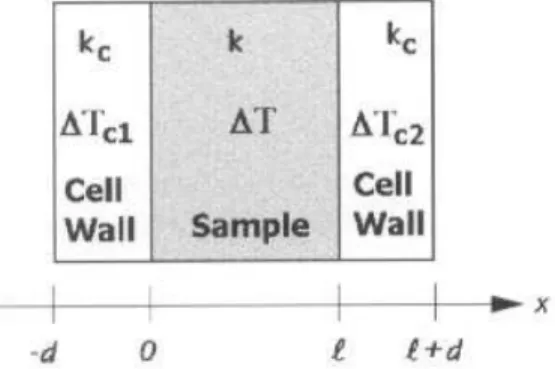
The 3D temperature distribution treatment takes realistic axial boundary condition, shown in Fig. 2, into account, while the radius of the sample is assumed as innite. In Fig. 2, the thickness of the sample cell wall is d (cm), and its conductivity is K
c (W cm
,1 K,1). T
c1 and T
c2 are the temperature rises in the cell walls. The boundary conditions are that temperature rises and heat uxes are continuous at the boundaries, z=,d;0;l, andl+d. Neglecting the heat capacity of the cell wall, we have
Figure 2: A schematic diagram of the sample and sample cell.
c
j @ @z
[T ci(
r 1
;z;t)]j'j T
ci( r
1
;z;t),0 d
j; (i= 1;2;z= 0;l; (4)
providing the temperature rise in air is zero. Considering the heat ux directions at the boundaries, the boundary condition can be expressed as [29,36,38]
@ @z
[T(r 1
;z;t)] =h[T(r 1
;z;t)]; (r 1
<1;z= 0;l); (5)
where h=k 0
=(kd).
The Green's function yielding the temperature rise at (r 1
; 1
;z) and timetfor a unit heat source at (r 0 1
; 0 1
;z 0) and time zero in the sample with the boundary condition, Eq. (5), is given (see [32,38]) as
G(r 1
;r 0 1
; 1
; 0 1
;z;z 0
;t) = e
,R 2
=(4Dt) 2Dt
1 X
n=1 A
n( z)A
n( z
0)
l( 2 n+
h 2) + 2
h e
,D 2 n
; (6)
A n( ) = ncos( n
) +hsin( n
): (7)
In Eqs. (6) and (7)
n represents the positive roots of
tan(l) = 2 h 2 ,h 2 ; (8) whereas R 2= r 2 1+ r 0 1 2 ,2r
1 r 0 1cos( 1 , 0 1) : (9)
The temperature rise in the sample is then
T(r 1
;z;t) = Z l 0 Z l 0 Z 1 0 Z 2 0 Q(r
0 1
;z 0)
c G(r
1 ;r 0 1 ; 1 ; 0 1
;z;z 0
;t)r 0 1 d 0 1 dr 0 1 dz 0 dt 0 : (10)
Substitution of Eqs. (3) and (6) into Eq. (10) yields
T(r 1
;z;t) = P e A t c k 1 X n=1 yn l cos , ynz l +hsin
, ynz l y 2 n
=l+lh 2+ 2
h F n Z t 0 1 1 + 2t
0 =t c exp , 2r 2 1 =! 2 e 1 + 2t
0 =t c ,D y n l 2 t 0 dt 0 ; (11) where y n= n l; (12) and F
n = exp(
,Al) A
2+ ( y n =l) 2 y 2 n l 2 ,Ah sin(y n) , y n l
(A+h)cos(y n)
+ y
n( A+h) A
2 l+y
2 n
=l)
: (13)
Furthermore, in Eq. (11)
t c= ! 2 e 4D (14) is a characteristic thermal time constant.
B. Phase shift of the probe beam
The refractive indexn(r 1
;z;t) of the sample is a function of temperature as
n(r 1
;z;t) =n 0+
dn dT
T(r 1
;z;t); (15)
wheren
0 is the refractive index at initial temperature. When the probe beam propagates through the TL its wave front is slightly distorted, and the distortion can be expressed as an additional phase shift, which can be found by considering the problem from the point of view of optical path length variation regarding the axis [35].
The phase shift (r 1
;t), therefore, is [35,36]
(r 1
;t) = 2 p Z l 0 [n(r
1
;z;t),n(0;z;t)]dz; (16)
where
(r 1
;t) = 2 t c 1 X n=1 sin(y n)
,(hl=y n)cos(
y n) +
hl=y n y
2 n
=l+lh 2+ 2
h F n Z t 0 1 1 + 2t
0 =t c exp ,D y n l 2 t 0 ,exp , 2r 2 1 =! 2 e 1 + 2t
0 =t c ,D y n l 2 t 0 dt 0 ; (17) where =, P e A p k dn dT : (18)
The TEM00Gaussian probe beam has emerged from the sample with the additional phase shift, (Eq.(17)) can then be expressed as [33,35,39]
U p( r 1 ;Z 1
;t) = 2P p 1=2 1 ! 1p exp ,j 1p 2Z 1+ r 2 1 R 1p
,j(r 1
;t), r 2 1 w 1p ; (19) where P p and R
1p are the total probe beam power (W) and the radius of the wave-front curvature of the probe beam atZ
1, respectively.
C. Propagation of the probe beam
The probe beam coming from the sample with the additional phase shift propagating to the detector plane can be treated as diraction by using Fresnel diraction theory [33,35,36], given as [40]
U p( r 2 ;Z 1+ Z 2
;t) = 1 p Z 2 exp ,j 2 p Z 2+ r 2 2 2Z 2 Z 1 0 U p( r 1 ;Z 1 ;t)exp
,j p r 2 1 Z 2 r 1 dr 1
G(r 1
;r 2)
; (20)
with
G(r 1
;r 2) =
Z 2 0 exp j 2 P r 1 r 2 Z 2 cos( 1 , 2) d 1 ; (21)
where (r 1,
1), (
r 2,
2) are the polar coordinates at the sample and at the detector plane, respectively. Substituting Eq. (19) into Eq. (20) and remembering that [41-43]
G(r 1
;r 2) = 2
J 0 2 p r 1 r 2 Z 2 ; (22) ! 2 1p= ! 2 0p[1 + (
Z 1 =Z c) 2] ; (23) and R 1p= (
Z 2 1+ Z 2 c) =Z 1 (24)
for the Gaussian probe beam, where
Z c= ! 2 0p = p (25)
Up(r2;Z1+Z2;t) =C Z
1
0
exp[,(1 +j)g,j(g;t)]J 0
2!er2
pZ2 p
mg
dg; (26) where
= Z1
Zc +Zc
Z2 "
1 +
Z1
Zc
2 #
; (27)
C=j!1p p
2Pp
pZ2 exp
,j
2 p
Z1+Z2+
r2 2 2Z2
; (28)
g= (r1=!1p)
2; (29)
and
m= (!1p=!e)
2; (30)
which is the degree of mismatching of the probe beam and excitation beams in the sample. Here J0 is the zeroth-order Bessel function. In Eq. (26) the phase shift of the probe beam is expressed as
(g;t) = 2t c
1 X
n=1 sin(yn)
,(hl=y
n)cos(yn) +hl=yn
y2 n=l+lh
2+ 2h F
n
Z
t
0 1 1 + 2t0=t
c
exp
,D y
n
l
2
t0
,exp
, 2mg
1 + 2t0=t c
,D y
n
l
2
t0
dt0: (31) Finally, the probe beam intensity distributionIp at detector plane is given as
Ip(r2;Z1+Z2;t) = jU
p(r2;Z1+Z2;t) j
2; (32)
which can be simplied asIp(t) when only the center point of the probe beam at the detector plane is considered. Whenm= 1, which is a mode-matched dual-beam or single-beam TLS situation, Eq. (26) becomes the same form as that obtained by Wu and Dovichi's[36].
In ref. [29] the comparison between 3D nite and 2D conventional innite models is made, in which a 2D innite conventional model for cw laser-induced mode-mismatched dual-beam TLS (Ref. [34]) is used, as:
T1(r1;t) =
PeA 2ktc
Z t
0 1 1 + 2t0=t
c exp
,
2r2 1=!
2 e 1 + 2t0=t
c
dt0; (33)
I(r1;t) =
tc
Z t
0 1 1 + 2t0=t
c
1,exp
, 2r2
1=! 2 e 1 + 2t0=t
c
dt0; (34)
UpI(r2;Z1+Z2;t) =C Z
1
0
exp[,(1 +j)g,j
I(g;t)]J0
2!er2
pZ2 p
mg
dg; (35) and
IpI(t) =IpI(0)
1,
2 tan,1
2m
[(1 + 2m)2+2](t
c=2t) + 1 + 2m+ 2
2
; (36) where
=l (37)
III Experimental
Thermal lens measurements can be performed for both time-resolved and steady state mode. Up to now, in the study of liquid crystal, we have used time-resolved methods and the experimental arrangement shown in Fig. 3. The excitation laser beam is a 6 W Ar+ laser (Coherent Innova 90 Plus ) at 514.5 nm or at 488 nm. The sample was put at the focal plane of the lens 1 and its expossure to the excitation beam was controlled by a shutter. The probe beam was an He-Ne laser at 632 nm. The output of the photodiod was coupled to a storage oscilloscope. The magnitude of the thermal lens sig-nal with time was recorded and the data thus obtained were processed using least-squares curve t.
Figure 3: Mode-mismatched thermal lens experimental setup.
The Lyotropic nematic liquid crystals studied were: sample 1) potassium laurate(29.4 wt%), decanol (6.6 wt%), water (64 wt%); sample 2) potassium laurate (34.5 wt%), potassium chlorate (3 wt%), water (62.5 wt%); sample 3) sample 1 doped with 0.08 wt% of ferrouid and sample 4 doped with 0.34 wt% of fer-rouid. Ferrouid enhance alignment of the micelles in the presence of a magnetic eld. The phase sequences of the samples were determined by optical microscopy and conoscopic observation. The axes of the directors were aligned in a magnetic eld for both orientations, paralell and perpendicular to the side walls. The mea-surements were performed at room temperature and also for dierent temperatures [17-19,21,22].
IV Thermal diusivity
measure-ments
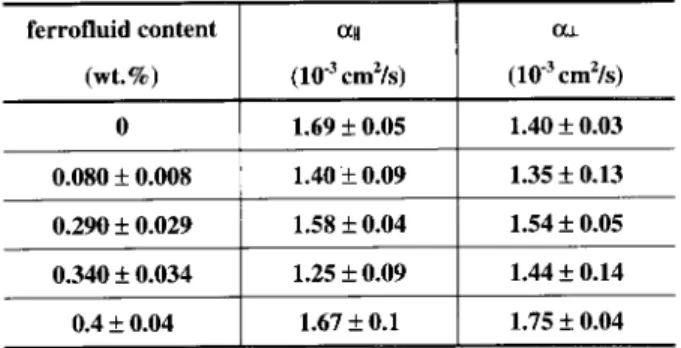
Fig. 4 shows the experimental data and the theoretical best curve tting of Eq. (36) for sample 3 with the mi-celles aligned parallel to the side walls. As it can be seen the signal intensity decreases with time, which means thatdn=dT <0. Table I shows the thermal difusivity results for the samples investigated in both, perpen-dicular and parallel directions of the director. For the undoped samples the ratios between the thermal dif-fusivity parallel and perpendicularD
k =D
? are around 1.2. In all of the results, the ratios between D
k =D
? are smaller than those measured for thermotropic liq-uid crystal, obtained by several techniques, which are about 2.0. In order to explain this dierence we have considered the sample as an array of thermal resistor of rode-like shape and developed the following equation [44,45]
D k D
?
= L(1 + 2S)=R+ (2,2S) L(1,S)=R+ (2 +S)
(38)
In Eq. (38) S is the scalar order parameter and L and R are the length and diameter of the cylinders respectively. Lyotropic liquid crystals in the nematic calamitic phase are mixtures composed of micelles with geometrical anisotropy shapes of about 1.6, while ther-motropic liquid crystals molecules length-to-width ra-tio is about 3.0 [46,47]. Using the above expressions we could nd the estimated value of D
k =D
? = 1 :3 for lyotropic samples and D
k =D
? = 1
:9 for ther-motropic ones. In this treatment the thermal diusiv-ity anisotropy was associated to the form of the micelles for lyotropic nematics and the molecular shape for ther-motropic liquid crystals, as predicted by Eq. (38). In contrast, for ferrouid doped samples, this treatment does not explain the thermal diusivity anisotropy val-ues. For both samples it can be observed, Table I, that the anisotropy decreases as ferrouid concentration in-creases (see also Fig. 5).
Figure 5: Parallel and perpendicular thermal diusivities as a function of ferrouid concentration.
Furthermore, the values of the thermal diusivity decreases as ferrouid concentration increases. These results suggest that ferrouid particles may play as an addition thermal resistence in the sample and their conection to the order parameter still need to be clari-ed.
V Future work
The ultimate goal in the study of thermal diusivity of lyotropic liquid crystal using photothermal technique is the determination of the role played by the ferrouid particles in the heat diusion process in both direc-tions of the sample. Based on recent results in this sys-tem [19, 21, 22] we have suggested that ferrouid par-ticles may induce an additional thermal barrier in the sample. These experiments were performed for both changing ferrouid concentration and the sample tem-perature. However, further studies to obtain a more de-tailed physical description of the thermal anisotropy of this doped liquid crystal are still required. This seems to be a dicult task, since the experimental discrimina-tion between the laser beam intensity change induced by both the doping and the liquid crystal itself is dif-cult. Furthermore, there are concentration gradient across the beam which may not be linear. In this way it is necessary to determine the gradient prole of the doping. This may be possible to investigate through time resolved measurements since the thermal diusiv-ity and gradient diusion coecients are usually at least two order of magnitude dierent.
about sample thermal expansion, polarizability, refrac-tive index, viscosity, etc. The study ofdn=dT in liquid crystal is also attracting due to the its unusual behav-ior. It has been observed in thermotropic liquid crys-tal, that the refractive index change can produce either laser beam self-focussing and defocusing, depending on the sample orientation and the laser beam polarization. The use of TLS as quantitative method to study liquid crystal through the tree-dimensional model re-viewed in this work needs to obey some experimental conditions, such as performing the measurements for a short period of time and with the ratio between the probe and excitation beam spot sizes at the sample no larger than 3. This procedure avoid heat diusion in the laser beam direction, which is not taken into account in the development of the model. For thin sample, such as liquid crystal, this heat ow can invalidate the obtained results.
In summary, with the introdution of thermal lens spectrometry, to study lyotropic liquid crystal we have investigated the lyotropic systems difusion rates and tried to associate the anisotropy of the thermal diusiv-ity with their structure. The method used is promiss-ing, since it is very sensitive, remote, non-cantacting and allows the determination of the absolute values of the sample thermo-optical parameters.
Figure 6: Sample holder and heating unity for the mode-mismatched thermal lens measurement.
Acknowledgments
We are gratefull to the Brazilian Agencies CNPq-PADCT (Contract n. 620810/95-5), FAPESP and CAPES for the nancial support of this work.
References
[1] P.G. de Gennes, The Physics of Liquid Crystals,
(Clarendon, Oxford, 2nd edition, 1993).
[2] S. Chandrasekhar, Liquid Crystals, (Cambridge
Uni-versity, Cambridge, 1977)
[3] A.J. Palangana, L.R. Evangelista and A.K. Zvezdin, Phys. Lett. A200, 56(1995).
[4] M. Sim~oes, A.J. Palangana, and L.R. Evangelista. Phys. Rev. E54, 3765(1996).
[5] A.J. Palangana, M. Sim~oes, L.R. Evangelista and A.A. Arroteia, Phys. Rev. E56, 4282 (1997).
[6] M. Sim~oes, A.J. Palangana and L.R. Evangelista, Phys. Rev. E56, 7326 (1997).
[7] I.C. Khoo and S.T. Wu,Optics and NonlinearOptics ofLiquidCrystals(World Scientic, Singapore, 1983).
[8] G. Koren, Phys. Rev. A13, 1177 (1976).
[9] I.C. Khoo, S.L. Zhuang and S. Shepard, Appl. Phys. Lett.39, 937 (1981)
[10] R. MacDonald and H.J. Eichler, Appl. Phys. B60, 543
(1995).
[11] Y.G. Fuh and R.F. Code, Can. J. Phys.63, 282 (1985)
[12] I.C. Khoo, Phys. Rev. A25, 1040 (1982).
[13] V. Volterra and E. Wiener-Avnear, Opt. Commun.12,
194 (1974)
[14] N.F. Pilipetski, A.V. Sukhov, N.V. Tabiryan, and B. Ya. Zel'dovich, Opt. Commun.37, 280 (1981).
[15] I. Janossy, Phys. Rev. E49, 2957 (1994).
[16] R. Muenster, M. Jarasch, X. Zhuang and Y.R. Shen, Phys. Rev. Lett.78, 42 (1996).
[17] A.C. Bento, A.J. Palangana, L.R. Evangelista, M.L. Baesso, J.R.D. Pereira, E.C. da Silva, A.M. Mansanares, Appl. Phys. Lett.68, 3371(1996).
[18] J.R.D. Pereira, Dissertac~ao de Mestrado,
IFGW-Unicamp, 1997.
[19] J.R.D. Pereira, A.M. Mansanares, A.J. Palangana, M.L. Baesso. Submitted to Mol. Cryst. Liq. Cryst. (1998).
[20] S.M. Shibili and L.L. Dantas, Appl. Phys. Lett.72, 674
(1998).
[21] J.R.D. Pereira, A.M. Mansanares, A.J. Palangana, M.L. Baesso in preparation.
[22] J.R.D. Pereira, A.M. Mansanares, A.J. Palangana, M.L. Baesso in preparation.
[23] F. Mercuri, U. Zammit and M. Marinelli, Phys. Rev. E57, 596 (1998).
[24] P.J. Coolings,LiquidCrystals: Nature'sDelicatePhase of Matter, (Princeton University Press, Princeton,
1991).
[25] T. Higaishi, T. Imasaka and N. Ishibashi, Ann. Chem.
55, 1907 (1983).
[26] F.J. Power and E.D. Salin, Ann. Chem.60, 838 (1988).
[27] R.D. Snook, R.D. Lowe and M.L. Baesso, Analyst,23
[28] M.L. Baesso, A.C. Bento, A.A. Andrade, J.A. Sam-paio, E. Pecoraro, L.A.O. Nunes, T. Catunda, and S. Gama, Phys. Rev. B57, 10545 (1998).
[29] J. Shen, M.L. Baesso and R.D. Snook, J. Appl. Phys.
75, 3738 (1994).
[30] M.L. Baesso, J. Shen and R.D. Snook, Chem. Phys. Lett.197, 255 (1992).
[31] M.L. Baesso, J. Shen and R.D. Snook. J. Appl. Phys.
75, 3732 (1994).
[32] J.P. Gordon, R.C.C. Leite, R.C. Morre, S.P.S. Porto and J.R. Whinnery, J. Appl. Phys.36, 3 (1965).
[33] J. Shen, R.D. Lowe and R.D. Snook, Chem. Phys.165,
385 (1992).
[34] J. Shen and R.D. Snook, J. Appl. Phys. 73, 5286
(1993).
[35] S.J. Sheldon, L.V. Knight and J.M. Thorne, Appl. Opt.
21, 1663 (1982).
[36] S. Wu and N.J. Dovichi, J. Appl. Phys.67, 1170 (1990).
[37] F.W. Dabby, R.W. Boyko, C. Shank and J.R. Whin-nery, IEEE J. Quantum Electron.QE-5, 516 (1969).
[38] H.S. Carslaw and J.C. Jaeger, Conduction of Heat in Solids, (Clarendon, Oxford, 2nd edition, 1959). [39] A.E. Sigmen, An Introduction to Lasers and Masers
(McGraw-Hill, New York, 2nd edition, 1971).
[40] A.K. Ghatak and K. Thyagarajan, Contemporay Op-tics, (Plenum, New York, 1978).
[41] N.W. McLachlan, Bessel Functions for Engineers, (Clarendon, Oxford, 2nd edition, 1961).
[42] R.C. Weast, Handbook of Chemistry and Physics
(CRC, Boca Roton, FL, 67th edition, 1986-1987). [43] A.J. Chapman,Heat Transfer(Macmillan, New York,
2nd edition, 1960).
[44] G. Vertogen and W.H. de Jeu, Thermotropic Liquid Crystals, (Verlag, Berlin, 1988).
[45] K.S. Chu and D.S. Moroi, J. Phys. Colloq. 36, C1-99
(1975).
[46] Y. Hendrix, J. Charvolin, M. Rawiso, L. Liebert and M. C. Holmes, J. Phys. Chem.87, 3991 (1983).
[47] A.V.A. Pinto and L.Q. Amaral, J. Phys. 94, 3186