ISSN 0104-6632 Printed in Brazil
Vol. 19, No. 02, pp. 255 - 266, April - June 2002
of Chemical
Engineering
THERMODYNAMIC MODELLING OF PHASE
EQUILIBRIUM FOR WATER + POLY(ETHYLENE
GLYCOL) + SALT AQUEOUS TWO-PHASE
SYSTEMS
R.A.G.Sé and M.Aznar
School of Chemical Engineering, State University of Campinas (FEQ/UNICAMP) P.O. Box 6066, CEP 13081-970, Campinas - SP, Brazil.
E-mail: [email protected]
(Received: May 12, 2001 ; Accepted: April 16, 2002 )
Abstract - The NRTL (nonrandom, two-liquid) model, expressed in mass fraction instead of mole fraction, was used to correlate liquid-liquid equilibria for aqueous two-phase polymer-salt solutions. New interaction energy parameters for this model were determined using reported data on the water + poly(ethylene glycol) + salt systems, with different molecular masses for PEG and the salts potassium phosphate, sodium sulfate, sodium carbonate and magnesium sulfate. The correlation of liquid-liquid equilibrium is quite satisfactory.
Keywords: aqueous two-phase systems, liquid-liquid equilibrium, polymers, salts, NRTL model.
INTRODUCTION
The importance of liquid-liquid extraction to biochemical engineering has been increasing as a result of the development of aqueous two-phase systems for purification and isolation of macromolecules, such as proteins or antibiotics. This process costs less than the traditional biomolecule separations due to use of traditional extraction equipment and the small number of stages. According to Kula (1990), aqueous two-phase systems are formed spontaneously when two hydrophilic components are mixed in a solution and a specific concentration is exceeded. Aqueous two-phase systems consist in two polymers [e.g., poly(ethylene glycol) and dextran] or one polymer and one lyotropic salt [poly(ethylene glycol) and phosphates, citrates or sulfates] in water. It is possible to have an extremely selective separation of substances using aqueous two-phase systems; they
glycol) + salt systems, with different molecular masses for PEG and the salts potassium phosphate, sodium sulfate, sodium carbonate and magnesium sulfate
THERMODYNAMIC MODEL
There are several models for calculation of activity coefficients. Some, such as those by Margules and Van Laar, are empirical; others, such as Wilson (1964) and NRTL (Renon and Prausnitz, 1968), use the local composition concept; still others, such as UNIQUAC (Abrams and Prausnitz, 1976), have a more theoretical basis; and finally, some, such as ASOG (Derr and Deal, 1969; Kojima and Tochigi, 1979) and UNIFAC (Fredenslund et al., 1975, 1977), use the group contribution method.
The concept of local composition basically establishes that the composition of the system in the neighborhood of a given molecule is not the same as the bulk composition, because of intermolecular forces.
The NRTL (nonrandom, two-liquid) model it is based on the local composition, and it is applicable to partially miscible systems. Mole fractions have been traditionally used in this model, but they are not suitable for polymeric systems because the mole fraction of a polymer, due its large molecular mass, is an extremely small quantity. Instead, mass fraction can be used, as originally proposed by Oishi and Prausnitz (1978), for calculation of the activity coefficient of a solvent in polymeric solutions with the UNIQUAC and the UNIFAC methods. Stragevitch (1997), Velezmoro-Sánchez (1999), Batista et al. (1999), Lintomen (1999) and Lintomen et al. (2000) used this approach with the NRTL model. When mass fractions are used, the model is
ji ji j
j j
i
ji j
j j
kj kj k
j ji k k
ij
kj k kj k
j j
k k k k
G w M ln G w M G w
w G M
G w G w
M
M M
τ
γ = +
τ
+ τ −
∑
∑
∑
∑
∑
∑
(1)T
T
A
A
0ij 1ij ij+
=
τ
(2)(
ij ij)
ijexp
G
=
−
α
τ
(3)where
A
0ij andA
1ij are characteristic parametersof the energy of the i-j interactions, and parameter
ij
α
is related to the nonrandomness of the mixture.This means that the components are distributed in a pattern dictated by the local composition. When the number of points is small or the data are all at the same temperature, there is not enough information and eqn. (2) must be reduced to its original form (Renon and Prausnitz, 1968):
T
A
0ij ij=
τ
(4)When ionic species are present, the use of a long-range interaction term, such as Debye-Hückel (1923) or Pitzer-Debye-Hückel (Pitzer, 1980) is common; however, in previous works (Santos et al., 2000; Santos et al., 2001) we were able to represent the phase behavior of electrolyte systems with the NRTL model without this long-range term. The same approach is used in this work.
PARAMETER ESTIMATION
The experimental liquid-liquid equilibrium data at several temperatures, reported by Duarte et al. (2000) for the water + PEG 4000 + potassium phosphate system; Snyder et al. (1992) for the water + PEG 1000 + magnesium sulfate, water + PEG 3350 + magnesium sulfate, water + PEG 8000 + sodium sulfate, water + PEG 1000 + potassium phosphate and water + PEG 8000 + potassium phosphate systems; and Voros et al. (1993) for the water + PEG 2000 + sodium carbonate system were used to estimate the molecular interaction and nonrandomness parameters of the NRTL model.
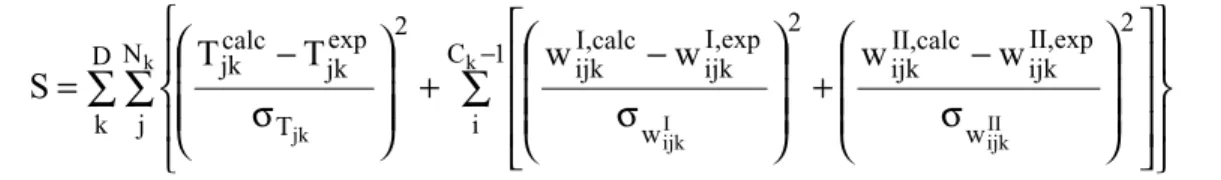
∑ ∑
∑
σ
−
+
σ
−
+
σ
−
=
D −k N j 1 C i 2 w exp , II ijk calc , II ijk 2 w exp , I ijk calc , I ijk 2 T exp jk calc jk k k II ijk I ijk jk
w
w
w
w
T
T
S
(5)Here, D is the number of data sets, Nk and Ck are
the number of data points and components in data set
k and σTjk (set equal to 0.1 K) is the standard
deviation for temperature, while σwIijk and σwIIijk (set
equal to 0.0005) are the standard deviations for the composition of both liquid phases at equilibrium.
With the molecular energy interaction parameters estimated by this procedure, liquid-liquid equilibrium correlations can be made. Comparisons between experimental and calculated data can be made through mean deviations between the experimental and the calculated composition of each component in both two phases. These mean deviations are given by
(
) (
)
k k N n C i 2 II calc II exp 2 I calc I exp C N 2 w w w w 100 w k k∑ ∑
− + − = ∆ (6)RESULTS AND DISCUSSION
With the procedure above, molecular interaction
energy parameters were obtained, as shown in Table 1, fitting the experimental liquid-liquid equilibrium data at several temperatures, reported by Duarte et al. (2000) for the water + PEG 4000 + potassium phosphate system; Snyder et al. (1992) for the water + PEG 1000 + magnesium sulfate, water + PEG 3350 + magnesium sulfate, water + PEG 8000 + sodium sulfate, water + PEG 1000 + potassium phosphate and water + PEG 8000 + potassium phosphate systems; and Voros et al. (1993) for the water + PEG 2000 + sodium carbonate system.
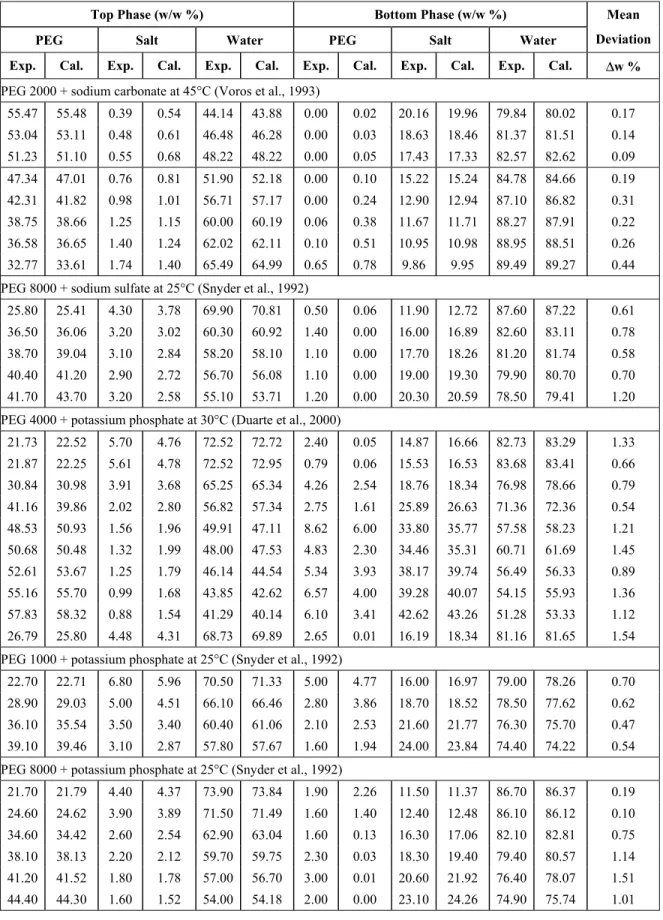
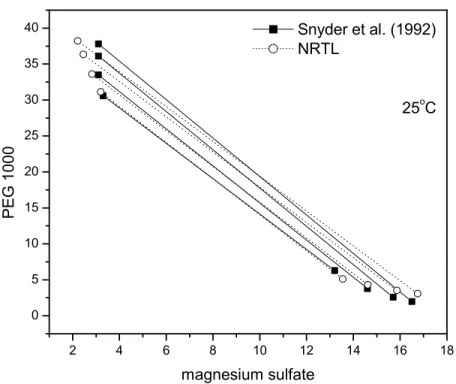
With these estimated parameters, the experimental data of Duarte et al. (2000), Snyder et al. (1992) and Voros et al. (1993) were correlated. A comparison between the experimental and calculated data is shown numerically in Table 2 and graphically in Figures 1-10.
It can be seen that the representation of liquid-liquid equilibrium for the systems studied is quite good. The NRTL model is able to predict the phase split over the entire range of compositions analyzed. The mean deviations appear in Table 2 and are always below 2.00%.
Table 1: Molecular interaction and nonrandomness parameters
i/j A0ij A0ji A1ij A1ji αij
PEG 1000-MgSO4 1165.7 5999.9 4.7740 74.1322 0.45692
PEG 1000-Water -1464.5 -5999.9 30.267 -14.993 0.46821
MgSO4-Water -1766.2 3058.1 -8.4499 2.8745 0.20002
PEG 2000-Na2CO3 2353.7 4774.6 6.2540 -1.1322 0.49763
PEG 2000-Water -2651.1 3634.7 11.223 7.3008 0.35819
Na2CO3-Water -2467.1 2618.5 -6.4479 -26.135 0.13863
PEG 8000-Na2SO4 4502.7 -2701.3 0.0 0.0 0.44788
PEG 8000-Water -4877.6 2361.0 0.0 0.0 0.20000
Na2SO4-Water -2067.8 3452.0 0.0 0.0 0.20435
PEG 4000-Na2SO4 5946.5 975.64 0.0 0.0 0.43710
PEG 4000-Water -3001.2 5527.8 0.0 0.0 0.20002
PEG 4000-K2HPO4 1723.9 -3074.7 0.0 0.0 0.31263
K2HPO4-Water -944.31 1194.7 0.0 0.0 0.46999
PEG 1000-K2HPO4 657.61 4335.7 0.0 0.0 0.20000
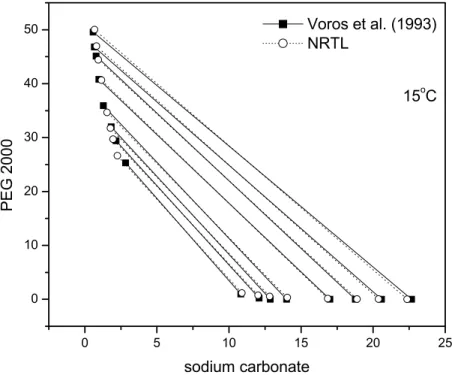
Table 2: Experimental and calculated LLE data on PEG + Salt + Water Systems
Top Phase (w/w %) Bottom Phase (w/w %)
PEG Salt Water PEG Salt Water
Mean
Deviation
Exp. Cal. Exp. Cal. Exp. Cal. Exp. Cal. Exp. Cal. Exp. Cal. ∆w %
PEG 1000 + magnesium sulfate at 25°C (Snyder et al., 1992)
30.60 31.15 3.30 3.20 66.10 65.65 6.30 5.13 13.20 13.54 80.50 81.33 0.67
33.50 33.61 3.10 2.83 63.40 63.56 3.80 4.31 14.60 14.62 81.60 81.07 0.33
36.10 36.34 3.10 2.46 60.80 61.20 2.60 3.54 15.70 15.86 81.70 80.60 0.68
37.80 38.23 3.10 2.22 59.10 59.55 2.00 3.09 16.50 16.75 81.50 80.16 0.83
PEG 3350 + magnesium sulfate at 25°C (Snyder et al., 1992)
25.40 25.03 3.10 3.19 71.50 71.78 4.80 4.33 12.20 12.49 83.00 83.18 0.31
29.20 29.39 2.60 2.87 68.20 67.74 4.50 4.54 13.90 13.54 81.60 81.92 0.30
32.80 32.52 2.50 2.67 64.70 64.81 5.10 4.76 14.20 14.29 80.70 80.95 0.23
34.40 34.52 2.40 2.56 63.20 62.92 4.40 4.92 15.20 14.78 80.40 80.30 0.31
PEG 2000 + sodium carbonate at 15°C (Voros et al., 1993)
49.58 50.04 0.57 0.68 49.85 49.28 0.00 0.01 22.66 22.35 77.34 77.64 0.35
46.82 46.96 0.67 0.81 52.51 52.23 0.00 0.03 20.58 20.37 79.42 79.60 0.18
45.13 44.43 0.78 0.94 54.09 54.63 0.00 0.05 18.77 18.88 81.23 81.07 0.38
40.79 40.65 0.98 1.15 58.23 58.20 0.00 0.11 17.00 16.85 83.00 83.04 0.12
35.92 34.69 1.28 1.55 62.80 63.76 0.00 0.33 13.99 14.05 86.01 85.62 0.68
32.01 31.74 1.83 1.78 66.16 66.48 0.00 0.54 12.87 12.82 87.13 86.64 0.34
29.42 29.69 2.17 1.96 68.41 68.35 0.21 0.74 12.09 12.02 87.70 87.24 0.32
25.32 26.63 2.83 2.26 71.85 71.11 0.99 1.15 10.82 10.89 88.19 87.96 0.67
PEG 2000 + sodium carbonate at 25°C (Voros et al., 1993)
51.15 51.14 0.49 0.70 48.36 48.16 0.00 0.01 21.55 21.34 78.45 78.65 0.17
48.62 48.54 0.65 0.80 50.73 50.66 0.00 0.03 19.86 19.73 80.14 80.24 0.10
46.57 46.46 0.71 0.89 52.72 52.65 0.00 0.04 18.69 18.53 81.31 81.43 0.12
42.74 42.17 0.93 1.10 56.33 56.73 0.00 0.10 16.28 16.28 83.72 83.62 0.30
37.80 38.10 1.41 1.32 60.79 60.58 0.00 0.21 14.48 14.39 85.52 85.40 0.18
33.77 33.32 1.63 1.63 64.60 65.05 0.00 0.47 12.43 12.42 87.57 87.11 0.37
31.51 31.47 1.96 1.77 66.53 66.76 0.17 0.62 11.66 11.72 88.17 87.66 0.31
27.19 28.09 2.50 2.04 70.31 69.87 0.89 1.00 10.38 10.52 88.73 88.48 0.47
PEG 2000 + sodium carbonate at 35°C (Voros et al., 1993)
53.63 53.66 0.44 0.59 45.93 45.75 0.00 0.02 20.83 20.67 79.17 79.31 0.13
50.67 50.70 0.54 0.69 48.79 48.61 0.00 0.03 19.04 18.87 80.96 81.10 0.13
48.89 48.93 0.60 0.75 50.51 50.32 0.00 0.05 18.05 17.87 81.95 82.08 0.14
44.87 44.56 0.83 0.93 54.30 54.51 0.00 0.11 15.66 15.63 84.34 84.26 0.17
40.20 39.70 1.09 1.16 58.71 59.14 0.00 0.26 13.45 13.46 86.55 86.28 0.31
36.39 35.96 1.39 1.36 62.22 62.68 0.10 0.47 11.93 11.98 87.97 87.55 0.34
33.87 33.99 1.67 1.48 64.60 64.53 0.18 0.62 11.23 11.26 88.59 88.12 0.28
Table 2 continuation
Top Phase (w/w %) Bottom Phase (w/w %)
PEG Salt Water PEG Salt Water
Mean
Deviation
Exp. Cal. Exp. Cal. Exp. Cal. Exp. Cal. Exp. Cal. Exp. Cal. ∆w %
PEG 2000 + sodium carbonate at 45°C (Voros et al., 1993)
55.47 55.48 0.39 0.54 44.14 43.88 0.00 0.02 20.16 19.96 79.84 80.02 0.17
53.04 53.11 0.48 0.61 46.48 46.28 0.00 0.03 18.63 18.46 81.37 81.51 0.14
51.23 51.10 0.55 0.68 48.22 48.22 0.00 0.05 17.43 17.33 82.57 82.62 0.09
47.34 47.01 0.76 0.81 51.90 52.18 0.00 0.10 15.22 15.24 84.78 84.66 0.19
42.31 41.82 0.98 1.01 56.71 57.17 0.00 0.24 12.90 12.94 87.10 86.82 0.31
38.75 38.66 1.25 1.15 60.00 60.19 0.06 0.38 11.67 11.71 88.27 87.91 0.22
36.58 36.65 1.40 1.24 62.02 62.11 0.10 0.51 10.95 10.98 88.95 88.51 0.26
32.77 33.61 1.74 1.40 65.49 64.99 0.65 0.78 9.86 9.95 89.49 89.27 0.44
PEG 8000 + sodium sulfate at 25°C (Snyder et al., 1992)
25.80 25.41 4.30 3.78 69.90 70.81 0.50 0.06 11.90 12.72 87.60 87.22 0.61
36.50 36.06 3.20 3.02 60.30 60.92 1.40 0.00 16.00 16.89 82.60 83.11 0.78
38.70 39.04 3.10 2.84 58.20 58.10 1.10 0.00 17.70 18.26 81.20 81.74 0.58
40.40 41.20 2.90 2.72 56.70 56.08 1.10 0.00 19.00 19.30 79.90 80.70 0.70
41.70 43.70 3.20 2.58 55.10 53.71 1.20 0.00 20.30 20.59 78.50 79.41 1.20
PEG 4000 + potassium phosphate at 30°C (Duarte et al., 2000)
21.73 22.52 5.70 4.76 72.52 72.72 2.40 0.05 14.87 16.66 82.73 83.29 1.33
21.87 22.25 5.61 4.78 72.52 72.95 0.79 0.06 15.53 16.53 83.68 83.41 0.66
30.84 30.98 3.91 3.68 65.25 65.34 4.26 2.54 18.76 18.34 76.98 78.66 0.79
41.16 39.86 2.02 2.80 56.82 57.34 2.75 1.61 25.89 26.63 71.36 72.36 0.54
48.53 50.93 1.56 1.96 49.91 47.11 8.62 6.00 33.80 35.77 57.58 58.23 1.21
50.68 50.48 1.32 1.99 48.00 47.53 4.83 2.30 34.46 35.31 60.71 61.69 1.45
52.61 53.67 1.25 1.79 46.14 44.54 5.34 3.93 38.17 39.74 56.49 56.33 0.89
55.16 55.70 0.99 1.68 43.85 42.62 6.57 4.00 39.28 40.07 54.15 55.93 1.36
57.83 58.32 0.88 1.54 41.29 40.14 6.10 3.41 42.62 43.26 51.28 53.33 1.12
26.79 25.80 4.48 4.31 68.73 69.89 2.65 0.01 16.19 18.34 81.16 81.65 1.54
PEG 1000 + potassium phosphate at 25°C (Snyder et al., 1992)
22.70 22.71 6.80 5.96 70.50 71.33 5.00 4.77 16.00 16.97 79.00 78.26 0.70
28.90 29.03 5.00 4.51 66.10 66.46 2.80 3.86 18.70 18.52 78.50 77.62 0.62
36.10 35.54 3.50 3.40 60.40 61.06 2.10 2.53 21.60 21.77 76.30 75.70 0.47
39.10 39.46 3.10 2.87 57.80 57.67 1.60 1.94 24.00 23.84 74.40 74.22 0.54
PEG 8000 + potassium phosphate at 25°C (Snyder et al., 1992)
21.70 21.79 4.40 4.37 73.90 73.84 1.90 2.26 11.50 11.37 86.70 86.37 0.19
24.60 24.62 3.90 3.89 71.50 71.49 1.60 1.40 12.40 12.48 86.10 86.12 0.10
34.60 34.42 2.60 2.54 62.90 63.04 1.60 0.13 16.30 17.06 82.10 82.81 0.75
38.10 38.13 2.20 2.12 59.70 59.75 2.30 0.03 18.30 19.40 79.40 80.57 1.14
41.20 41.52 1.80 1.78 57.00 56.70 3.00 0.01 20.60 21.92 76.40 78.07 1.51
2 4 6 8 10 12 14 16 18 0
5 10 15 20 25 30 35 40
25oC
PE
G
1000
magnesium sulfate
Snyder et al. (1992) NRTL
Figure 1: Experimental and calculated LLE data on water + PEG 1000 + MgSO4 at 25°C
2 4 6 8 10 12 14 16
0 5 10 15 20 25 30 35
25oC
P
E
G
3
350
magnesium sulfate
Snyder et al. (1992) NRTL
0 5 10 15 20 25 0
10 20 30 40 50
15oC
P
E
G
2
000
sodium carbonate
Voros et al. (1993) NRTL
Figure 3: Experimental and calculated LLE data on water + PEG 2000 + Na2CO3 at 15°C
0 5 10 15 20 25
0 10 20 30 40 50 60
25oC
P
E
G
2
000
sodium carbonate
Voros et al. (1993) NRTL
0 5 10 15 20 0
10 20 30 40 50 60
35oC
P
E
G
2
000
sodium carbonate
Voros et al. (1993) NRTL
Figure 5: Experimental and calculated LLE data on water + PEG 2000 + Na2CO3 at 35°C
0 5 10 15 20
0 10 20 30 40 50 60
45oC
P
E
G
2
000
sodium carbonate
Voros et al. (1993) NRTL
2 4 6 8 10 12 14 16 18 20 22 0
10 20 30 40 50
25oC
P
E
G
8
000
sodium sulfate
Snyder et al. (1992) NRTL
Figure 7: Experimental and calculated LLE data on water + PEG8000 + Na2SO4 at 25°C
0 10 20 30 40 50
0 10 20 30 40 50 60
30oC
P
E
G
4
000
potassium phosphate
Duarte et al. (2000) NRTL
0 5 10 15 20 25 0
5 10 15 20 25 30 35 40
25oC
P
E
G
1
000
potassium phosphate
Snyder et al. (1992) NRTL
Figure 9: Experimental and calculated LLE data on water + PEG1000 + K2HPO4 at 25°C
0 5 10 15 20 25
0 10 20 30 40 50
25oC
P
E
G
8
000
potassium phosphate
Snyder et al. (1992) NRTL
CONCLUSION
Experimental liquid-liquid equilibrium data on water + PEG 4000 + potassium phosphate, water + PEG 1000 + potassium phosphate, water + PEG 8000 + potassium phosphate, water + PEG 1000 + magnesium sulfate, water + PEG 3350 + magnesium sulfate, water + PEG 8000 + sodium sulfate and water + PEG 2000 + sodium carbonate aqueous two-phase systems were used to estimate the molecular interaction and nonrandomness parameters of the NRTL model for the activity coefficient. With these new parameters, the experimental data were correlated. The results are very satisfactory, with an overall mean deviation of 0.60%.
ACKNOWLEDGMENTS
The financial aid received from FAPESP (Fundação de Amparo à Pesquisa do Estado de São Paulo, Brazil) and PIBIC/CNPq (Conselho Nacional de Desenvolvimento Científico e Tecnológico, Brazil) is gratefully acknowledged.
NOMENCLATURE
A0ij, A1ij molecular interaction parameters in the
NRTL model for the i-j pair
Ck number of components in data set k
D number of data sets
Gij energy interaction parameters in the
Boltzmann form in the NRTL model for the i-j pair
Mk molecular mass of compound k
Nk number of data points in data set k
S objective function to be minimized
T absolute temperature
wk mass fraction of compound k
Greek Letters:
αij molecular nonrandomness parameter in
the NRTL model
γi activity coefficient of compound i
σ standard deviation for an independent
variable, temperature or composition
τij energy parameters in the NRTL model
exp experimental
calc calculated
I, II liquid phases at equilibrium
REFERENCES
Abrams, D.S. and Prausnitz, J.M., Statistical Thermodynamics of Liquid Mixtures: A New Expression for the Excess Gibbs Energy of Partly
or Completely Miscible Systems, AIChE J., 21,
116-128 (1975).
Albertsson, P.A., Partition of Cell Particles and
Macromolecules, 3rd ed., Interscience, New York
(1986).
Anderson, T.F., Abrams, D.S. and Grens II, E.A., Evaluation of Parameters for Nonlinear Thermodynamic Models, AIChE J., 24, 20-29 (1978).
Batista, E., Monnerat, S., Kato, K., Stragevitch, L. and Meirelles, A.J.A., Liquid-Liquid Equilibrium for Systems of Canola Oil, Oleic Acid and Short-Chain Alcohols, J. Chem. Eng. Data, 44, 1360-1364 (1999).
Debye, P. and Hückel, E., Zur Theorie der Elektrolyte, Phys. Z., 24, 185-206 (1923).
Derr, E.L. and Deal, C.H., Analytical Solution of Groups: Correlation of Activity Coefficients Through Structural Group Parameters, Inst. Chem. Eng. Symp. Ser., 32, 44-51 (1969).
Duarte, C.S.A., Grossi, F.R., Franco, T.T. and Aznar, M., Liquid-Liquid Equilibrium in Polymer-Salt Aqueous Two-Phase Systems. XIII Brazilian Congress of Chemical Engineering, 280, Águas de São Pedro (2000).
Franco, T.T., Andrews, T.A. and Asenjo, J.A., Use of Chemically Modified Proteins to Study the Effect of a Single Protein Characteristic in Aqueous Two-Phase Systems. Effect of Surface Charge, Biotech. Bioeng., 49, 300-308 (1996). Fredenslund, Aa., Jones, R.L. and Prausnitz, J.M.,
Group Contribution Estimation of Activity Coefficients in Nonideal Solutions, AIChE J., 21, 1086-1099 (1975).
Fredenslund, Aa., Gmehling, J. and Rasmussen, P., Vapor-Liquid Equilibria using UNIFAC, Elsevier, Amsterdam (1977).
Kojima, K. and Tochigi, K., Prediction of Vapor-Liquid Equilibria by the ASOG Method, Elsevier/Kodansha, Tokyo (1979).
Lintomen, L., Evaluation of the Liquid-Liquid Extraction Process for Recovery and Purification of Citric Acid (in Portuguese), M.Sc. Thesis, FEQ/UNICAMP, Campinas (1999).
Lintomen, L., Pinto, R.T.P., Batista, E., Meirelles, A.J.A. and Wolf-Maciel, M.R., Liquid-Liquid Equilibrium of the Water + Citric Acid + 2-Butanol + Sodium Chloride Systems, J. Chem. Eng. Data, 45, 1211-1214 (2000).
Nelder, J.A. and Mead, R., A Simplex Method for Function Minimization, Computer J., 7, 308-313 (1965).
Niesen, V.G. and Yesavage, V.F., Application of a Maximum Likelihood Method Using Implicit Constraints to Determine Equation of State Parameters from Binary Phase Behavior Data, Fluid Phase Equilibria, 50, 249-266 (1989). Oishi, T. and Prausnitz, J.M., Estimation of Solvent
Activities in Polymer Solutions Using a Group Contribution Methodology, Ind. Eng. Chemical Process Des. Dev., 17, 333-339 (1978).
Pitzer, K., Electrolytes. From Dilute Solutions to Fused Salts, J. Am. Chem. Soc., 102, 2902-2906 (1980).
Renon, H. and Prausnitz, J.M., Local Compositions in Thermodynamic Excess Functions for Liquid Mixtures, AIChE J., 14, 135-144 (1968).
Santos, G.R., d’Ávila, S.G. and Aznar, M., Salt Effect of KBr on the Liquid-Liquid Equilibrium
of the Water/Ethanol/1-Pentanol System, Braz. J. Chem. Eng., 17, 721-734 (2000).
Santos, F.S., d’Ávila, S.G. and Aznar, M., Salt Effect on Liquid-Liquid Equilibrium of Water + 1-Butanol + Acetone System: Experimental Determination and Thermodynamic Modelling, Fluid Phase Equil., 187/188, 265-274 (2001). Snyder, S.M., Cole, K.D. and Szlag, D.C., Phase
Compositions, Viscosities and Densities of Aqueous Two-Phase Systems Composed of
Polyethylene Glycol and Various Salts at 25°C, J.
Chem. Eng. Data, 37, 268-274 (1992).
Stragevitch, L., Liquid-Liquid Equilibrium in Nonelectrolyte Mixtures (in Portuguese), D.Sc. diss., FEQ/UNICAMP, Campinas (1997).
Stragevitch, L. and d’Ávila, S.G., Application of a Generalized Maximum Likelihood Method in the Reduction of Multicomponent Phase Equilibrium Data, Braz. J. Chem. Eng., 14, 41-52 (1997). Velezmoro-Sanchez, C.E., Modelling and Prediction
of Water Activity in Food Fluids (in Portuguese), D.Sc. diss., FEA/UNICAMP, Campinas (1999). Voros, N., Proust, P. and Fredenslund, Aa.,
Liquid-Liquid Phase Equilibria of Aqueous Two-Phase Systems Containing Salts and Polyethylene Glycol, Fluid Phase Equilibria, 90, 333-353 (1993).