Assessing the crashworthiness of a vehicle seat for rear and frontal
impacts
Rita de Cássia Silvaa*
Paulo Guilherme Marques Flávioa
Alessandro B. de Sousa Oliveirab
a Programa de Pós-graduação em Sistemas Mecatrônicos, Universidade de Brasília. E-mail: [email protected], [email protected]
b Engenharia Automotiva, Faculdade UnB Gama, Universidade de Brasília. E-mail: [email protected]
*Corresponding author
http://dx.doi.org/10.1590/1679-78255262
Abstract
A vehicle seat represents an automotive passive system because it limits the damage caused to passengers in the events of an accident or a crash. This way, the present work intends to evaluate the safety of an anchorage mechanism of a frontal vehicle driver seat considering two hazardous situations rear and frontal impacts. Performing a nonlinear FE in static and transient analyses provide the stress distribution in the main components of the mechanism, such as the inner track, the lock device and the bolts using Ansys®. Regulation Nº 17 from Un/ECE regulates the acceleration levels predicted in a crash test and therefore applied in the simulation. In addition, departing from a crash of 5g a fatigue analysis is carried out. From this particular analysis, it becomes possible to evaluate the actual safety of the vehicle seat after a minor crash.
Keywords
Vehicle safety, anchorage system, vehicle seat.
1 INTRODUCTION
The main objective of vehicle safety is to minimize the occurrence and consequences of traffic accidents. One of the actions that ensure the occupant safety in passenger vehicles is the regulations implemented by some government agencies such as NHSTA (National Highway Traffic Safety Administration) and UN/ECE (Economic Commission for Europe of the United Nations). Another issue refers to the vehicle safety features as seat belts and frontal/lateral airbags called passive safety features, which are essential to avoid or to reduce serious and fatal injuries. Passive safety features are systems that act when hazardous events occur while an active system works to prevent the risk of an accident.
According to the Economic Commission for Europe (2014b) from UN/ECE 17 seat is “a structure which may or may not be integral with the vehicle structure complete with trim, intended to seat one person...” Besides, the term anchorage applied to vehicle seats means: “the system by which the seat assembly is secured to the vehicle structure, including the affected parts of the vehicle structure.”
Also, from Economic Commission for Europe (2012) seat anchorages are treated, but restricted to the description of the restraint system, which requires the drawings showing the sites of the seat anchorages, the materials used and the technical description. At this regulation’s paragraph, there is a concern regarding the seat anchorage, but not sufficiently clear pointing out the requirements that should be verified or complied.
collisions with minor or major hazardous. In fact, the seat and its anchorage system must support any forces caused by the car driving without putting in danger the integrity and the lives of its occupants.
The Addendum 16: Regulation Nº 17 (Economic Commission for Europe, 2014b) from UN/ECE prescribes for the anchorage system that “no failure shall be shown in the seat frame or in the seat anchorage, …. or in their locking devices
during or after tests prescribed in the regulation”.
These recommendations highlight the regulation’s concern to keep the anchorage mechanism to a certain degree of integrity even after severe requests. It seems of great interest safety evaluation specifically related to this mechanism. Some researches related to vehicle seat emphasize the importance of vehicle seat conceptual design in vehicle design. Nowadays, a convenient vehicle seat has to provide customer needs and fit in new technologies as discussed in Haan (2002) and in Wirotrattanaphaphisan (2007). From those works, the emphasis is the passenger comfort, even though both of them mention safety as one of the requirements for an adequate seat design.
Thiyagarajan (2008) in his work aims to optimize the design of a backrest and a headrest of a nonspecific vehicle seat reducing the weight. For this, considering a nonlinear numerical model developed in a finite element commercial software and the regulation Nº 17 from UN/ECE, it was noticed a large safety margin using linear and non-linear analyses. According to the results, the change in the sheet metal thickness led to a final design that had a total mass reduction of 15.2%. Safety was not neglected in the optimization process, the expectation is the seat backrest and headrest be able to avoid severe injuries in case of collisions.
Chen et al (2014) developed a similar work based on numerical results. Authors identified that the seat structure of a common vehicle must be improved, because during a frontal crash its passenger could experience an amount of compression in chest, which could provoke serious injuries.
Kang and Chun (2000) presented a cost-effective analysis of a seat system in case of frontal collision. They proposed a self-developed experimental procedure on which the strength of each component of the seat was evaluated ensuring the safety of the occupants.
The experiments were carried out considering three different loads (shoulder and lap belt load; lap load and 40° slant load) and three different seats’ construction as Type A (fully assembled seat); B (seat without the back part) and only the inner track. Focusing in the inner track under frontal impact, authors considered the load provoked by the seat belt anchorage at this situation and they found that the collapse load was affected by a twisting and bending deformation at its section.
According to the authors, this cost-effective approach allows analysing a seat structure during the development stage, without burdening the process and providing a good methodology for designing lightweight and strength seat structures.
Two important aspects of safety involving seat structures during rear impacts were treated in Saczalski et al. (2014) and Singh and Shaikh (2014). The first one evaluated the design and reliability of child restraint protection carrying out a series of multi-variable rear impact crashes. During these tests, the authors observed a specific set of variables among them the front seat inertial resistance, because a lack of this resistance could affect the child safety just behind the front seat. According to the study, some children suffered a fatal or severe injuries caused by the fail of seat adjusters, which allowed the seat moves backward invading the child space.
Singh and Shaikh (2014) studied the damage that the displacement of luggage could provoke at the seat structure, when the vehicle undergoes a rear impact. In these cases, indirectly the occupant could suffer severe injuries, because luggage causes undesirable forces, displacement and strain. At this situation, the backrest is one of the seat components that must withstand the first impact and reduce the risk of severe injuries for the occupants.
Fulmali et al. (2015) carried out a numerical analysis considering static, vibration and impact loading using a finite element commercial package of a seat L-joints from buses passenger seats. The analyses of the component allowed design changes reducing the stresses and consequently, increasing the life cycle of the component.
From the works presented above, independently of the vehicle type, a mandatory topic is the safety of the vehicle occupant in the manner of not risking his physical integrity or life. Besides, when safety is associated to the vehicle seat many mechanical components and mechanisms could cause the failure of the structure, such as backrests, headrests, adjustment devices and the anchorage mechanism.
In the present work, the safety assessment is restricted to the seat anchorage that consists of the lock device, inner track and the bolts. In addition, the anchorage mechanism belongs to a vehicle classified in category M, which is a “power-driven vehicle having at least four wheels and used for the carriage of passengers“, according to ECE 78 (Economic Commission for Europe, 2014a).
system of a seat from an ordinary vehicle, using a commercial finite element package Ansys®. The rear and frontal impacts are the harmful situations treated in the study and the prescription of the addendum 16: Regulation Nº 17 (Economic Commission for Europe, 2014b) from UN/ECE is applied.
In addition, a fatigue analysis completes the assessment of the vehicle seat as intended in this work. Hence, it is assumed that the vehicle undergoes a deceleration of 5g. Such value corresponds to common accidents of minor gravity in the real world as shown in Meyer (2016).
His work is in accordance with the National Automotive Sampling System (NASS) database retrieved from 2003-2014. This database refers to real world accidents covering two situations: intrusion or not of the vehicle body. From the statistics, the acceleration range for cases with intrusion was 1.25g to 38.36g and for those without intrusion the range is 0.01 to 38.36g. In truth, considering the deceleration range within 5g to 20g about 270 cases have been sampled. Concerning the Meyer (2016), the present work adopts a deceleration about 5g to the fatigue life analysis as a vehicle collision of minor effect.
2 ASSESSING THE ANCHORAGE MECHANISM OF A VEHICLE SEAT
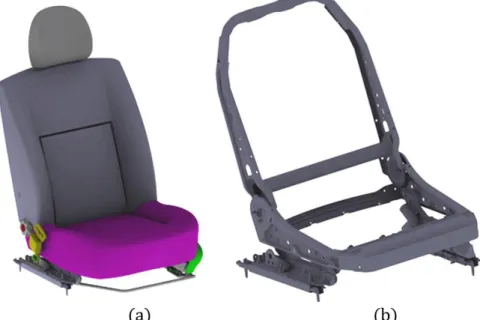
This section describes the method to assess the safety of anchorage mechanism of a seat vehicle under frontal and rear impacts. The evaluation comprises quasi-static and transient analyses and both consider the non-linearity related to the material, large deflection and contact. According to the vehicle classification (section 1), the seat model refer to a regular four doors vehicle, as shown in Fig. 1 (a) and (b).
At Fig. 1 (b), it could be seen that some components were removed as the headrest and all the seat foam. Such a procedure requires that these components be considered as distributed mass, preserving the inertial effects, in the finite element analysis and that they keep contact with the same components. Figure 2 shows the anchorage mechanism including the lock device, inner track and the bolts.
The finite element model is developed and the simulation analysis is carried out according to the provisions of the Economic Commission for Europe (2014b), which provides that: ‘the seat to be tested shall be mounted on the vehicle body for which it is designed’and ‘a longitudinal horizontal acceleration of not less than 20g shall be applied for 30
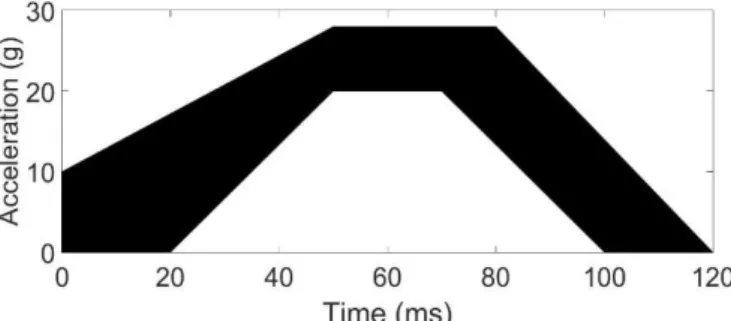
milliseconds’. About the first requirement, contacts and restrictions in the finite element model have been established to consistently reproduce the kinematics of the vehicle seat relative to its floor (vehicle structure is not considered), as discussed in section 2.1.2. For the second standard requirement, the seat undergoes a minimum acceleration of 20 g during 30ms as prescribed. Frontal and rear impacts will be verified. Figure 3 illustrates the standard corridor of acceleration relative to this situation.
Figure 3: Acceleration corridor established by the Regulation 17 and applied in the present work.
When a vehicle travels, the uneven road surface produces a random dynamic load under the vehicle suspension, which in a minor or major degree is transmitted to the vehicle cabin producing random loads at the vehicle seat, even considering an impact event. In addition, it decelerates during the motion while still generating great loads in the vehicle seat. To reproduce these complex combinations of loads is a difficult task, and then the regulation’s provisions seem to include a range of actual conditions into an equivalent load. Besides, Brazilian regulation is very similar to the European. A complementary study is carried out considering a fatigue life analysis of the anchorage mechanism after a rear impact at acceleration level less than the minimum value established in the regulation, as will be discussed in section 3.3. At this situation, residual stresses from this previous hazardous event are taken into account and included in the fatigue life cycle. In fact, after a collision, not all components are replaced and the vehicle seat could be one of them. However, as previously discussed the seat goes through all the loads submitted to the vehicle.
2.1 Considerations about the finite element model
Finite element method (FEM) represents a numerical solution applied to solve many field problems. In reality, many engineering phenomena can be expressed by governing equations and boundary conditions. It includes structural problems that could be linear (elastic) and nonlinear (inelastic) and also, impact problems.
According to Cook (1989) nonlinearity in structures refers to material (plasticity) or as geometric nonlinearities. To complete this definition the status of contact in a mechanical structure could be also a source of nonlinearity and it could be provoked by the material nonlinearity.
As mentioned in section 1, certain components were removed from the original model of the seat vehicle so that simplify the model for FEM analysis. Such procedure contemplates an important technical point that is keeping the inertial forces.
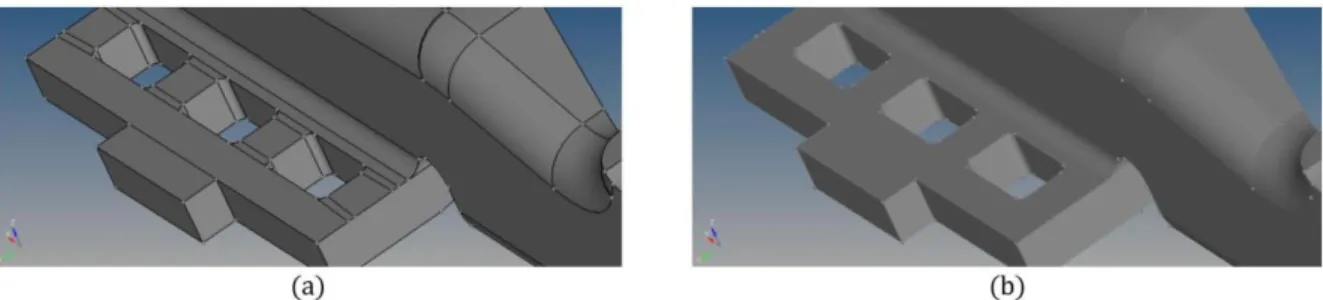
In addition, the CAD model has undergone some repairs avoiding surface overlapping that could take place in geometric transition regions; merging two or more neighboring faces into a single new face; removing small and sliver faces and short edges; eliminate penetrations that could happen between components and making suitable divisions, in order to support the creation of structured meshes. Figure 4 shows some of these repairs.
Figure 4: Part of the lock device treated for meshing: a) before; b) after geometry repairs
The commercial finite element package Hypermesh® was applied to mesh the vehicle seat components and bi and tridimensional elements were used. The two-dimensional element is a triangular six-nodes element each one with six DoFs. It is suitable for linear and nonlinear analyses. The three-dimensional element is tetrahedral ten-nodes element each one with three DoFs. It is appropriated to carry out an analysis, which it could happen material plasticity and large deflection (large strain and deformation).
The geometry to be meshed presents some complexity combining parts of simple shapes and having reentrant edges, especially the lock device, Fig. 2 (a). On these terms, it is expected that the mesh must fit in to the geometry and the elements have optimal size and shape (Bathe, 1982). The use of a structured mesh aims to reduce discontinuities in the displacement gradients and the mesh quality criteria denote that as will be shown in section 2.1.2.
Besides, as asserted in Wang et al (2004) the practice of using quadratic tetrahedral elements leads to a common way to perform finite element analysis. From their work, tetrahedral and hexahedral elements solution is compared when nonlinearities occur and quadratic tetrahedral elements seem to be a good choice. Thompson et al (1998) also consider the use of tetrahedral element since the advance of the computational tools for creating these meshes for complex geometries.
Implicit time integration scheme is employed to solve governing finite element equations, instead explicit time integration. It is a direct-time integration method and it can be considered unconditionally stable, which means that the restriction of time-step on simulation that is found in explicit methods, may be reduced, Bathe (1982) and Noh and Bathe (2018).
It has been shown that such a method has attracted researchers’ interest to solve problems involving nonlinearities using it, for instance, Subbaraj and Dokainish (1989); Kazanci and Bathe (2011), Bathe and Noh (2012), Noh et al (2013) and Noh and Bathe (2018). In addition, relatively few works are available applying implicit time integration for crash simulations, but it should be considered as an effective choice for a simulation. Thus, this work contributes in such feature.
Augmented Lagrange formulation is a penalty-based contact formulation and for nonlinear solid body contact, it represents a solution option. It combines either the penalty method with Lagrange multipliers method, Wriggers (2006). The main problem related to this formulation is to set a good value for the normal stiffness, but it is less sensitive to contact stiffness than penalty method. Equation (1) represents a solution for nonlinear problems.
2,
2
t c
L x f x h x h x (1)
where λ represents the Lagrange multipliers determined through an iterative manner for each element and c a scalar factor.
According to the software manual, the two main advantages of this formulation is that it is useful for any type of contact behavior, contact detection occurs in integration points and for friction contact with large deflection some additional controls exist to avoid large penetrations. Details concerning the contact settings will be discussed in section 2.1.2.
2.1.1 Global Analysis
The complete model of the vehicle seat has 175 components (Fig. 1 (a)) and 137 contact surfaces. As a result, to accomplish the finite element modelling, it is important to remove geometry problems associated with 3D CAD operations editing the model or eliminating some components that have an influence under the target mechanism, but should not be present in the discrete model, as discussed in section 2.1 and illustrated by Fig. 4.
In fact, the runtime and computational cost involved to process the complete model can be excessive. Hence, the use of submodeling technique represents a manner to restrict the finite element analysis in a relatively small region of a larger model, as the anchorage mechanism in the full seat model in Fig. 1 (b). It is a means of achieving detailed stresses using a simpler model. In the mechanical feature, Fig. 1 (b) is considered in a first finite element analysis to achieve the fine model shown in Fig. 5, called at this point of submodel.
Figure 5: Complete anchorage mechanism designated submodel.
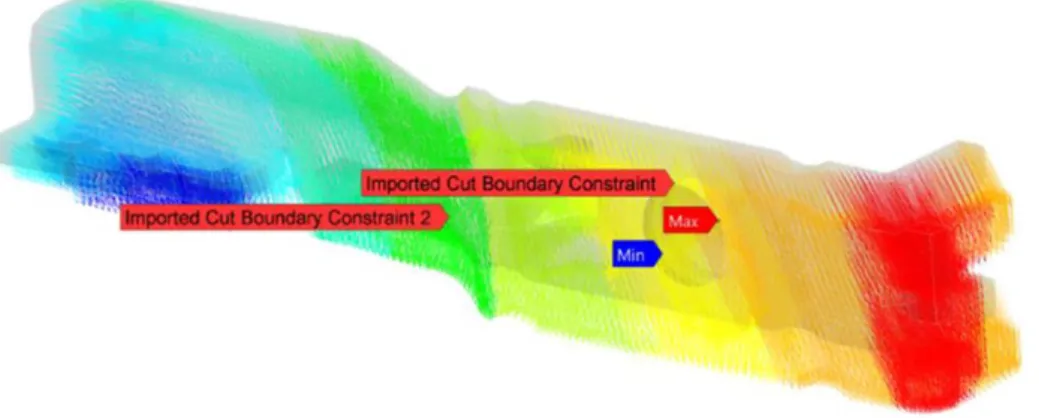
At first, the procedure begins with a coarse-mesh solution of the entire geometry, Fig. 1 (b), in a manner that could provide accurate deformations. For this, a convergence analysis was carried out providing results no longer superior to 3%. In general, information comes from the global model to the submodel through results mapping, i. e., displacements from the global model are mapped to specified cut boundaries on the submodel, as shown in Fig. 6. Its displacement boundary conditions are taken out from the global model using displacement interpolations and then, it is treated as a new model independently from the global one Moller and Sundlo (2017).
Figure 6: Cut boundaries to obtain the submodel (anchorage mechanism).
Forces from the entire geometry to the anchorage mechanism should be determined provoked by the acceleration levels established in Regulation nº 17, Fig. 3.
For the coarse finite element model, linear elastic material, coarse mesh, bonded contact for all contacts and fixed support in the bolts were applied. For the element quality as mentioned in section 2.1, the aspect ratio is 2.140 less than 10 and Jacobian 1.05 near to 1.0. Then, the mechanical analysis consisted in applying the standard corridor simulating a rear and frontal collisions.
For the following sections, the analyses will be restricted to the finite element model of the mechanism shown in Fig. 5 with a resultant force applied in the specified point shown in Fig. 7.
Figure 7: Resulting force at the lock device considering a rear impact.
2.1.2 Particular Analyses
This section aims to show some particular analyses referred to the anchorage mechanism such as the modal and harmonic analyses, boundary and contact conditions, mesh convergence and linear analysis.
As the anchorage mechanism will be verified in quasi-static and transient analyses, a starting point for a transient analysis is the modal analysis using Block Lanczos method. According to the corridor Fig. 3, acceleration interval lasts about 0.020 s and, consequently the excitation frequency could be inferred about 50 Hz. From the modal analysis, the lower natural frequencies for the anchorage mechanism is about 604 Hz. Cook et al. (2002) affirms that whether the excitation frequency is less than the lowest structural natural frequency, the inertia forces may be neglected considering only the stiffness matrix and displacement vector. Section 3.1 confirms such a result.
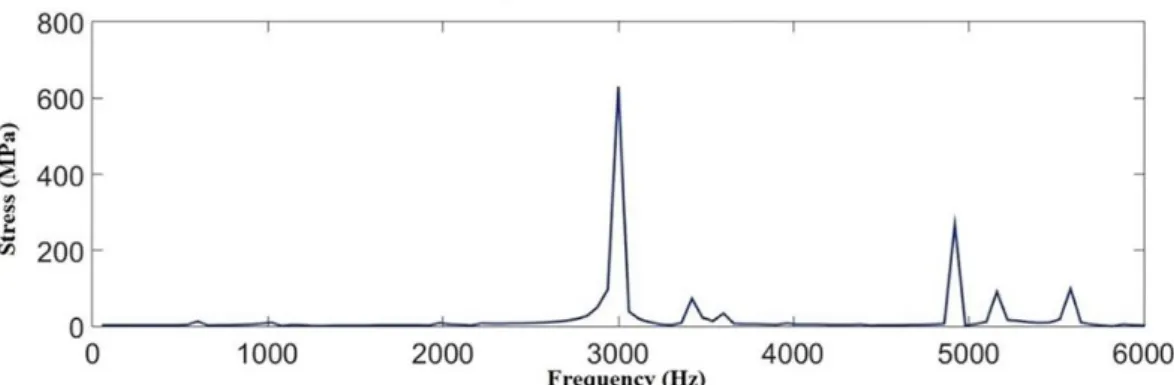
Next, a harmonic response analysis allowed predicting the fundamental frequency, as shown in Fig. 8. From this analysis, the fundamental frequency is about 3000 Hz.
Figure 8: Anchorage mechanism harmonic response considering frequency versus stress.
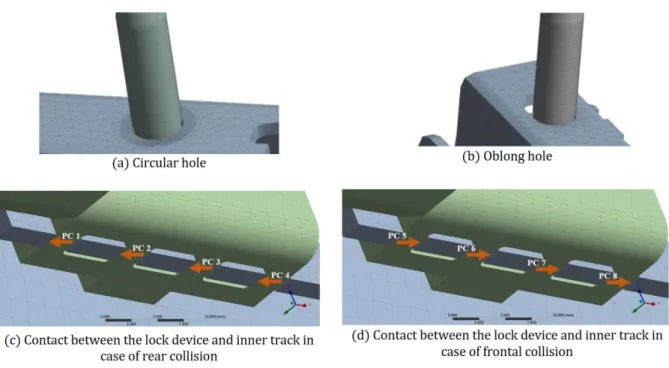
As pointed in section 2.1.1, the number of contact surface related to the entire model was 137. In the submodel, these surfaces reduce to six as shown in Fig. 9. At Fig. 9 (c) and (d), at each situation, PC means “Point of Contact” and they are numbering from 1 to 4 in case of rear collision and from 5 to 8 in case of frontal collision.
The main contact surfaces are the circular and oblong holes in contact with the bolts and between the lock device and the inner track, when two hazardous scenarios may occur rear and frontal collisions. Indeed, frictional contacts provoke convergence difficulties and then the quality of the contact mesh is essential avoiding excessive interpenetration and a suitable contact in the first substep simulation, respecting the ambiguous boundary conditions by Signorini, Truesdell et al. (1984).
Figure 9: Illustration of the surface contacts considered in the submodel.
For the penetration contact, in Fig. 8 (a) and (b), the initial values are 1.93e-003 and 3.53e-004, respectively. For points PC1 and PC5, PC2 and PC6, PC3 and PC7 and PC4 and PC8 values are 1.34e-004, 6.41e-004, 2.84e-004 and 3.57e-003. In addition, for all surface in contact, contact stiffness was upgraded at each iteration and the detection method was Gauss integration points, since it increases the number of contact detection points between the surfaces.
A finite element analysis solves a mathematical model that represents a physical problem. This model represents assumptions on geometry, kinematics, material law, loading and boundary conditions for this problem. These values correspond to a system of differential equations to be solved in a specific domain with known initial conditions. In a finite element model, boundary conditions represent the motion restriction (geometric boundary conditions) and the applied forces (force boundary conditions), Bathe (1982). Four bolts rigidly fixe the vehicle seat to the vehicle floor and they restrain any rotation or translational motion in x, y and z.
The motion between the lock device (Fig. 2a) and the inner track (Fig. 2b) was constrained in the ‘y’ direction, as shown in Fig. 10, as well as the motion of bottom surface of the inner track and the vehicle floor in the ‘z’ direction. The last boundary condition is the applied force as shown in Fig.7.
Figure 10: Motion restriction applied to the lock device and the inner track.
in monitoring the stresses values at the regions of contact treated at Fig. 9. The mesh size was fixed as 0.6 mm at the region near to the contacts and 2.0 mm away from it.
A linear analysis was carried on in the anchorage mechanism just to verify the stress that these components are submitted. In all cases, the stresses considering an acceleration of 20 g was higher than the yield stress of the specified material (section 2.2) of the components, reaffirming the choice of a nonlinear analysis.
2.2 Material properties
Materials with an elastic response present induced stresses below the yield strength. Nevertheless, if a ductile material suffers stresses beyond this stress limit, it develops large permanent deformations and strains are not reversible. Plastic strains are independent of time Dixit (2014).
In finite element analysis, it is common to use constitutive equation to furnish input data as the material parameters. Such equations consist on a mathematical representation of the relationship between flow behavior of the material and a process parameter, such as stress flow and the plastic strain, Sener and Yurci (2016).
Occasionally, the solution of problems that involves plasticity requires empirical equations that describe the strain dependence of the flow stress. In 1945, Hollomon proposed a formulation to describe the mechanical behavior of metallic alloy in which strain hardening is predominant. As the Hollomon’s equation seems to have good approximation restricted to the area of large plastic strain, it does not include the full-range behavior of some metals. Thus, in 1952, Swift also proposed an equation which considers a possible pre-strain Fernandes et al (1998), Nutor et al (2017) and Cao et al. (2017).
These models are quasi-static models, which denote the stress-strain relation based on material constants as ‘K’ the strength coefficient; ‘n’ the strain hardening coefficient; εp plastic strain and ε0 initial strain. The models are shown in the Eq. 2 and Eq. 3.
np
K
(2)
0
n
p
K
(3)The stress-strain curves adopted the following material constants values applied to the Eq. 2 and Eq. 3: the strength coefficient ‘K’ was about 530 MPa and the strain hardening ‘n’ was 0.26 for the components at the anchorage mechanism. The materials specified for the lock device, inner track and bolts are S420MC, S355MC and ASTM A193 B7, respectively. S420MC and S355MC are high-strength steels for cold-forming; the components that they are applied are cold-pressed parts. The percentage of 0.09% of niobium guarantees the high-strength. Both materials meet the requirements in the European Standard EN 10149-2 (2013). B7 is a common grade for bolts and they are manufactured from chromium-molybdenum steel.
The yield stresses for the material of the lock device was 420 MPa; for the inner track 355 MPa and for the bolts 517 MPa. The ultimate stresses were 480 MPa, 500 MPa and 689 MPa, respectively. The Poisson coefficient was 0.3. For the Eq. 3, ε0 was very small, and then the stress-strain curves obtained for both models were very similar. These curves were an input data for the finite element analysis.
According to the finite element commercial package, the stress-strain behavior of material was the multilinear isotropic plasticity option and as an isotropic hardening, the yield surface remains the same shape and it keeps its initial centerline. As the plastic strains develop, the yield surface expands just in size. This option is suitable for the static and dynamic analyses carried on, because no cyclic loads stepped in.
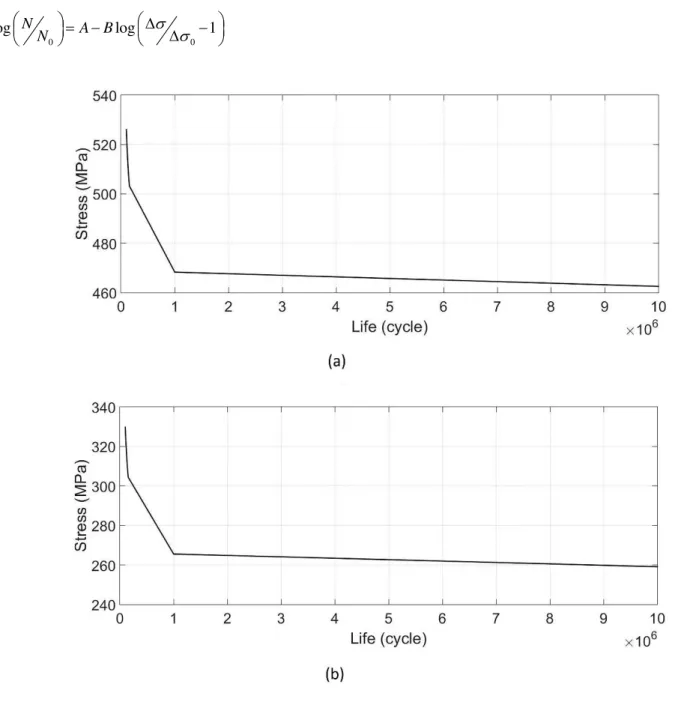
The material’s properties referring to the Fatigue Life Analysis requires the fatigue strength coefficient 9.2e8; fatigue strength exponent -0.106; ductility coefficient 0.213; ductility exponent -0.47; cyclic strength coefficient 1.0e9 and cyclic strain hardening exponent 0.2.
0 0
log N A Blog 1
N
(4)
Figure 11:. S-N curves for the a) lock device b) inner track applying the Stromeyer model
3 RESULTS AND DISCUSSION
This section presents the results obtained to the finite element model related to the static and transient analyses of the anchorage mechanism. As described, they refer to two situations: frontal and rear collisions that will be shown in sections 3.1 and 3.2. In both situations, the anchorage mechanism of the seat vehicle undergoes two acceleration curves that, according to Fig. 3, possess constant levels of acceleration equal to 20g and 30g as prescribed in the Regulation nº. 16. The fatigue life analysis will be treat in section 3.3.
3.1 Frontal collision: static and transient analysis at accelerations of 20g and 30 g
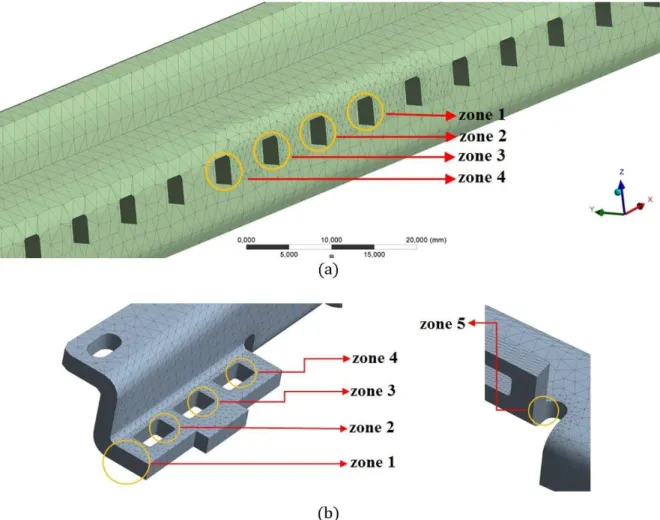
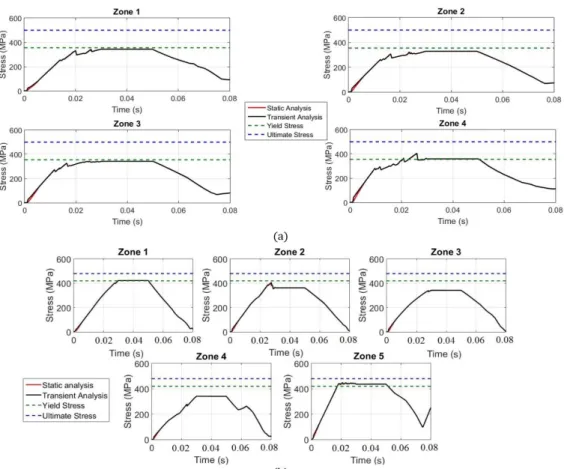
From Fig.13 (a), it is noticed that contact regions of the inner track experiences stresses very close to the yield stress of the material, but at deceleration time between 50 ms and 80 ms some stress remains. The region 4 at Fig. 12 (a) exceeds the yield limit of the material 355 MPa about 30 ms.
From Fig 13 (b), for the maximum level of acceleration 20g regions 1 and 5 of the lock device exceed the yield stress limit, Fig. 12 (b). As noticed in Fig. 13 (a), also in the deceleration time some level of stress remains at the end of the numerical simulation possibly caused by contact recovery. This value is more pronounced at region 5 where the maximum stress exceeds the yield stress about 5%.
As seen in Fig 13, the curves of static and transient analyses are extremely close, consequently for 30g acceleration, the transient analysis was not carried out. However, the regions of investigation were the same as established in Fig. 12. Figure 14 shows the stress x time for the inner track and lock device, respectively and it compares the stresses flow at 20 g and 30 g.
Figure 13: Stresses x time for the anchorage mechanism considering an acceleration curve of 20g (a) zones at inner track (b) zones at lock device.
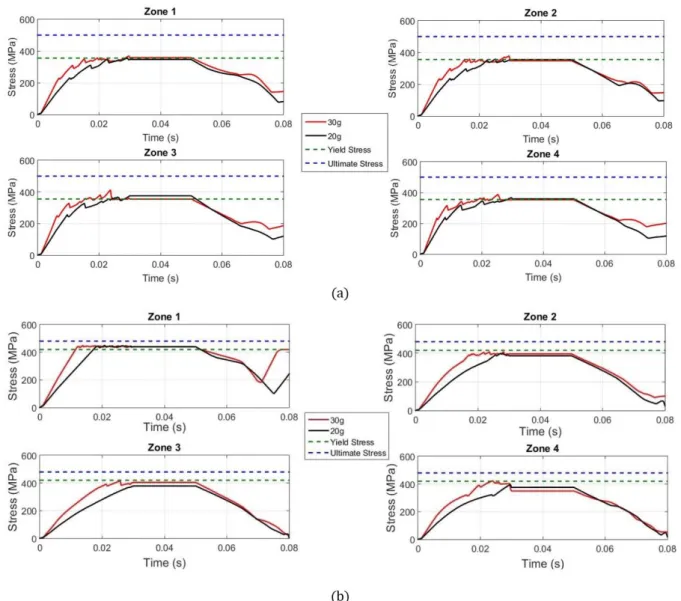
From Fig. 14, it is noticed that the regions that undertake a stress value above the yield stress are the same identified at 20g, Fig. 13. Furthermore, the stress stabilizes when its values is near to the material’s yield stress as happened in case of 20g.
In fact, the materials applied on the inner track and on the lock device are particularly ductile; as a result, a relevant increase in tension is detected only for high rates of strain. Such mechanical characteristic avoid a major stress increase under a force corresponding to 20g and 30g. Nevertheless, the stresses corresponding to the acceleration and deceleration at 30g curve were, in most cases, greater than those referring to 20g curve at any instant.
3.2 Rear collision: static and transient analysis at accelerations of 20g and 30 g
For rear collision, only the static analysis is shown, because as previously discussed results of stress versus time are very similar for both analyses.
Figure 15: Stresses x time for the anchorage mechanism considering static analysis and accelerations of 20g and 30g (a) regions at inner track (b) regions at lock device.
Figure 15 illustrates these results for 20g and 30g accelerations compared to the yield and ultimate stresses of the applied materials in inner track and lock device.
ratio defined as the ratio between equivalent elastic strain,
eqel, and the equivalent total strain,
eqtot, taken at the first part of loading curve shows that at zone 2, 3 and 4 such a value remains constant and equals to the original value sets in the beginning of the analysis. However, at zone 4 as plastic strain is detected this value change about 0.42.From the Fig. 13, 14 and 15, numerical instabilities are remarked in all the graphs especially when the vehicle accelerates until it arrives at the maximum acceleration 20g or 30g. Such a feature is more evident in the inner track at zone 3, when this component undergoes an acceleration of 30g from rear.
Figure 16: Study of the influence of the coefficient of friction in the numerical stability
As could be seen in Fig. 16, it seems that the friction coefficient established in the contact could provoke such comportment. The figure compares the various features of instability varying the coefficient of friction until the case of bonded contact, which assumes infinite frictional resistance. At this case, the equivalent shear stress developed between two contacting surfaces is not exceeded to allow sliding. Notice that the bonded contact leads to lower stresses and instabilities are negligible.
However, once the equivalent shear stress is exceeded, two surfaces could slide relative to each other. As a result, the lower the coefficient of friction the lower the equivalent shear stress as a fraction of the contact pressure hence, more instabilities will arrive. Remained stresses after 50 ms are due to the recovery contact, as discussed in section 3.1. Notice that this value is not relevant for bonded contact.
3.3 Analysis for the bolts in frontal and rear collisions
The bolts in the circular and oblong holes, respectively in Fig 17 (a), experience some stress that are under the yield stress of its material, as presented in the section 2.2. The bolt in the oblong hole did not suffer any stress in the frontal collision, because any contact occurs in such an impact.
The bolts in circular holes support the stresses produced by the frontal collision at 30g in the manner that the stresses perceived at this component are higher than the yield stress, Fig. 17 (b).
However, the bolts at circular and oblong holes have a state of stress below the material yield stress in a rear collision considering a maximum acceleration value, as could be seen in Fig. 17 (a).
In two occasions, the stresses in bolts are higher than those found in the inner track or lock device, Fig. 17. Besides, the yield stress for bolts is about 520 MPa indicating a greater region of elastic strain. This is an important point of project to avoid premature plastic strains.
Figure 17: Stress x time for the bolts (a) circular and oblong holes in case of rear collision (b) circular hole in case of frontal collision
3.4 Fatigue life analysis
Fatigue refers to a failure under a repeated or varying load that never reaches a level sufficient to cause failure in a single application. The main issue of a fatigue life analysis to any mechanical component is the number of cycles of loading, N, that it can sustain before failure occurs, as discussed in Budynas and Nisbett (2015). According to the ASTM E206-72 (1979) the fatigue can also be understood as “The process of progressive localized permanent structural change occurring in a material subject to conditions which produce fluctuating stress and strains at some point or points and
which may culminate in cracks or complete fracture after a sufficient number of fluctuations”.
Al-Bahkali et al (2015) carried out a study about fatigue life estimate and failure of the 2024-T3 aluminium tube used as a seat support tube of the troop aircraft seat caused by multi-axis vibration at higher frequencies. The C-130 Lockheed Martin Aircraft has this kind of support tube and based on dynamic analysis, it is susceptible to excessive vibration.
Two reasons encourage the work, the first one the numerous complaints of fatigue and pain by the aircraft’s troop and then, the failure of this component after some flight hours. As said, vibration of that type of airplane may provoke mechanical and orthopedic problems, like neck and back pain during prolonged operation.
Such work demonstrates a concern about the attachment of the seating system to fuselage not only for structural aspects, but also for users’ safety and comfort. In addition, despite the fatigue life cycle be affected differently in the present work and that of Al-Bahkali et al. (2015), both focus in the same mechanism the seat anchorage system.
the fatigue failure can be provoked by damage accumulation caused by loading decreasing as discussed in Fatemi and Yangt (1998), in the present case, impact of 5g follows by deceleration of 1g, as presented above.
Firstly, it is supposed that the anchorage mechanism undergoes a rear impact of 5g, such value is justified as explained in section 1 based on Meyer (2016). It appears that this deceleration level does not provoke major damage and vehicle could be repaired. For this current analysis, the concept of submodeling is still applied, as discussed in section 2.1.1. Nevertheless, the deceleration curve is not preview in Fig. 3 then, in order to overcome such issue deceleration is applied considering the same duration as in 20g and 30g, 80 ms. At these conditions, the vehicle anchorage system experiences such stress flow provoked by these circumstances. In the discrete model, displacements at nodes remain from this type of accident and contacts are updated after this fortuitous event without losing contact.
In addition, vehicles undertaking deceleration level about 1g configure a frequent driving behavior in the real world, during the life cycle of the seat Jeppsson et al. (2018). Consequently, fatigue life cycle analysis of the seat anchorage mechanism seems quite appropriate, because it is subjected to variable loading.
This event could take place frequently in sudden braking, for instance, to avoid road accidents. As stated in the kinematics, it means that if a vehicle brakes at 1g, it travels approximately at 35 km/h and, it can brake to a standstill in one second, consequently, passengers experience a deceleration of 1g.
Similarly, a more suitable methodology to achieve the same level of deceleration applying the finite element method is considering a force of 852N acting in the backrest of the vehicle provoking a force magnitude of 447 N in the lock device at the same place, as shown in Fig. 6. The estimate of this total force considers the BioRID® 50th percentile male dummy used in rear test impact, which weighs about 79 kg.
According to Shen et al. (1999), the assessment of human weight distribution through the vehicle seat could be a difficult task due to the variety of seat design and occupant anthropometry and difference in the angles of seat cushion and seatback. In addition, to consider a normal posture of seating leads to a symmetrical distribution of body weight in the vehicle seat, which may differ from this idealized situation in real conditions.
Although these limitations, the estimate values presented in the work of Zacharkow (1988) seem to accomplish the objectives prevue at this paper. Thus, considering a normal sitting posture, body weight is distributed about 78% on seat cushion, 13% on seatback and the rest on the floor. Based on the dummy mass, it corresponds to 61.6 kg and 10.3 kg, respectively. Considering that the seat structure has a mass about 10 kg, the total mass of the system is 81,9 kg. According to Newton’s second law of motion the deceleration that the whole seat undergoes at these conditions is about 1g. Furthermore, according to the stress-life fatigue, this situation represents high-cycle application.
As a result, two situations comprise the whole fatigue analysis: the pre-existing effect of a 5g impact and the daily effects of deceleration braking of 1g that it is common cycle-use of a vehicle. Both are detailed above.
The adopted correction factor to the strength or endurance limit is about 0.269 for the fatigue analysis. It considers the surface condition modification factor of surface for as-forged surface finish ass 0.70; reliability factor 0.90; load modification factor as 0.85 and mean stress corrections in fatigue about 0,50 Budynas and Nisbett (2015). The fatigue curves for materials are depicted in Fig. 11.
In addition, the load of 447 N acting in the anchorage mechanism is predicted as a cyclic load with constant amplitude with multiplicative factors equal to 0 (lower limit) and 1 (upper limit) then, representing a force applied in one direction.
When the scenario previously described take place (5g impact and after a cyclic load), the fatigue life for the inner track zone 1, Fig. 12a, is 4.42e5 and for the region of the oblong hole the number of cycles is 8.0e5. These results show the available life in number of cycles until it fails (10e6 cycles). Similarly, the results related to the fatigue safety factor are less than one indicating failure before the design life is reached. For fatigue damage, except these zones, values are lower than one indicating no failure before the design life is attained.
Notice that the bolt in the oblong hole attaches the seat to the vehicle floor then, any fail at this region completely compromise the driver safety and, consequently of all passengers.
Actually, in real life, a vehicle may not be discarded after a 5g collision, but according to the fatigue analysis, the anchorage mechanism (inner track and lock device) has a low fatigue life presenting a finite life, which is unexpected for a component highly related to the occupant safety.
4 CONCLUSIONS
vehicle’s anchorage mechanism, especially acceleration curves. Three components were treated more carefully the inner track, lock device and the bolts.
Stresses generated at these components could be evaluated at the chosen hazardous events, and in most cases, they were below the elastic limit of the material. The crashworthiness of a structure indicates the ability of it to protect its occupants during an impact. Therefore, based on the methodology presented in this paper, authors infer that this specific vehicle seat is primarily safety under the conditions established for the numerical simulations. Notice that safety evaluation of such a vehicle seat directly depends on seat mass, material components, occupant mass and adopted deceleration curve.
However, the vehicle seat may not be considered safe enough based on the results of a fatigue life analysis, considering cumulative damage fatigue. For such an analysis, the seat endures an impact of minor damage follow by loading corresponding to 1g deceleration during normal driving, as discussed in section 3.3. It could be seen that the fatigue life analysis pointed that the inner track and the region of the oblong hole have fatigue damage and factor of safety so lower that the components will not reach life design.
There is not any requirement in Regulation Nº 17 from Un/ECE that impose a fatigue life analysis of vehicle seat components after minor damage events. However, such an analysis seems relevant since these driving conditions are common also, assessing the safety of a vehicle seat, it could be decisive. As a result, to increase the fatigue life of the anchorage mechanism the design project would be changed including material properties, for instance.
References
Al-Bahkali, E. A., Elkenani, H. and Souli, M. (2015). Failure and fatigue life estimate of a pre-stressed aircraft seat support tuve. Engineering Failure Analysis 54:120-130.
ASTM E206-72 (1979). Definitions of terms relating to fatigue testing and statistical analysis of fatigue data.
Bathe, K-J, Noh, G. (2012). Insight into an implicit time integration scheme for structural dynamics. Computers and Structures 98-99, 1-6.
Bathe, K-J. (1982). Finite Element Procedures, Prentice Hall.
Budynas, R. G., Nisbett, J. K. (2015). Shigley’s Mechanical Engineering Design. Mc Graw Hill.
Cao, J., Li, F-G., Ma, X-k and Sun, Z-k. (2017). Tensile stress-strain behavior of metallic alloys. Transactions of Nonferrous Metals Society of China 27: 2443-2453.
Castillo, E. and Fernández-Canteli, A. (2009). A unified statistical methodology for modeling fatigue damage. Springer Science.
Chen, H., Chen, H., Wang, L. (2014). Analysis of vehicle seat and research on structure optimization in front and rear impact. World Journal of Engineering and Technology 2: 92-99.
Cook R. (1989). Finite element modeling for stress analysis. Jhon Wiley & Sons Incorporation.
Cook, R. D., Malkus, D. S., Plesha, M. E. (2002). Concepts and applications of finite element analysis. John Wiley & Sons (New York).
Dixit, P. M. (2014). Plasticity: Fundamentals and Applications, CRC Press.
Economic Commission for Europe. (2012). Addendum 15: Regulation 16. Uniform provisions concerning the approval of safety-belts, restraint systems and isofix child restraint systems for occupants of power-driven vehicles. Vehicles equipped with safety-belts, safety-belt reminder, restraint systems, child restraint systems, isofix child restraint systems.
ECE/324/Rev.1/Add.15/Rev.6 – ECE/TRANS/505/Rev.1/Add.15/Rev.6. Economic Commission for Europe – United Nations.
Economic Commission for Europe. (2014a). ECE/TRANS/WP.29/78/Rev.3. Economic Commission for Europe. Inland Transport Committee. World Forum for Harmonization of Vehicle Regulations. Consolidated Resolution on the Construction of Vehicles.
Economic Commission for Europe. (2014b). Addendum 16: Regulation 17. Uniform provisions concerning the approval of vehicles with regard to the seats, their anchorages and any head restraints. ECE/324/Rev.1/Add.16/Rev.5 –
ECE/TRANS/505/Rev.1/Add.16/Rev.5. Economic Commission for Europe – United Nations.
Fatemi, A. and Yangt, L. (1998). Cumulative fatigue damage life prediction theories: a survey of the state of the art for homogeneous materials. International Journal of Fatigue 20 (1):9-34
Fernandes, J. V., Rodrigues, D. M., Menezes, L. F. and Vieira, M. F. (1998). A modified Swift Law for prestrained materials 14: 6: 537-550.
Fulmali, S. M., Gawande, R. R. and Nimkar, P. R. (2015). Modeling and FEM analysis of bus passenger seat. International Research Journal of Engineering and Technology 2: 06: 619-623.
Haan, R., (2002). FE model of a car seat: creating an assessment tool for comfort analysis, M. Sc. Thesis (in English),
Eindhoven University of Technology. TNO Automotive Institute. Netherlands.
Jeppsson, H., Ostling, M. and Lubbe, N. (2018). Real life safety of increasing brake deceleration in car-to-pedestrian accidents: simulation of vacuum emergency braking. Accident Analysis and Prevention 111:311-320.
Kang, S. J., Chun, B. K. (2000). An effective approach to prediction of the collapse mode in automotive seat structure. Thin-Walled Structures 37: 113-125.
Kazanci, Z., Bathe, K-J (2011). Crushing and crashing of tubes with implicit time integration. International Journal of Impact Engineering 42: 80-88.
Meyer, E. (2016). Understanding injury mechanisms from real world accidents. Master’s Thesis (in English) in
Automotive Engineering, Chalmers University of Technology.
Moller, C. and Sundlo, O. (2017). Method for merging scales in finite element analysis: framework for automated global/local analyses. Master’s Thesis (in English) in Applied Mechanics, Chalmers University of Technology.
Noh, G., Bathe, K-J (2018). Further insights into an implicit time integration scheme for structural dynamics. Computers and Structures 202: 15-24.
Noh, G., Ham, S., Bathe, K-J (2013). Performance of an implicit time integration scheme in the analysis of wave propagations. Computers and Structures 123: 93-105.
Nutor, R. K., Adomako, N. K. and Fang, Y. Z. (2017). Using the Hollomon model to predict strain-hardening in metals. American Journal of Materials Synthesis and Processing 2(1): 1-4.
Saczalski, K., Pozzi, M., Burton, J. and Saczalski, T. (2014). Experimental and field accident analysis study of factors effecting rear seated child occupant injury risk and safety in rear impacts. Fisita World Automotive Congress 2014. Maastricht, Netherlands.
Sener, B., Yurci, M. E. (2016). Comparison of quasi-static constitutive equations and modelin of flow curves for austenitic 304
and ferritic 430 stainless steels. Special issue of the 6th International Congress & Exhibition. Maslak, Istambul.
Shen, W., Parenteau, C., Roychoudhury, R. and Robbins, J. (1999). Seated weight distribution of adults and children in
normal and non-normal positions. Association for the advancement of automotive medicine 43:383-397.
Singh, V., Shaikh, S. A. (2014). Automotive seat modeling and simulation for occupant safety using dynamic sled testing. International Journal of Engineering Research & Technology 3: 7: 1501-1505.
Subbaraj, K., Dokainish, M. A. (1989). A survey of direct time-integration methods in computational structural dynamics –
Implicit methods 32: 6: 1387-1401.
Thiyagarajan, P. B., (2008). Non-linear finite element analysis and optimization for lightweight design of automotive
seat backrest, M. Sc. Thesis (in English), Clemson University.
Thompson, J. F., Soni, B. K. and Weatherill, N. P. (1998). Handbook of grid generation, CRC Press.
Truesdell, C., Antman, S. S., Carlson, D. E., Fichera, G., Gurtin, M. E. and Naghdi, P. M. (1984). Mechanics of Solids Vol. II. Springer-Verlag Berlin Heidelberg Gmbh.
Wang, E., Nelson, T. and Rauch, R. (2004). Back to elements – tetrahedral vs. hexahedral. In Proceedings of 2004 International Ansys Users Conference, Pittsburg, PA.
Wirotrattanaphaphisan, K., (2007). Innovative conceptual design for a convenient car seat, M. Sc. Thesis (in English),
Wriggers, P. (2006). Computational Contact Mechanics. Springer.