ISSN 0104-6632 Printed in Brazil
www.abeq.org.br/bjche
Vol. 22, No. 03, pp. 331 - 339, July - September, 2005
Brazilian Journal
of Chemical
Engineering
OBSERVANCE OF POLYMORPHIC BEHAVIOUR
DURING DISSOLUTION OF INSULIN AND
LYSOZYME
A. Bernardo¹, C. E. Calmanovici² and E. A. Miranda¹
*¹Departament of Bioprocess Engineering, School of Chemical Engineering, State University of Campinas, Unicamp, Phone: +(55) (19) 3788-3918, Fax: +(55) (19) 3788-3890,
P.O. Box 6066, CEP 13083-970 - Campinas - SP, Brazil. E-mail: [email protected]
²Oxiteno R&D Centre, Oxiteno, Mauá, Brazil.
(Received: November 12, 2003 ; Accepted: January 6, 2005)
Abstract - Although protein crystallization is a unit operation with potentially high separation factors, it has not been widely used in industry. Protein crystallization studies and practices have hitherto been largely limited to crystallography protocols. Knowledge of the behaviour of protein in solution would help to overcome empiric limitations in protein crystallisation. Thus, dissolution of porcine insulin and hen egg white lysozyme was studied and an unusual variation in solute concentration, with a concentration peak for short dissolution times, was verified. Polymorphic behaviour of protein in solution was observed, which altered physical properties such as solubility.
Keywords: Insulin; Lysozyme; Dissolution; Pseudopolymorphism; Solvatomorphism; Solubility.
INTRODUCTION
Protein crystallisation has been little used as a downstream processing step in the bioprocess industry. Considering its great potential for achieving high purification and separation levels, one of the major obstacles to a wider use of crystallisation in this industry has been the lack of thermodynamic and kinetic data required for efficient crystallisation (Saikumar et al., 1998). Although until 2001 almost 400 biopharmaceuticals had either been approved or were in advanced clinical trials, insulin was the only product produced and administered in crystalline form (Shenoy et al., 2001). Moreover, since powder is the most economical form for storing and transporting proteins and most protein is used in solution, a very good knowledge of protein dissolution and its implications is of paramount importance to the pharmaceutical industry.
The very nature of proteins imposes several specificities to the study of their crystallisation. The main differences arise from the large size, low symmetry, large solvent content in protein crystals and low binding energies. Low binding energies cause the protein crystals to be soft and sensitive to small changes in external conditions. Proteins have a large number of potential attachment sites that are energetically almost as favourable as the small number of specific sites at which an ordered array (crystal) is formed (Kam et al., 1978).
solvent molecules. In these cases, the most frequently used term is “pseudopolymorphism”, although some authors also use the term “solvatomorphism”. Polymorphic form is usually identified by the powder X-ray diffraction measurement (Yoshihashi et al., 2000).
This article reports an abnormal behaviour of two well-known proteins (porcine insulin and hen egg white lysozyme) during their dissolution. After carefully studying the protein dissolution, evaluating the effects of pH and temperatures and analysing
X-ray diffraction responses, the polymorphic behaviour was found to be the most probable explanation for the observed kinetics of dissolution of these proteins.
EXPERIMENTALSECTION
The experimental procedure can be described as a sequence of actions taken as when determination of protein solubility revealed abnormal behaviour during dissolution, as shown in Figure 1.
Figure 1: Schematic representation of experimental procedure.
Reagents
The porcine insulin (96.57% purity according to supplier) was gently donated by Biobrás, Brazil. The hen egg white lysozyme (purity of 99% according to supplier) was produced by Sigma, USA. Ultra-pure water was obtained by utilising Milli-Q from Millipore, USA. Anhydrous sodium acetate was produced by Merck, Germany and sodium chloride was purchased from Labsynth, Brazil and glacial acetic acid from Ecibra, Brazil.
Dissolution by Magnetic Stirring
In a 50 mL Erlenmeyer flask, 150 mg of insulin and 50 mL of 0.1 M sodium acetate solution with 7% NaCl were mixed, forming a suspension with an initial concentration of 3.0 mg/mL. The suspension was stirred with a magnetic bar in a controlled temperature bath. Periodically, a 1.0 mL sample was
taken from the solution. The samples were centrifuged and the protein concentration of the resulting supernatant solution was measured.
Dissolution by End-Over-End Rotation
Determination of Total Protein Concentration
Total soluble protein concentration was determined by measuring absorption at 280 and 320 nm in a Beckman spectrophotometer DU650 (USA). The differences between these measurements were used in the calculate concentration in order to avoid errors due to the occasional presence of particulate material in solution(Gehle and Schügerl, 1984).
Test for Insulin Fibrillation
The possibility of insulin fibrillation was verified by an assay similar to the end-over-end rotation dissolution. A 16.5 mL glass tube with 15 glass beads (ca. 2 mm diameter) was filled with 50 mg of insulin. The headspace was filled up with 0.1 M sodium acetate solution with 7% NaCl. In this way, the hydrophobic interfaces were eliminated, except for the entrapped air in the pores of the insulin particles. This virtually eliminated the possibility of fibrillation occurring (Sluzky et al., 1992; Brange et al., 1997).
Redissolution Test
Insulin and lysozyme suspensions (3.0 and 20 mg/mL, respectively) were prepared in 0.1 M with 7 % NaCl and 0.05 M with 10 of NaCl sodium acetate solutions, respectively. The suspensions were stirred magnetically up to 48 h at ambient temperature and filtered with number 10 Whattman paper. The retained solids were dried for 12 h at ambient temperature. These solids were referred to as
processed particles and used in a second dissolution procedure with magnetic stirring (redissolution test).
X-Ray Diffraction
X-ray diffraction analyses were done with XRD 6000 equipment (Shimadzu, Japan) utilising CuΚα radiation; scanning tension and current were 40 kV and 30 mA, and sample rotation was 20 rpm. The angles (2θ) varied from 5 to 60° at 2° per minute.
RESULTS AND DISCUSSION
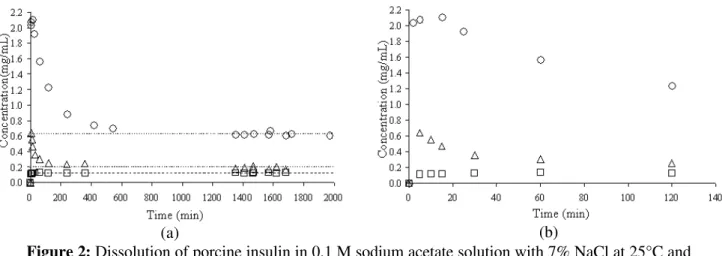
It is expected that the liquid-phase concentration of a dissolving solid increases with time until a plateau is reached, with this concentration plateau representing the solid solubility under a given condition. However, for insulin dissolution the behaviour observed was different as insulin concentration decreased after reaching a maximum (Figure 2). We addressed whether this behaviour would take place at different pH’s values (pH 3.2, 5.5, and 6.6). These values were chosen to evaluate the effect of the net surface charge of the molecules and of the different ways in which insulin molecules combine in solution. At pH 3.2 insulin is positively charged and is found predominantly as a combination of monomers or dimmers. At pH 5.5 (the isoelectric point of insulin) the net surface charge is null; and at pH 6.6 the molecule is negatively charged and predominantly combines as hexamers in solution (Blundell et al., 1972).
(a) (b)
Figure 2: Dissolution of porcine insulin in 0.1 M sodium acetate solution with 7% NaCl at 25°C and
different pH levels by magnetic stirring. The symbols ¨, ¡, and ? correspond to the mean values of a triplicate at pH’s values of 3.2, 5.5, and 6.6, respectively. Figure (a) is the original figure and (b)
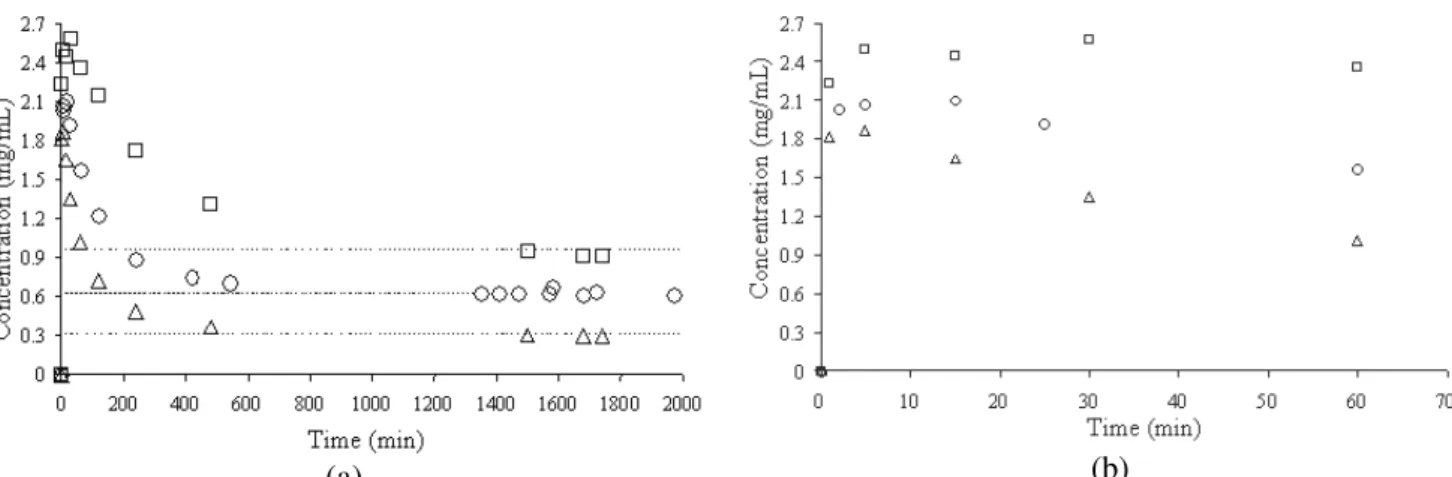
The same dissolution behaviour was observed keeping the pH value constant at 5.5 and varying the temperature (Figure 3).
Taking the solubility of insulin as the average concentration on the plateau (time longer than 1500 min), its values for these three pH and temperatures levels were determined (Table 1).
The variation in solubility with pH at 25°C was the opposite of the behaviour expected, since at the isoelectric point protein solubility is usually at its lowest value. However, at pH 5.5 was observed a local maximum value of solubility.
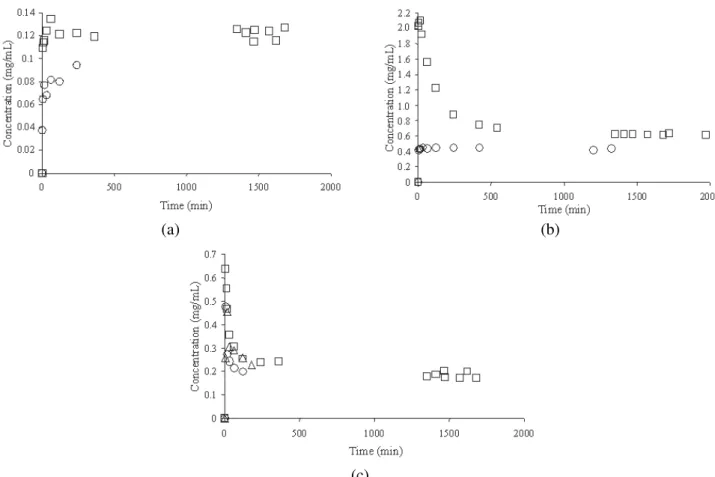
The profile observed for all conditions studied (a sharp peak for short periods of time, followed by a decrease in concentration to an equilibrium value) suggests the likely occurrence of some change in crystal structure or in crystallinity. In order to verify this hypothesis, dissolution profiles for original and processed insulin particles were determined (Figure 4).
Dissolution of processed insulin at pH 3.2 and pH 5.5 showed the expected behaviour: a monotonic increase in concentration tending asymptotically towards equilibrium, which suggests a structural rearrangement of insulin particles during dissolution. At pH 6.6, the unexpected behaviour of dissolution was obtained, even after insulin had been processed twice under this condition. Furthermore, at pH 3.2, the concentration peak was less accentuated than for the other pH’s. A possible explanation for this is that the relative quantities of hexamers in solution in the suspension at time zero may play a role in this phenomenon. According to Blundell et al (1972), at pH 7.0 almost all insulin in solution is combined as hexamers, and at pH 2.0 the dimmers are the species with the largest population. So, it is expected that at pH 6.6, insulin in solution is preferentially combined as hexamers, while at pH 3.2, insulin monomers and dimmers are predominant. At pH 5.5, an intermediate condition would be seen.
(a) (b)
Figure 3: Dissolution of porcine insulin in 0.1 M sodium acetate buffer solution with 7% NaCl at pH 5.50 and different temperatures by magnetic stirring. The symbols ¨, ¡, and ? correspond to the triplicates at
temperatures of 15, 25, and 35oC, respectively. Figure (a) is the original figure and (b) is a zoom of the concentration peaks. The dashed lines in (a) represent equilibrium values.
Table 1: Solubility of porcine insulin as a function of pH at 25°C in 0.1 M sodium acetate solution with 7% NaCl.
Temperature pH C* (mg/mL)a
25 3.2 0.1209 ± 0.0058
15 5.5 0.9181 ± 0.2049
25 5.5 0.6260 ± 0.0250
35 5.5 0.3013 ± 0.0946
25 6.6 0.1864 ± 0.0147
(a) (b)
(c)
Figure 4: Comparison between dissolution profiles of original and processed samples of insulin in
0.1 M acetate solution with 7% NaCl at pH 3.2 (a), pH 5.5 (b), and pH 6.6 (c). The symbols ¨, ¡, r
correspond to original sample, processed sample, and sample processed twice, respectively.
X-ray diffraction analyses of original and processed particles were done in order to evaluate occasional structural changes at the crystal level (Figure 5). Despite the low crystallinity of all samples, little difference between the spectra of the original and the processed insulin particles could be detected: the presence of well-defined peaks for the processed samples and a relative change in the halo from 5° to 25°. These peaks were sodium chloride peaks (found in the dissolving systems at a concentration of 7%). Their intensity did not vary under the different processing conditions, suggesting that this salt may only be found in void spaces. Changes in the halo from 5° to 25° suggest that processing had little effect on the low degree of cristallinity.
By comparing dissolution experiments and x-ray diffraction analyses, it may be inferred that a rearrangement of the structure occurs during dissolution as well as probably a change in the degree of solvation and that rearrangement is not affected by the processing conditions.
Furthermore, in order to guarantee that the observed changes are not due to degradation of the protein, the possibility of insulin fibrillation was
tested. Fibrillation is the most probable mechanism of insulin degradation, catalysed by hydrophobic surfaces under high shear (agitation) conditions. Figure 6 eliminates the possibility of fibrillation as under conditions in which fibrillation does not occur, a concentration peak was also observed.
Lysozyme dissolution was also studied to corroborate the results observed with insulin. Nevertheless, the amount of available lysozyme was much lower, which called for changes in methodology. Eppendorf flasks were used in the dissolution assays. Therefore the time necessary to reach equilibrium was longer for lysozyme due to the less vigorous mixing besides the specific kinetics of dissolution of this protein. As equilibrium data for lysozyme are quite common (Howard et al., 1988; Forsythe and Pusey, 1996), obtaining solubility data was not a goal, except for pH 3.5.
(a) (b)
(c) (d)
Figure 5: X-ray diffraction analysis of insulin samples: original (a) and processed at pH 3.2 (b), pH 5.5 (c), and pH 6.6 (d). Scanning tension, current, and velocity
were 40kV, 20 mA, and 2 °/min. Rotation of sample was 20 rpm.
Figure 6: Dissolution profile of porcine insulin in 0.1 M sodium acetate buffer solution with 7% NaCl at pH 5.50 in a glass tube rotated end-over-end with glass beads in an almost air-free
environment – conditions under which possibility of fibrillation is very remote.
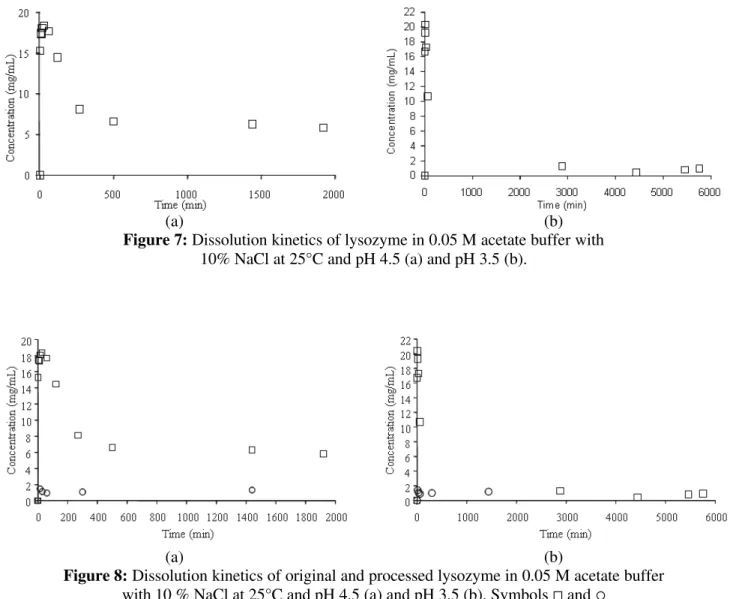
The unusual behaviour – already observed in insulin – was repeated with lysozyme (Figure 7).
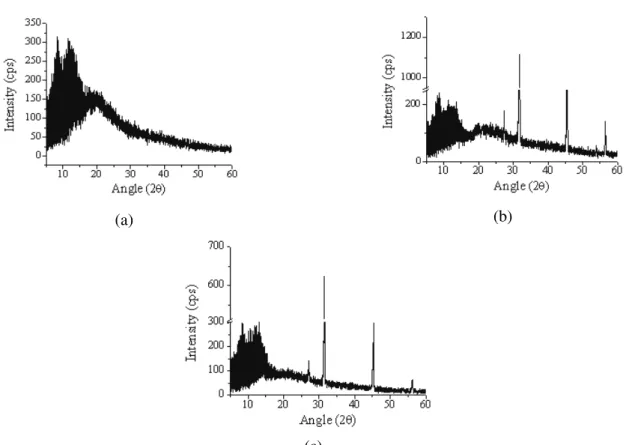
Protein concentration peaks during dissolution were also observed for lysozyme. Dissolution of processed lysozyme sample (Figure 8) and comparison of X-ray diffraction analysis of original and processed lysozyme (Figure 9) were done to verify the polymorphic behaviour, as the case of insulin.
peaks were detected at different intensities), suggesting that the salt was in someway associated with the protein molecules and not only included in void spaces, or else the void spaces could vary with processing conditions and accumulate different quantities of salt. However, the cause of the difference in peak intensity cannot be assured due to limitations of the X-ray technique.
The polymorphic behaviour of the proteins studied provides a plausible explanation for the concentration peak followed by equilibrium in the dissolution kinetics, since polymorphism is the existence of different crystalline structures for the same chemical species that can have different physicochemical properties. Moreover, polymorphism
should explain why the dependence of insulin solubility on pH is the opposite of what is expected. Different pH’s values would show solubility of different polymorphs, and not the variation in solubility of one single entity.
Regarding the low crystallinity observed in all conditions studied, Pikal et al. (1978) call attention to the importance of polymorphism in pharmaceutical systems and claim that partial crystallinity is a special case of polymorphism, which may have significant effects on dissolution rate and on chemical stability. Even a small quantity of amorphous phase in a different crystalline sample is sufficient to alter measurably the physical and chemical properties.
(a) (b)
Figure 7: Dissolution kinetics of lysozyme in 0.05 M acetate buffer with 10% NaCl at 25°C and pH 4.5 (a) and pH 3.5 (b).
(a) (b)
Figure 8: Dissolution kinetics of original and processed lysozyme in 0.05 M acetate buffer with 10 % NaCl at 25°C and pH 4.5 (a) and pH 3.5 (b). Symbols ¨ and ¡
(a) (b)
(c)
Figure 9: X-ray diffraction analysis of lysozyme: original sample (a), sample processed at pH 3.5 (b), and sample processed at pH 4.5 (c). Scanning tension, current, and velocity were 40 kV,
20 mA, and 2 °/min. Rotation of sample was 20 rpm.
CONCLUSIONS
The unique structure of protein molecules gives rise to the unique characteristics of their crystals. Proteins crystals have a much larger void volume and lower crystallinity than crystals of small molecules. Besides, their complex structure is heavily dependent on environment conditions, especially pH. Therefore, the dependence on pH of the behaviour of crystals in solution seems natural. This study showed the unique behaviour of protein crystals in solution. Insulin and lysozyme showed polymorphic behaviour during dissolution. This polymorphic behaviour was strongly dependent on pH for both molecules. One of the most important consequences of polymorphism is alteration of physical properties. This study shows that polymorphic behaviour strongly alters the solubility of insulin (solubility of lysozyme was not studied). Another important consequence is the variation in concentration of total soluble protein with time. As applications for protein have usually been pharmaceutical (as insulin for example) bioavailability is an important factor to be considered.
ACKNOWLEDGEMENTS
The authors thank FAPESP, Brazil, for its financial support and Luciano Vilela, BIOMM, Brazil (formely at Biobrás, Brazil) for his donation of insulin.
REFERENCES
Blundell, T. L., Dodson, G. G., Hodgkin, D. M., Mercola, D., Insulin: The Structure in the Crystal and its Reflection in Chemistry and Biology, In: Advances in Protein Chemistry; Anfinsen, C. B., Edsall, J. T., Richards, F. M., Eds.; Academic Press: New York, 1972; pp 279-403.
Brange, J., Andersen, L., Laursen, E. D., Meyn, G., Rasmussen, E., Toward Understanding Insulin Fibrillation, Journal of Pharmaceutical Sciences, 1997, 86, 517-525.
Continuous Flotation, Applied Microbiology and Biotechnology, 1984, 20, 133-138.
Howard, S.B., Twigg, P. J., Baird, J. K., Meehan, E. J., The Solubility of Hen Egg-White Lysozyme, Journal of Crystal Growth 1988, 90, 94-104. Kam, Z., Shore, H. B., Feher, G., On the
Crystallization of Proteins, Journal of Molecular Biology 1978, 123, 539-555.
Pikal, M. J., Lukes, A. L., Lang, J. E., Gaines, K., Quantitative Crystallinity Determinations for β-Lactam Antibiotics by Solution Calorimetry: Correlations with Stability, Journal of Pharmaceutical Sciences 1978, 67, 767-773. Saikumar, M. V., Glatz, C. E., Larson, M. A.,
Lysozyme crystal growth and nucleation kinetics, Journal of Crystal Growth 1998, 187, 277-288. Shenoy, B., Wang, Y., Shan, W. Margolin, A.,
Stability of Crystalline Proteins, Biotechnology and Bioengineering 2001, 73, 358-369.
Sluzky, V., Klibanov, A. M., Langer, R., Mechanism of Insulin Aggregation and Stabilization in Agitated Aqueous Solutions, Biotechnology and Bioengineering, 1992, 40, 895-903.