Universidade do Minho
Escola de Engenharia
Ana Paula Pinto da Silva
A Survival Prediction Model for
Colorectal Cancer Patients
Ana P
aula Pint
o da Silva
A Sur
viv
al Prediction Model forColorect
al Cancer P
atients
Ana Paula Pinto da Silva
A Survival Prediction Model for
Colorectal Cancer Patients
Dissertation supervised by
Paulo Jorge Freitas de Oliveira Novais
Master Dissertation
Integrated Master in Biomedical Engineering
Universidade do Minho
Escola de Engenharia
A G R A D E C I M E N T O S
Agradec¸o aos meus orientadores. Ao Professor Paulo Novais pelo profissionalismo e perseveranc¸a e, ao Tiago Oliveira por todo o acompanhamento, rigor e sobretudo pela sua dedicac¸˜ao.
Agradec¸o ainda ao Dr. Pedro Le˜ao, o seu contributo foi fundamental.
Aos que fazem parte do ISLab, pela disponibilidade e partilha de conhecimento que foi parte integrante desta tese.
Aos que me s˜ao pr ´oximos e acreditaram, mesmo quando eu duvidei. `
A minha fam´ılia. Pai, m˜ae e irm˜a, por tudo. Espero um dia poder retribuir minimamente tudo o que fizeram por mim e, um dia ser um exemplo para a minha sobrinha e afilhada.
A B S T R A C T
The importance of making predictions in health is mainly linked to the decision-making process. Make survival predictions accurately is a very difficult task for healthcare profes-sionals and a major concern for patients. On the one hand, it can help physicians decide between palliative care or other medical practice for a patient. On the other hand, the no-tion of remaining lifetime could help patients in the realizano-tion of dreams. However, the prediction of survivability is directly related to the experience of health professionals and their ability to memorize.
Most decisions are made based on probability and statistics, but these are based on large groups of people and may not be suitable to predict what will happen in particular cases. Consequently, the use of machine learning techniques have been explored in healthcare. Their ability to help solve diagnostic and prognosis problems has been increasingly exploited.
The main contribution of this work is a prediction tool of survival of patients with cancer of the colon and/or rectum, after treatment and a few years after treatment. The character-istics that distinguishes it is the balance between the number of required inputs and their performance in terms of prediction. The tool is compatible with mobile devices, includes a online learning component that allows for automatic recalculation and flexibly of the prediction models, by adding new cases.
The tool aims to facilitate the access of healthcare professionals for instruments that enrich their practice and improve their results. This increases the productivity of healthcare professionals, enabling them to make decisions faster and with a lower error rate.
R E S U M O
A importˆancia de fazer previs ˜oes na ´area da sa ´ude est´a sobretudo ligada ao processo de tomada de decis˜ao. Fazer previs ˜oes de sobrevivˆencia de forma precisa ´e uma tarefa muito dif´ıcil para os profissionais de sa ´ude e uma grande preocupac¸˜ao para os pacientes. Por um lado, pode ajudar os m´edicos a decidir entre cuidados paliativos ou outra pr´atica m´edica para um paciente. Por outro lado, a noc¸˜ao do tempo de vida remanescente poderia ajudar os pacientes na concretizac¸˜ao de sonhos. No entanto, este tipo de previs˜ao est´a diretamente relacionada com a experiˆencia do profissional de sa ´ude e da sua capacidade de memorizar.
A maior parte das decis ˜oes s˜ao tomadas com base em probabilidades e estat´ıstica, mas estas tˆem como base grandes grupos de pessoas, podendo n˜ao ser adequadas para prever o que vai acontecer em casos particulares. Por conseguinte, a utilizac¸˜ao de t´ecnicas de machine learning tˆem sido exploradas na ´area da sa ´ude. A sua capacidade para ajudar a resolver problemas de diagn ´ostico e progn ´ostico tem sido cada vez mais explorada.
A principal contribuic¸˜ao deste trabalho ´e uma ferramenta de previs˜ao da sobrevida de pacientes com cancro do c ´olon e/ou do reto, ap ´os o tratamento e alguns anos ap ´os o trata-mento. As caracter´ısticas que a distingue s˜ao o equil´ıbrio entre o n ´umero de entradas necess´arias e o seu desempenho a n´ıvel da previs˜ao. A ferramenta, compat´ıvel com dispos-itivos m ´oveis, possui uma componente de aprendizagem em tempo real que permite recal-cular de forma autom´atica e evolutiva os modelos usados para fazer a previs˜ao, atrav´es da adic¸˜ao de novos casos.
A ferramenta tem como prop ´osito facilitar o acesso dos profissionais de sa ´ude a instru-mentos capazes de enriquecer a sua pr´atica e melhorar os seus resultados. Esta aumenta a produtividade dos profissionais de sa ´ude, permitindo que estes tomem decis ˜oes mais rapidamente e com uma taxa de erro menor.
C O N T E N T S
1 i n t r o d u c t i o n 1
1.1 Preliminary Notions 1
1.1.1 Anatomy and Physiology of the Digestive System 1
1.2 The Colorectal Cancer 3
1.2.1 Incidence 3
1.2.2 Symptomatology and Screening 6
1.2.3 Staging 6
1.3 Motivation 11
1.4 Objectives 12
1.5 Document structure 13
2 s tat e o f t h e a r t 15
2.1 Survivability Prediction Tools 15
2.1.1 For Colon Cancer 15
2.1.2 For Rectal Cancer 22
2.2 Prediction Models 28
2.3 Discussion 33
3 d e v e l o p m e n t o f t h e p r e d i c t i o n m o d e l 37
3.1 Raw Data Importing 37
3.2 Preprocessing 38 3.3 Split Dataset 39 3.4 Feature Selection 40 3.5 Data Sampling 43 3.6 Modeling 43 3.7 Evaluation 45 3.7.1 Cross-validation 45 3.7.2 Testing 46 4 e x p e r i m e n ta l r e s u lt s 47
4.1 Survivability Prediction Models 47
4.1.1 Colon Cancer 47
4.1.2 Rectal Cancer 49
4.2 Conditional Survival Prediction Models 53
4.2.1 Colon Cancer 53
4.2.2 Rectal Cancer 54
Contents 5 d e v e l o p m e n t o f a n a p p l i c at i o n 59 5.1 Requirements Gathering 59 5.1.1 Functional Requirements 60 5.1.2 Non-functional requirements 60 5.2 Architecture 61
5.2.1 Survival Prediction Application 61
5.2.2 Survival Prediction Model Server Application 62
5.2.3 Online Learning Server Application 63
5.3 Interface 63
5.4 Use Case 63
5.4.1 Survivability After Treatment Calculators 63
5.4.2 Conditional Survival Calculators 65
6 c o n c l u s i o n s, publications and future work 69
6.1 Conclusions 69
6.2 Publications 70
6.3 Prospect for future work 70
References 70 a s c r i p t t o p r o c e s s t h e s e e r d ata s e t 81 a.1 C# code 81 b r a p i d m i n e r p r o c e s s e s 91 b.1 Preprocessing Process 91 b.2 Split Dataset 92 b.3 Feature Selection 93 b.4 Sampling Data 93
b.5 Modeling and Evaluation 94
c d e ta i l s o f r e s u lt s 95
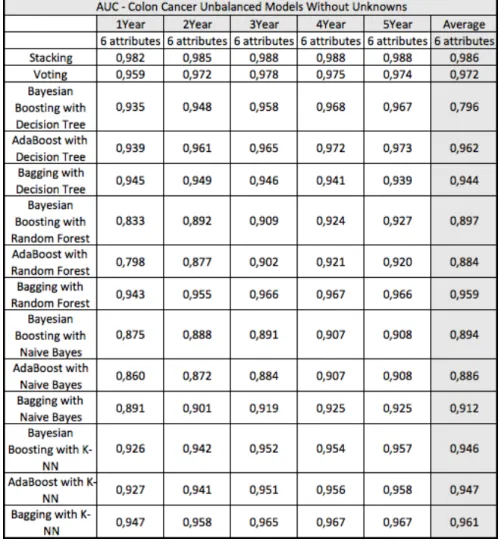
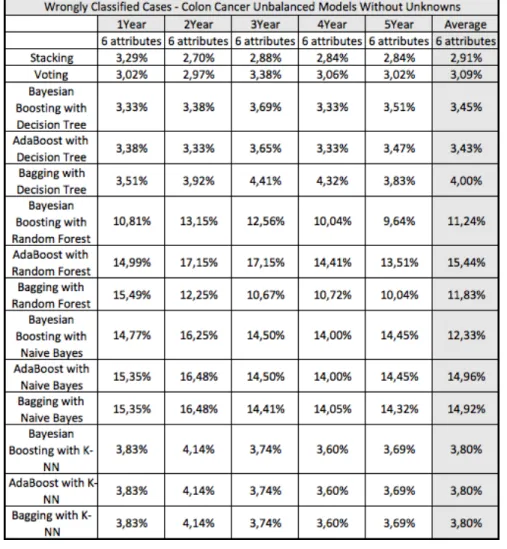
c.1 Survivability Prediction Models 96
c.1.1 Colon Cancer 96
L I S T O F F I G U R E S
Figure 1 Organs of the digestive system [95]. 2
Figure 2 The large intestine [6]. 3
Figure 3 The layers of the bowel wall [1]. 3
Figure 4 Estimated cancer incidence and mortality worldwide in 2012. 4
Figure 5 Estimated cancer age-standardised rates worldwide in 2012. 5
Figure 6 Polyps in the colon:. 6
Figure 7 The degree of invasion of the intestinal wall [15]. 8
Figure 8 Grouping of TNM classification for colorectal cancer. 8
Figure 9 5-Year Relative Survival. 11
Figure 10 Disease-specific Kaplan-Meier lethality by year. 16
Figure 11 Predicting the clinical outcome for CC. 17
Figure 12 Unadjusted AJCC disease-specific survival. 18
Figure 13 Disease-specific and conditional survival for CC. 19
Figure 14 Results of disease-specific and conditional survival for CC. 19
Figure 15 Kaplan-Meier overall survival. 20
Figure 16 Colorectal cancer nomogram: overall survival probability [103]. 21
Figure 17 Results of colorectal cancer nomogram [103]. 21
Figure 18 Web calculator: recurrence and overall survival. 22
Figure 19 Results of the web calculator: recurrence and overall survival. 23
Figure 20 10-year Kaplan–Meier overall survival by stage [102]. 24
Figure 21 Interactive tool – conditional survival. 25
Figure 22 Kaplan-Meier curves of risk group stratification. 26
Figure 23 Nomograms – rectal cancer. 26
Figure 24 Results of the nomograms – rectal cancer. 27
Figure 25 Disease-specific and conditional survival for RC. 28
Figure 26 Results of disease-specific and conditional survival for RC. 29
Figure 27 ANN used in the analysis [89]. 29
Figure 28 Survival plot stratified by pathologic stage 30
Figure 29 From raw data to RapidMiner Studio software. 38
Figure 30 Average survivability percentage accuracy for colon cancer. 48
Figure 31 Average survivability AUC for colon cancer. 49
Figure 32 Average F-measure performance for colon cancer. 50
List of Figures
Figure 34 Average survivability percentage accuracy for rectal cancer 52
Figure 35 Average survivability AUC for rectal cancer. 53
Figure 36 Average F-measure performance for rectal cancer. 54
Figure 37 Average percentage of wrongly classified cases for rectal cancer. 55
Figure 38 Architecture of the developed tool. 61
Figure 39 Home screen and menu of the application. 64
Figure 40 Calculator menus. 65
Figure 41 CC Survivability After Treatment Calculator: smartphone. 66
Figure 42 Error control of application. 67
L I S T O F TA B L E S
Table 1 Recommendations for CRC screening [90]. 7
Table 2 Classification of CRC cancers according to TNM system. 9
Table 3 Anatomic Stage/Prognostic Groups, seventh edition [26,42,35]. 10
Table 4 Comparative performance statistics. 31
Table 5 Class distribution of data [3]. 31
Table 6 Selected Attributes. 32
Table 7 Variables of applications and models for CC patients. 33
Table 8 Characteristics of CC models. 33
Table 9 Variables used in the applications for rectal cancer patients. 34
Table 10 Characteristics of RC models. 34
Table 11 Class distribution for each target label – CC. 39
Table 12 Class distribution for each target label – RC. 39
Table 13 Class distribution for each target label – CC Conditional. 40
Table 14 Class distribution for each target label – RC Conditional. 40
Table 15 Attributes selected in the Feature Selection process for CC. 41
Table 16 Attributes selected in the Feature Selection process for RC. 41
Table 17 Attributes selected by a specialist physician on CC. 42
Table 18 Table of confusion. 45
Table 19 Performance values – CC Conditional. 56
L I S T O F E Q U AT I O N S
1 NAP method: lethality primary. . . 16
2 NAP method: lethality nodes. . . 16
3 NAP method: lethality overall. . . 16
4 Accuracy. . . 46
A C R O N Y M S
A
ACCENT Adjuvant Colon Cancer End Points.
AI Artificial Intelligence.
AIM Artificial Intelligence in Medicine.
AJCC American Joint Committee on Cancer.
ANN Artificial Neural Network.
API Application Programming Interface.
AUC The Area Under the ROC Curve.
C
C-INDEX Concordance Index.
CC Colon Cancer.
CFS Correlation Feature Selection.
CRC Colorectal Cancer.
I
IGR Information Gain Ratio.
M
ML Machine Learning.
ML-BBN Machine-Learned Bayesian Belief Network.
N
NAP Nodes + Prognostic Factors.
Acronyms
R
RC Rectal Cancer.
ROC Receiver Operating Characteristic.
S
SEER Surveillance, Epidemiology, and End Results.
1
I N T R O D U C T I O NHealth care professionals are confronted daily with new diseases, new therapeutics, quick decisions and cost reductions. At the same time, technology has an increasingly important role in answering these challenges by finding new solutions, supporting health care profes-sionals in the course of their duties, assisting with tasks of data and knowledge manipula-tion, testing new treatments, simulating scenarios, and developing new devices.
This dissertation discloses and assistive tool to help physicians improve their practice. The problem it addresses is predicting the survival of Colorectal Cancer (CRC) patients (in an individualized manner). The knowledge upon which the features of the tool are based was drawn from a large volume of collected data from patients.
This chapter provides a deeper understanding about CRC and the motivation, objectives, methodology and research behind this dissertation.
1.1 p r e l i m i na r y n o t i o n s
1.1.1 Anatomy and Physiology of the Digestive System
The cell is the basic unit of life. It is the smallest unit capable of all of the processes that define life. A cell grows and divides into new cells, in order to ensure the proper body functions, replacing worn out or injured cells. If a damaged cell is not repaired or does not die, it continues to grow and forms new abnormal cells. When a cell grows out of control and invades other tissues it is called a cancer cell. These cells can break away and travel to other parts of the body through the bloodstream or the lymph system, growing and forming new tissues there. This spread of cancer to new areas of the body is called metastasis.
The digestive system (Figure 1) consists of the digestive tract and its accessory organs
(such as the teeth), where food is processed into molecules that can be absorbed to give the body cells the energy and other substances they need to operate. The digestive tract, also known as the gastrointestinal tract, consists of a long continuous tube that begins at
Chapter 1. introduction
the mouth, includes the pharynx, esophagus, stomach, small intestine, large intestine, and ends at the anus [7,87].
Figure 1.: Organs of the digestive system [95].
The colon is the most extensive part of the large intestine, also known as bowel. Its function is to absorb water and nutrients from the food matter and to serve as a storage place for waste matter. As shown in Figure 2, the colon has 4 parts. The first section is
the ascending colon. It starts with a small pouch (the cecum), where the small intestine joins the colon, and it extends upward on the right side of the abdomen. The second part is called the transverse colon, as it goes across the body from the right to the left side in the upper abdomen. The third section, called the descending colon, continues downward on the left side. Finally, the fourth and last part is known as the sigmoid colon because for its ”S” or ”sigmoid” shape. After going through the colon, the material that is left is called feces or stool. The material enters the rectum, where it is stored until it is expelled of the body through the anus [6].
The wall of the colon and rectum (Figure 3) is made up of several layers: the mucosa
(or mucous membrane), the submucosa,the muscularis (or muscularis propria), and the adventitia (or serosa). The mucosa is the innermost layer of the digestive tract that is in direct contact with digested food. Its layers are responsible for most of digestion, absorptive and secretory processes, and also for passing waste matter. The submucosa consists in a dense irregular layer of connective tissue that contains fibroblasts, mast cells, blood and lymphatic vessels, and a nerve fiber plexus. The muscular layer is the main responsible for the contractility. It consists of an inner circular layer that prevents food from traveling backward, and a longitudinal outer layer that shortens the tract. Finally, the serosa forms the outermost layer of the gastrointestinal tract. It consists of several layers of connective tissue and secretes a fluid in order to lubricate the surface of the large intestine, defending
1.2. The Colorectal Cancer
Figure 2.: The large intestine [6].
it from the friction between abdominal organs and the surrounding muscles and bones of the trunk [87].
Figure 3.: The layers of the bowel wall [1].
1.2 t h e c o l o r e c ta l c a n c e r
1.2.1 Incidence
The most common cancer of the digestive system is CRC, also known as bowel cancer. It is a term for cancer that starts in the colon or rectum. About 70 percent of the CRC cases occur in the colon and about 30 percent in the rectum [95]. According to the latest worldwide cancer statistics (2012), the CRC is the third most frequent cancer worldwide (Figure 4a) and the fourth deadliest (Figure 4b), for both sexes. Almost 55% of the cases
Chapter 1. introduction
occur in more developed regions. As shown in Figure 5, the highest estimated rates are
in Australia and New Zealand and the lowest are in Western Africa. CRC mortality is low when compared to other cancers (694,000 deaths, 8.5% of the total) and the majority of CRC deaths occurs (52%) in the less developed regions of the world. It is estimated that, in 2020, the world will have 1.7 million new CRC cases and almost 855 thousand CRC deaths [29].
(a)
(b)
Figure 4.: Estimated cancer incidence and mortality worldwide in 2012, for both sexes [29].
Most CRCs begin as a small growth called a polyp (Figure 6). This growth is a benign
tumor and not all can become into cancer. It starts in the inner lining of the colon or rectum and grows toward the center, and this process can take many years. Taking out a polyp early, when it is small, may keep it from becoming cancer [95].
More than 95% of all large bowel tumors are adenocarcinomas (tumors which start in the gland cells in the lining of the bowel wall). The gland cells produce mucus to lubricate the inside of the colon and rectum (that makes it easier for the stool to pass through the bowel). Other rare types include lymphoma and squamous cell carcinoma [1].
1.2. The Colorectal Cancer
Figure 5.: Estimated cancer age-standardised rates worldwide in 2012, per 100.000 people [29].
The exact cause of CRC is unknown. However, at least eight different genes can be traced to dietary fat, particularly animal fat [95].
The risk of CRC increases with age. Individuals with a personal or family history of CRC or polyps, inherited CRC syndromes (i.e., familial adenomatous polyposis and hereditary nonpolyposis CRC), and patients with ulcerative colitis or Crohn’s disease are at higher risk, and thus may require screening at an earlier age than the general population. Modifiable factors associated with increased risk include a diet high in fat and red or processed meat, but low in fiber, low calcium intake, high caloric intake, physical inactivity, and obesity. In addition, smoking and excessive alcohol intake may play a role in CRC development [95,4,57].
Chapter 1. introduction
Figure 6.: Polyps in the colon: some polyps have a stalk and others do not (the photo in the figure shows a polyp with a stalk) [57].
1.2.2 Symptomatology and Screening
Symptoms may include blood seen in the stool (can be bright red or very dark), unex-plained persistent constipation alternating with diarrhea, changes in the diameter of stool, intermittent abdominal pain and the feeling of inadequate emptying of the bowel [95,4,57]. CRC can largely be prevented by the detection and removal of adenomatous polyps (precancerous polyps). From 2006 to 2007, the American Cancer Society, the US Multi So-ciety Task Force on Colorectal Cancer (a consortium representing the American College of Gastroenterology, the American Society of Gastrointestinal Endoscopy, the American Gas-troenterological Association, and the American College of Physicians), and the American College of Radiology came together to develop consensus guidelines for CRC screening. In a range of options for CRC screening, the guidelines distinguish between two general cat-egories, according to current technology: stool tests – which include tests for occult blood or exfoliated DNA – and structural exams – which include flexible sigmoidoscopy (FSIG), colonoscopy, double-contrast barium enema (DCBE), and computed tomographic colonog-raphy (CTC) [51]. The screening tests recommended for CRC screening in men and women aged 50 or older at average risk are summarized in Table1(the complexity involves patient
preparation, inconvenience, facilities and equipment needed, and patient discomfort) [90].
1.2.3 Staging
Cancer staging is the process of finding out how widespread a cancer is, determining how much cancer is in the body and where it is located. Staging describes the severity of a individual’s cancer based on the size and/or extent of the original (primary) tumor
1.2. The Colorectal Cancer
Table 1.: Recommendations for CRC screening [90].
Test Benefits Performance & Complexity Limitations Test Time Interval
Flexible Sigmoidoscopy
Fairly quick; Few complications; Minimal bowel preparation; Minimal discomfort; Does not require sedation or a specialist.
Performance: High for rectum & lower one-third of the colon; Complexity: Intermediate
Views only one-third of colon; Bowel preparation needed; Cannot remove large polyps; Small risk of infection or bowel tear; Slightly more effective when combined with annual fecal occult blood testing; Colonoscopy necessary if abnormalities are detected.
5years
Colonoscopy
Examines entire colon; Can biopsy and remove polyps;
Can diagnose other diseases;
Required for abnormal results from all other tests.
Performance: Highest; Complexity: Highest.
Can miss some polyps and cancers; Full bowel preparation needed; Can be expensive;
Sedation of some kind usually needed, necessitating a chaperone;
Patient may miss a day of work; Highest risk of bowel tears or infections compared to other tests.
10years
Double-contrast Barium Enema
Can usually view entire colon;
Few complications; No sedation needed.
Performance: High; Complexity: High.
Can miss some small polyps and cancers; Full bowel preparation needed; Cannot remove polyps; Exposure to low-dose radiation; Colonoscopy necessary if abnormalities are detected.
5years
Computed Tomographic Colonography
Examines entire colon; Fairly quick; Few complications; No sedation needed; Noninvasive. Performance: High; Complexity: Intermediate.
Can miss some polyps and cancers; Full bowel preparation needed; Cannot remove polyps; Exposure to low-dose radiation; Colonoscopy necessary if abnormalities are detected.
5years
Fecal Occult Blood Test
No bowel preparation; Sampling is done at home; Low cost;
Noninvasive.
Performance: Intermediate for cancer;
Complexity: Lowest.
May require multiple stool samples; Will miss most polyps and some cancers; Higher rate of false-positives than other tests; Pre-test dietary limitations;
Slightly more effective when combined with a flexible
sigmoidoscopy every five years; Colonoscopy necessary if abnormalities are detected.
Annual
Stool DNA Test
No bowel preparation; Sampling is done at home; Requires only a single stool sample; Noninvasive.
Performance: Intermediate for cancer;
Complexity: Low.
Will miss most polyps and some cancers; High cost compared to other stool tests; New technology with uncertain interval between testing; Colonoscopy necessary if abnormalities are detected.
Uncertain
and whether or not cancer has spread in the body [95]. It is performed for diagnostic and research purposes, and to help the doctor plan the appropriate treatment. It also gives a common terminology for evaluating the results of clinical trials and comparing the results of different trials. On the one hand, if the stage is based on the results of the physical exam, biopsy, and any imaging tests, it is called a clinical stage. On the other hand, when it is performed a surgery or biopsy, the results can be combined with the factors used for the clinical stage, determining the pathologic stage. A cancer is always referred to by the stage it was given at diagnosis, even if it gets worse or spreads. The survival statistics and information on treatment by stage for specific cancer types are based on the original cancer stage at diagnosis.
One of the most widely used cancer staging systems is the TNM (for tumors/nodes/metas-tases) system, from the American Joint Committee on Cancer (AJCC). It is based on the size and/or extent of the primary tumor (T) – see Figure 7 –, the amount of spread to nearby
lymph nodes (N), and the presence of metastasis (M) or secondary tumors formed by the spread of cancer cells to other parts of the body. The TNM system assigns a number to
Chapter 1. introduction
each letter to indicate the size and/or extent of the primary tumor and the degree of cancer spread. It is worth noting that each cancer type has its own classification system: letters and numbers do not always mean the same thing for every kind of cancer. Table2 shows
all the definitions for T, N, and M.
Figure 7.: The degree of invasion of the intestinal wall [15].
By combining the TNM information, it is possible to obtain an overall “Stage”. It is expressed in roman numerals: from stage 0 (the least advanced) to stage IV (the most ad-vanced), as shown in Figure8. These stages can be subdivided using letters, as for instance
IIIA and IIIB.
Figure 8.: Grouping of TNM classification for colorectal cancer.
In addition to the TNM staging system, there are other common staging schemes in use. The Dukes’ staging classification was originally published by Cuthbert E. Dukes in 1932 for rectal cancer only and does not include distant metastases. In 1949 it was adapted by Kirklin and later (in 1953) by Astler and Coller for colon and rectum. To include stage for unre-sectable tumors and distant metastases, it was revised by Turnbull in 1967. Astler-Coller
1.2. The Colorectal Cancer
Table 2.: Classification of colorectal cancers according to local invasion depth (T stage), lymph node involvement (N stage), and presence of distant metastases (M stage) [26].
Primary Tumor (T) TX Primary tumor cannot be assessed
T0 No evidence of primary tumor
Tis Carcinoma in situ: intraepithelial or invasion of lamina propria T1 Tumor invades submucosa
T2 Tumor invades muscularis propria
T3 Tumor invades through the muscularis propria into the pericolorectal tissues T4a Tumor penetrates to the surface of the visceral peritoneum
T4b Tumor directly invades or is adherent to other organs or structures Regional Lymph Nodes (N)
NX Regional lymph nodes cannot be assessed N0 No regional lymph node metastasis N1 Metastasis in 1-3 regional lymph nodes N1a Metastasis in one regional lymph node N1b Metastasis in 2-3 regional lymph nodes
N1c Tumor deposit(s) in the subserosa, mesentery, or nonperitonealized pericolic or perirectal tissues without regional nodal metastasis N2 Metastasis in four or more regional lymph nodes
N2a Metastasis in 4-6 regional lymph nodes
N2b Metastasis in seven or more regional lymph nodes Distant Metastasis (M) M0 No distant metastasis
M1 Distant metastasis
M1a Metastasis confined to one organ or site (eg, liver, lung, ovary, nonregional node)
M1b Metastases in more than one organ/site or the peritoneum
and Turnbull stagings are also sometimes called Dukes or modified Astler-Coller (MAC) [95]. It is possible to observe in Table 3that these staging systems and the correspondence
between them.
Treatment for CRC depends on several factors, including the type and stage of cancer. Early stages of CRC are often treated with surgery – 95% of Stage I and 65-80% of Stage II –, extracting the cancer from the colon, rectum or even in other organs in the body where the cancer has spread to. Radiation therapy, i.e., applying high-energy x-rays to destroy cancer cells, may be required to minimize the recurrence risk in rectal cancer. Other types of treatment that are often used are chemotherapy or targeted therapy. Chemotherapy is a type of cancer treatment that uses medication (chemicals) to neutralize cancer cells, usually by stopping the ability that cancer cells have to grow and divide. These chemicals can be
Chapter 1. introduction
Table 3.: Anatomic Stage/Prognostic Groups, seventh edition [26,42,35].
Stage T N M Dukes MAC
0 Tis N0 M0 - -I T1 N0 M0 A A T2 N0 M0 A B1 IIA T3 N0 M0 B B2 IIB T4a N0 M0 B B2 IIC T4b N0 M0 B B3 IIIA T1-T2 N1/N1c M0 C C1 T1 N2a M0 C C1 IIIB T3-T4a N1/N1c M0 C C2 T2-T3 N2a M0 C C1/C2 T1-T2 N2b M0 C C1
IIIC T4a N2a M0 C C2
T3-T4a N2b M0 C C2
T4b N1-N2 M0 C C3
IVA Any T Any N M1a D D
IVB Any T Any N M1b D D
injected into a vein or given by mouth, injected directly into an artery leading to a part of the body containing a tumor or can even given directly into the hepatic artery. Targeted therapy is also a treatment that uses drugs. However, it is different from traditional chemotherapy. This treatment has as targets the specific genes of the cancer, proteins, or surrounding tissues that contribute to the cancer growth and survival. Targeted therapy typically has less severe side effects. It could be used either along with chemotherapy or by itself, if chemotherapy is no longer working. Depending on the stage of the cancer, two or more types of therapy may be combined at the same time or used sequentially. When cancer has spread away from the original tumour site (stage IV), most often it cannot be cured. However, the cancer may be treatable and its growth and symptoms could be managed [90].
Based on largest population-based cancer registry in the United States, the Surveillance, Epidemiology, and End Results (SEER) database – provided by the National Cancer Institute –, from 2005 to 2011, the five- and ten-year relative survival rates, i.e., statistics that compare the survival of patients diagnosed with CRC with the survival of people in the general population (with the same age, race, and sex and who have not been diagnosed with cancer), are 65% and 58%, respectively. Survival rates for CRC depend on multiple factors, they often include the stage (Figuer 9). When CRC is detected at a localized stage (cancer is
only in the part of the body where it started), the five-year survival is 90.1%. If the cancer has spread to a different part of the body, to nearby organs or lymph nodes, the five-year survival drops to 71%. If the disease has spread to distant organs, the five-year survival
1.3. Motivation
rate is 13%. The five-year survival rate for patients who have just one or a few tumors that have spread (for instance, to the lung or liver), can be improved if surgical removal of these tumors is able to eliminate the cancer [4].
Figure 9.: 5-Year Relative Survival (from SEER 18 2005-2011, All Races, Both Sexes by SEER Summary Stage 2000).
1.3 m o t i vat i o n
The term Artificial Intelligence (AI) was coined be Jon McCarthy in 1956. He defined it as “the science and engineering of making intelligent machines” at a conference at the campus of Dartmouth College. This science, when used in medical applications, is called Artificial Intelligence in Medicine (AIM). The earliest work in AIM dates to 15 years after AI was founded [66,93]. Called “The DENDRAL Project”, it was a cooperative work, which brought together computer scientists, chemists, geneticists and philosophers of science, to show the capacity to represent and apply expert knowledge in symbolic form [53].
The ability to learn is viewed as the typical characteristic of an intelligent being. Conse-quently, to develop devices that can get skills from experiences has been one of the driving ambitions of AI. Machine Learning (ML) is another core part of AI. Its developments have resulted in a set of techniques which have the potential to alter the way in which knowledge is created [20,62].
Data mining is defined as the automatic search, in large amounts of data, for patterns. It is also known as knowledge-discovery in databases and uses computational techniques from statistics, ML and pattern recognition.
Medicine is the practice of the diagnosis, treatment and prevention of disease, and the promotion of health. It is a critical area where the time can be crucial. For shortage of time, most medical decisions are based on quick judgments and depend on the memory
Chapter 1. introduction
of the physician [93]. Training and recertification procedures may improve the physician skills, encouraging him to keep more of the relevant information in mind [23, 24]. How-ever, fundamental limitations of human memory and recall mechanisms, coupled with the exponential growth in knowledge, mean that most of what is known cannot be seized by most individuals. To overcome this situation, by helping to organize, store, and retrieve ap-propriate medical knowledge needed, some new areas emerged, namely eHealth, Clinical Decision Support Systems, Computer-Interpretable Guidelines and Reasoning under Un-certainty [63,61,52]. Some of these technologies are able to suggest appropriate diagnostic, prognostic and therapeutic decisions.
Accurate prediction of survival is one of the most interesting and challenging tasks for physicians and it is important for various purposes, such as medical decision making, pa-tient counselling and benchmarking [49, 99,16]. The level of physician experience to esti-mate the survival might affect how prognostic is formulated. However, even an experienced oncologist has difficulty to predict accurately survival time of a patient with cancer [94].
Survival statistics could help estimate the prognosis of patients, but they are based on large groups of people, they cannot be used to predict exactly what will happen to an individual patient [58]. Kaplan-Meier is one of most frequently used method in the conven-tional analysis of survival problems [99]. It is the simplest way of computing the survival over time, can be calculated for two groups of subjects and it involves the computing of probabilities of occurrence of event (death) at a certain point of time [34].
In order to exploit the implied knowledge in large clinical datasets, some sophisticated modeling in AI approaches to medical reasoning have been exploited through ML tech-niques [93]. These techniques have competence to discover and identify patterns and the relationships between them, from complex datasets [49]. Based on this, herein the develop-ment of a survival prediction model is proposed for CRC patients. To develop the predic-tion model, ML will be used to discover the relapredic-tionships between the different variables and their weights in survival prediction. Approaching of the mobile health (mHealth), the model will be available in different platforms (smartphones and tablets) and it will target health care professionals. The developed tool will employ current technologies related with web development, ubiquitous computing and intelligent interfaces.
1.4 o b j e c t i v e s
This dissertation project has the main goal of developing a model to predict the survival of patients with colon and rectal cancer. Several points were delineated to achieve an appropriate solution able to help physicians improve their practice, such as:
1. Employ machine learning techniques to process the collected information of CRC patients from a database;
1.5. Document structure
2. Construct an accurate model able to predict the survival at 1-, 2-, 3-, 4- and 5-years after the diagnosis and treatment;
3. Construct an accurate model able to predict the conditional survival at patients who had already survived at 1-, 2-, 3- and 4-years after the diagnosis and treatment;
4. Find the most relevant features to construct the models through a feature selection process by a software;
5. Compare the features selected by a software with the features that physicians consider most relevant;
6. Ascertain whether characteristics used to predict the survival for colon and rectal cancer patients are the same;
7. Determine if the existing models are effective and are available to health care profes-sionals to evaluate the developed models;
8. Develop a cross platform mobile to make available the models to health care profes-sionals;
9. Construct an online learning service to recalculate the models after several entries in the application.
1.5 d o c u m e n t s t r u c t u r e
The present work is constituted by six chapters, structured as follows:
INTRODUCTION In the first chapter are introduced important concepts to the comprehen-sion of all the work. Is made a description of the disease and the work is framed. The motivation, objectives and document structure are presented.
STATE OF THE ART The second chapter contains the actual solutions for prediction of surviv-ability in colorectal cancer patients. It presents the survivsurviv-ability prediction tools, for colon and rectal cancer, and prediction models which are not available in any form to users. A discussion of the state of the art is made at the end.
DEVELOPMENT OF THE PREDICTION MODEL The third chapter, is the main chapter of the dis-sertation. It describes all the processes of development of the prediction model, from the raw data to modeling and evaluation, including the testing phase.
EXPERIMENTAL RESULTS The fourth chapter reveals the results from the development of the prediction model. All the developed survival and conditional survival models, for
Chapter 1. introduction
colon and rectal cancer patients, are compared using metrics and the best models are selected to embed a prediction tool. A discussion is made at the end of the chapter.
DEVELOPMENT OF AN APPLICATION The fifth chapter describes the processes of development of an application, in order to make available the models to physicians. The gathering of functionals requirements and non-functionals requirements is made. Also, the architecture and the interface of the tool is shown and a use case is made.
CONCLUSIONS AND FUTURE WORK Finally, the sixth and last chapter of this dissertation syn-thesizes all the accomplished work and the main conclusions from it. A prospect for future work is mentioned.
2
S TAT E O F T H E A R TIn this chapter the most relevant related work within the context of this thesis is presented. It is separated in two main sections: one for Colon Cancer (CC) and another for Rectal Cancer (RC). In each of the main sections a review of the current tools to predict the survival in patients with CC or RC is made. In the section regarding colon cancer, are also reported some survival models developed, for these cancers, which are not available in any form to users. Ultimately, in a third section, is made a discussion of the state of the art.
2.1 s u r v i va b i l i t y p r e d i c t i o n t o o l s
2.1.1 For Colon Cancer
Bush and Michaelson (2009)
The CancerMath.net group – a section of the Laboratory for Quantitative Medicine from Massachusetts – developed a series of web-based calculators1
for accurately predicting the clinical outcome for individual cancer patients. These tools are available for melanoma, breast, renal, colon, head and neck cancers.
The CC outcome calculator is a work in progress and it was reported by Bush and Michaelson [14]. This tool provides information on survival expectation at the time of diagnosis, for each of the first 15 years after diagnosis. Also provided is the life expectancy with and without cancer, and the reduction of life expectancy caused by cancer.
The data used to developed the CC tool was extracted from the SEER dataset, from 1973 to 2006.
The variables used to construct the model were: the age of the patient at diagnosis, gender (male or female), tumor diameter (in cm), number of positive nodes, carcinoembry-onic antigen (CEA)2
status (positive or negative), histological type, grade (well differenti-ated, moderately differentidifferenti-ated, poorly differentiated or undifferentiated), site (region of
1 This tool is available athttp://www.lifemath.net/cancer/coloncancer/outcome/index.php.
2 CEA is a glycoprotein and is used as a tumor marker. In increased large are associated with adenocarcinoma, especially colorectal cancer.
Chapter 2. state of the art
the colon) and farthest tumor extension. Through the information of farthest tumor exten-sion and number of positive nodes, this tool can provide the TNM classification and AJCC stage group.
Nodes + Prognostic Factors (NAP) method was created to more accurately model the CC lethality based on the number of positive nodes, combined with prognostic factors. The NAP method is written below, in equations (1), (2) and (3). The prognostic factors are
represented by(g1, g2, g3, . . . , gn). Q, R and jprimary are empirically derived constants.
Lprimary =1−e(−Q∗(g1∗g2∗g3∗. . .∗gn)∗jprimary) (1)
Lnodes=1−e(−R∗(# positive nodes)) (2)
Loverall =Lprimary+Lnodes–(Lprimary∗Lnodes) (3)
For the CC model, the jprimary constant of 0.61299589 was only applied to tumors with zero known positive nodes. For tumors with any positive nodes, or unknown positive nodes, the jprimary is 1.
Figure10 shows that the 3-, 5- and 15-year Kaplan-Meier disease-specific death rates. It
shows an approximately 25% reduction in deaths, from the 1970s to 2003.
Figure 10.: Disease-specific Kaplan-Meier lethality by year (from 1973 to 2003) [14].
The interface of this tool is shown in Figure11. No performance results are known for
2.1. Survivability Prediction Tools
Figure 11.: Web-based calculators for accurately predicting the clinical outcome for individ-ual colon cancer patients and results [13].
Chang et al. (2009)
From The University of Texas M. D. Anderson Cancer Center, Chang et al. [18] created a browser-based calculator3
to predict individualized disease-specific survival and condi-tional survival4
.
By utilizing data from the SEER registry, 83,419 patients with colon adenocarcinoma diagnosed between 1988 and 2000 were analyzed.
The variables used to develop the model were: age of the patient at diagnosis (categorized into age less than 50 years, 50 to 59 years, 60 to 69 years, 70 to 79 years and ≥ 80 years), gender (male or female), ethnicity (white, black or other), tumor grade (well differentiated, moderately differentiated, and poorly differentiated or undifferentiated) and AJCC sixth edition stage group. The inclusion of the SEER region, year of diagnosis, marital status
3 The browser-based conditional survival calculator is available athttp://www3.mdanderson.org/coloncalculator. 4 The survival probability calculated after a given length of survival, including only individuals who have
Chapter 2. state of the art
and tumor location was also tested, but these features did not improve model performance or prediction accuracy. A multivariate Cox regression analysis was performed by using the Breslow method for ties to evaluate the simultaneous effect of multiple variables on survival.
The Kaplan-Meier unadjusted (10-year) disease-specific survival probabilities for patients diagnosed with CC stratified by AJCC stage (sixth edition) is shown in Figure12.
Figure 12.: Unadjusted AJCC disease-specific survival for patients with CC who were diag-nosed between 1988 and 2000 [18].
The conditional survival was applied to obtain a more accurate survival probability. It is utilized especially when the initial prognosis is poor. Conditional survival estimates were calculated by using the multiplicative law of probability after adjustment for variables. The Concordance Index (C-index) of this implementation was 0.816.
Figure13shows the interface of this tool and Figure14shows the results.
Weiser et al. (2011)
From Memorial Sloan Kettering Cancer Center, Weiser et al. [104] developed a tool5 with the ability to predict the overall survival probability of the CC patient at least five years following surgical removal of all cancerous tissue.
The tool can produce three different estimates based on the amount of data included, and the accuracy increases with the amount of submitting information. For that purpose, three nomograms using multivariable regression with Cox proportional hazards modeling were created. This tool also provides a highly likely range for the probability of survival, known as the 95% confidence interval.
2.1. Survivability Prediction Tools
Figure 13.: Browser-based calculator to predict individualized disease-specific survival and conditional survival for colon cancer patients [17].
Figure 14.: Results of the browser-based calculator to predict individualized disease-specific survival and conditional survival for colon cancer patients [17].
To construct and validate the three survival models the records from 128,853 primary colon cancer patients reported to the SEER from 1994 to 2005 were applied.
For a basic estimate of overall survival probability it is necessary to know the depth of tumor penetration into the colon wall (T stage) and the N stage, according to the TNM anatomic staging system, introduced in Section1.1. For a more accurate estimate, it is
nec-essary to know T stage, the number of positive lymph nodes (value between 0 and 16) and the number of total lymph nodes (value between 0 and 45). For the most accurate estimate, in addition to the data required in the previous accurate estimate, it vital know the age of the patient at the time of surgery, gender (male or female) and tumor differentiation/grade (poor, moderate or well differentiated).
Chapter 2. state of the art *
All these variables were chosen a priori on the basis of their well-established independent associations with overall survival and their availability in the SEER registry.
Kaplan-Meier overall survival curves for the entire population, according to the AJCC classification schema (seventh edition), are shown in Figure15.
Figure 15.: Kaplan-Meier overall survival on the basis of the seventh edition of the AJCC Staging Manual [104].
The simplest nomogram, based only on T and N elements, presented the minor C-index, with 0.61 (95% CI, 0.60 to 0.62). It was followed by the model that includes the number of lymph nodes examined and number of metastatic lymph nodes examined, with 0.63 (95% CI, 0.62 to 0.64). Finally, the highest C-index belongs to the model including the pathologic tumor differentiation and demographic variables of age and gender, with 0.68 (95% CI, 0.67 to 0.68). The Receiver Operating Characteristic (ROC) curves for the extended model had higher sensitivity, at all values of specificity, than the TNM system and calibration curves indicated no deviation from the reference line.
The interface of this tool is shown in Figure16and the results in Figure17.
Renfro et al. (2014)
From Mayo Clinic, Renfro et al. [86] created a clinical calculator6for overall survival and time to recurrence for stage III colon cancer. It was developed in order to obtain predicted probabilities of being recurrence-free at three years and alive at five years over the start of treatment, with confidence intervals.
Multivariable Cox proportional hazards models for overall survival and time to recur-rence were formulated using data from 15,936 stage III CC patients. These data were
col-6 This clinical calculator is available for use at
2.1. Survivability Prediction Tools
Figure 16.: Colorectal cancer nomogram: overall survival probability [103].
Figure 17.: Results of colorectal cancer nomogram [103].
lected from 12 randomized clinical trials, from 1989 to 2002, contained in the Adjuvant Colon Cancer End Points (ACCENT) database.
Models were constructed using variables such as the age (as continuous variable), sex (male or female), race (white, black, asian, or other), body mass index (as a continuous variable), Eastern Cooperative Oncology Group/World Health Organisation performance
Chapter 2. state of the art
(a) Patient characteristics: first screen. (b) Patient characteristics: second screen.
Figure 18.: Web calculator to predict recurrence and overall survival in stage III colon cancer [85].
status scale7
[60] (0, 1, 2+), tumor grade (1, 2, 3+), tumor stage (T-stage; T1, T2, T3, T4), ratio of the number of positive lymph nodes to the number of nodes examined (as continuous variable, between 0 and 1), number and location of primary tumors (any multiple, single left, single right, or single transverse/flexures), and treatment class (oral/infusional/bolus 5FU variations vs 5FU with oxaliplatin vs 5FU with irinotecan).
Model for overall survival had a C-index of 0.66. Figure 18 shows the interface of this
tool and Figure19its results.
2.1.2 For Rectal Cancer
Wang et al. (2011)
From the OHSU Knight Cancer Institute, Wang et al. [102] developed an interactive tool8 to make an individualized prediction of the conditional survival for a RC patient, after a certain period of time passed since diagnosis and treatment.
7 Scale developed by the Eastern Cooperative Oncology Group (ECOG), part of the ECOG-ACRIN Cancer Re-search Group. It describes a patient’s level of functioning in terms of their ability to care for themself, daily activity, and physical ability (walking, working, etc.).
2.1. Survivability Prediction Tools
Figure 19.: Results of the web calculator to predict recurrence and overall survival in stage III colon cancer [85].
The prediction calculator was constructed based on data from 42,830 RC patients who were diagnosed between 1994-2003, from the SEER 17 database. Conditional survival pre-diction is calculated from a Cox proportional hazards model.
The primary outcome variable was overall survival conditional on having survived up to 5 years from diagnosis. Covariates included in the model were age (as a continuous variable), race (white, black, Asian/Pacific Islander, Alaskan/American Indian), sex, and stage (AJCC TNM grouped stage from third edition).
The 10-year actuarial survival data (Figure20) were used to calculate the 5-year observed
conditional survival in categories of stage, age, gender, and race.
The C-indexfor the model of this approach was 0.75. Figure21shows a screenshot of this
interactive web-based prediction tool.
Valentini et al. (2011)
From the MAASTRO Clinic, Valentini et al. [98] developed nomograms9 as a tool to predict the probability that a rectal cancer patient will be alive or will have local recurrence or distant metastasis after delivery of long-course radiotherapy, with optional concomitant and/or adjuvant chemotherapy, over a 5-year period after surgery.
Based on Cox regression, multivariate nomograms were developed. They were built based on 2,795 individual patient data collected from five European randomized trials10
that tested preoperative chemoradiotherapy against preoperative radiotherapy or postoperative chemoradiotherapy and adjuvant chemotherapy, between 1992 to 2003.
9 This prediction calculator is available athttp://www.predictcancer.org/.
10 Trial name: European Organisation for Research and Treatment of Cancer, F´ed´eration Francophone de Canc´erologie Digestive, Working Group of Surgical Oncology/Working Group of Radiation Oncology/Working Group of Medical Oncology of the Germany Cancer Society, Polish and Italian.
Chapter 2. state of the art
Figure 20.: 10-year Kaplan–Meier overall survival by stage [102].
Training the Cox model (training data), important predictors for outcome and the vari-ables that have a significant effect, were selected. The required information for the overall survival calculator was gender (male or female), age at the date of randomization (as a continuous variable), clinical tumor stage (1+2, 3 or 4), radiotherapy dose (<45 Gy, 45 Gy, and > 45 Gy), surgery procedure (low anterior resection [LAR] or abdominoperineal re-section [APR]), adjuvant chemotherapy (yes/no), pathological tumor and nodal stage. The concomittant chemotherapy (yes/no) is used to calculate the local recurrence. However, it must be inserted, even for overall survival prediction, because it is a field required for the tool.
Kaplan-Meier curves of risk group stratification for overall survival for dataset validation can be observed in Figure22.
The nomogram for overall survival had a C-index of 0.70 (95% CI, 0.65 to 0.74). Figure
23shows the interface of this tool and Figure24exemplifies the results provided by it.
The results of this tool – for instance, the result obtained for a female, 55 years old, with clinical tumor stage of 3, radiotherapy dose of 45 Gy, no concomittant chemotherapy, low anterior resection as surgery procedure, no adjuvant chemotherapy, 3 for pathological tumor stage and 1 for pathological nodal stage –, can be interpreted as would be if a group of 100 patients with the same characteristics as this individual patient, 67 patients would have no local recurrence, 50 patients would have no distant metastases, 63 patients would be alive 5 years after the treatment. Due to the fact that a model can never be completely the same as the “real world”, these numbers could be lower or higher, but these are the most likely values. This particular patient has a high risk of developing a local recurrence,
2.1. Survivability Prediction Tools
Figure 21.: Interactive tool for individualized estimation of conditional survival in rectal cancer and its results [101].
high risk of developing distant metastases and a high risk of dying within 5 years after treatment.
Bowles et al. (2013)
From The University of Texas M. D. Anderson Cancer Center, Bowles et al. [10] created an internet-based individualized conditional survival calculator11
for patients with RC. Taking into account the simultaneous effect of multiple variables on survival, separate multivariate Cox regression models were built for: no radiotherapy, preoperative radio-therapy, postoperative radiotherapy and stage IV patients. These models were created to
Chapter 2. state of the art
Figure 22.: Kaplan-Meier curves of risk group stratification for overall survival for valida-tion dataset [98].
Figure 23.: Nomograms for predicting local recurrence, distant metastases, and overall sur-vival for patients with locally advanced rectal cancer [97].
2.1. Survivability Prediction Tools
Figure 24.: Results of the nomograms for predicting local recurrence, distant metastases, and overall survival for patients with locally advanced rectal cancer [97].
determine adjusted survival estimates (at year 1 through 10) and used to calculate 5-year adjusted conditional survival. They were constructed using registries of 22,610 patients with rectal adenocarcinoma, who were diagnosed from January 1988 to December 2002, from the SEER database.
Chapter 2. state of the art
Models developed for patients with localized stage (stage I-III), i.e., for patients who un-derwent no radiotherapy, preoperative radiotherapy or postoperative radiotherapy, covari-ates were the same. They included age (<50, 50-59, 60-69, 70-79, 80+), sex (male, female), race (white, black, other), tumor grade (low [well-differentiated, moderately-differentiated], high [poorly-differentiated or undifferentiated] or unknown), surgery type (local excision and radical surgery) and AJCC sixth edition stage. In the model built for stage IV patients, i.e., for patients with distant metastasis, the surgery type was treated as a binary variable in the model (using any radiotherapy or primary tumor directed surgery as covariates).
The measures of performance for this tool are not available. Figure25shows the interface
of this tool and Figure 26 its results for no radiotherapy. The other models are available
clicking on the links shown in the figure.
Figure 25.: Browser-based calculator to predict individualized disease-specific survival and conditional survival for rectal cancer patients [9].
2.2 p r e d i c t i o n m o d e l s
Snow et al. (2001)
Snow et al. [89] developed an Artificial Neural Network (ANN) model and a regression-based model to predict individual patient survival status 5 years after treatment.
Both models were developed employing 37,500 registries of colon carcinoma patients, from the National Cancer Data Base (NCDB), United Kingdom. The data used were collected from 1985 to 1993.
2.2. Prediction Models
Figure 26.: Results of the browser-based calculator to predict individualized disease-specific survival and conditional survival for rectal cancer patients [9].
ANNs were applied to select the more important variables from the NCDB. This method was chosen in virtue of the ANN abilities to find patterns in complex data, with many variables. The logistic regression was used because of its widespread acceptance by bio-statistians as a standard for prediction. Both methods were compared on a prospective set of patients that were not included in model development.
A sensitivity analysis method was used and the variables that resulted in significant loss of accuracy were dropped. As a result, the gender, age, number of positive regional lymph nodes, number of regional lymph nodes examined, pathologic T, N and M code of TNM, pathologic AJCC stage group, residual tumor (none, microscopic or macroscopic), if surgery was performed and if radiation therapy was performed were the selected variables to incorporate in the model. Figure27shows the ANN used in this analysis.
Chapter 2. state of the art
Figure28shows the survival stratified by pathologic Dukes stage in the NCDB database.
The survival plot is a Kaplan–Meier type and uses a Cox model.
Figure 28.: Survival plot stratified by pathologic stage. Letters A, B, C, and D refer to Dukes Stages [89].
The area under the ROC curve was used to measure the overall predictive accuracy of the network. The ANN yielded a ROC area of 87.6%. A sensitivity to mortality of 95%, the specificity was 41%. The logistic regression provided a ROC area of 82%, and sensitivity to mortality of 95% gave a specificity of only 27%.
Stojadinovic et al. (2012)
Stojadinovic et al. [92] created a clinical decision support system using a Machine-Learned Bayesian Belief Network (ML-BBN) model for real-time estimation of overall survival in CC, providing personalized estimates of survival among patients.
A ML-BBN is a hierarchical network of associations between clinical factors in a registry data set that supplies multivariate mapping of complex data, allowing users to understand how different features are conditionally independent of each other [92,91]. ML technology was employed because of its capability to capture complex, nonlinear, and in some cases, non-obvious patterns in a very large and heterogeneous data set.
The ML-BBN was constructed based on data from 146,248 records of patients with CC diagnosed between 1969 and 2006, from the SEER registry. From each registry independent prognostic factors were analyzed, including age and race of patient, the primary histology, grade and location of tumor. The number of primaries, AJCC T stage, N stage, and M stage were also considered.
Survival cohorts were developed based on follow-up time and overall survival time. To evaluate overall survival at different clinically relevant time points 4 subsets were created based on follow-up times of 12, 24, 36, and 60 months.
2.2. Prediction Models
Models were compared with one another and with the AJCC TNM system by calculating a C-index, performing calibration, and identifying the area under ROC curves. Table 4
details these results. To validate the models, a Kaplan-Meier analysis was performed us-ing the estimated mortality probabilities produced by the BBN as an additional validation method.
Table 4.: Comparative performance statistics – AJCC TNM Staging (Sixth Edition) vs. ML-BBN [92].
Mortality AUC PPV NPV Sensitivity Specificity
AJCC BBN AJCC BBN AJCC BBN AJCC BBN AJCC BBN
12months 0.75 0.85 36.2 % 74.4 % 88.7 % 85.1 % 36.2 % 51.4 % 88.6 % 94.0 % 24months 0.76 0.85 54.6 % 79.9 % 81.1 % 79.7 % 54.6 % 62.7 % 81.1 % 90.3 % 36months 0.77 0.85 67.7 % 81.8 % 72.2 % 73.9 % 67.7 % 69.9 % 72.2 % 84.5 % 60months 0.77 0.85 85.9 % 84.2 % 47.7 % 64.8 % 85.9 % 88.7 % 47.7 % 55.5 %
The results showed that when compared with the AJCC staging system alone, these ML-BBN models showed superior sensitivity and specificity in estimating mortality. The larger area under the ROC curves (0.85) of the models shows that the ML-BBNs have a better discriminatory capacity in estimating survival within a defined period following initial cancer treatment. The large areas under the ROC curves were further confirmed using Kaplan-Meier (log rank) analysis that shows high, statistically significant odds ratios.
Al-bahrani et al. (2013)
Al-bahrani et al. [3] developed a survival prediction model for colon cancer, using en-semble data mining. In this work, supervised classification methods were used to predict survival of patients, at the end of 1 year, 2 years and 5 years of diagnosis.
The SEER data from 1973 to 2009 was analyzed and passed for a cleanup process, in a total of 105,133 registries. The original dataset with 134 attributes was reduced to 65, by removing useless attributes. Three new classes were created for 1 year, 2 years and 5 years survivability. This distribution of the data is shown in Table 5. After the cleanup process,
there were a total of 65 attributes plus the class.
Table 5.: Class distribution of data [3]. Survival Classes 1Year 2Year 5Year Not Survived 21.44% 30.44% 42.06% Survived 78.56% 69.56% 57.94%
Chapter 2. state of the art
From the 65 attributes, a selection of attributes was performed using Correlation Feature Selection (CFS) [36] and Information Gain Ratio (IGR), yielding 13 attributes. These selected attributes and their description can be observed in Table6.
Table 6.: Selected Attributes.
Attribute Description
EOD-Extension Documented tumor away from the primary site SEER modified AJCC Stage
3rd ed (1988-2003)
The modified version stages cases that would be unstaged under strict AJCC staging rules
Birth Place Place of birth encoded
EOD-Lymph Node Involv Highest specific lymph node chain that is involved by the tumor Regional Nodes Positive Number of regional lymph nodes examined
RX Summ-Surg Prim Site Surgical procedure for remove and/or destroy tissue
Histologic Type ICD-O-3 Microscopic composition of cells and/or tissue for a specific primary Reason for no surgery Reason that surgery was not performed on the primary site
Age at diagnosis Age of the patient at diagnosis
Diagnostic Confirmation The best method used to confirm the presence of the cancer EOD-Tumor Size Largest dimension of the primary tumor (millimeters) Behavior (92-00) ICD-O-2 Behavior codes of the cancer
Primary Site The site in which the primary tumor was originated
The approach compares a model using the 65 attributes, acquired after filtering the data and removing the useless attributes, with another model using the 13 selected attributes which were obtained after running feature selection methods. As shown in Table 5, the
dataset was imbalanced. Consequently, in the 13 selected attributes the Synthetic Minority Over-sampling Technique (SMOTE) was applied to generate synthetic examples by oversam-pling the minority class and introducing new synthetic patient records. The data that re-sulted of this process were used to construct another model, which was also compared with the previous developed models.
The WEKA toolkit was used to construct the models for survival prediction for colon cancer patients. Different basic and meta classification schemes were tested. The basic classification algorithms used were the J48 decision tree [69], REPTree [105], Random For-est [12], ADTree [30] and Logistic Regression [33]. In order to boost the basic classifiers and improve their performance, the following meta classifiers were used: Bagging [12], AdaBoost [32], Random Subspace [39] and Voting12 [46].
The ensemble voting, composed by the top 3 performing classification schemes, was the best model. It had a predictive percentage accuracy of 90.38%, 88.01%, and 85.13% for 1 year, 2 years, and 5 years respectively and an area under the ROC curve of 0.96, 0.95, and 0.92 for 1 year, 2 years, and 5 years respectively.
2.3. Discussion
2.3 d i s c u s s i o n
Throughout the chapter of the state of the art, several models to predict the survival of colorectal cancer patients were found. Some of them are available to physicians and patients in a web-based tool.
Table7shows the variables used in the applications and models to calculate the survival
of CC patients.
Table 7.: Variables used in the applications and models for colon cancer patients.
Applications Models
Bush and Michaelson (2009) [14] Chang et al. (2009) [18] Weiser et al. (2011) [104] Renfro et al. (2014) [86] Snow et al. (2001) [89] Stojadinovic et al. (2012) [92] Al-bahrani et al. (2013) [3] Age 3 3 3 3 3 3 3 Gender 3 3 3 3 3 5 5 Grade 3 3 3 3 5 3 5
Stage 5 grouped stage T- and N-stage T-stage TNM and grouped stage TNM grouped stage
CEA status 3 5 5 5 5 5 5
Race 5 3 5 3 5 3 5
Number of positive nodes 3 5 3 3 3 5 3
Total number of nodes 5 5 3 3 3 5 5
Tumor diameter 3 5 5 5 5 5 3
Histological type 3 5 5 5 5 3 3
Site of the colon 3 5 5 3 5 3 3
Surgery 5 5 5 5 3 5 3 Radiation therapy 5 5 5 5 3 5 5 Residual tumor 5 5 5 5 3 5 5 Number of primaries 5 5 5 3 5 3 5 Extension of tumor 3 5 5 5 5 5 3 Birth place 5 5 5 5 5 5 3
Lymph node involved† 5 5 5 5 5 5 3
Reason for no surgery 5 5 5 5 5 5 3
Diagnostic confirmation 5 5 5 5 5 5 3
Behavior 5 5 5 5 5 5 3
Body mass index 5 5 5 3 5 5 5
Treatment type 5 5 5 3 5 5 5
Performance status 5 5 5 3 5 5 5
† Contained in TNM stage.
Table 8 shows the overall characteristics of models (with and without application
avail-able to users) for CC patients.
Table 8.: Characteristics of models (with and without an application available to users) for colon cancer patients.
Applications Models
Bush and Michaelson
(2009) [14] Chang et al. (2009) [18] Weiser et al. (2011) [104] Renfro et al. (2014) [86] Snow et al. (2001) [89] Stojadinovic et al. (2012) [92] Al-bahrani et al. (2013) [3] Number of Variables 9 6‡ 2/3/7 12 9 7 13
Dataset SEER SEER SEER ACCENT NCDB SEER SEER
Model regression-based regression-based regression-based regression-based ML-based and
regression-based ML-based ML-based
Target 0– 15 years
1– 10 years
(disease specific survival)
0– 5 years
(conditional survival)
5years 5years 5years 1, 2, 3 and 5 years 1, 2 and 5 years
Performance – C-index: 0.816 C-index: 0.61/0.63/0.68 C-index: 0.66
AUC: 0.876 (ANN) AUC: 0.82 (logistic regression) AUC: 0.85 AUC: 0.96/0.95/0.92 Accuracy: 90.38%/88.01%/85.13%
‡ Including months which already survived (for conditional survival calculate).
In a review of literature, none of models without an application for RC patients was found. Table9shows the variables used in the tools for rectal cancer patients.
Chapter 2. state of the art
Table 9.: Variables used in the applications for rectal cancer patients. Applications Wang et al. (2011) [102] Valentini et al. (2011) [98] Bowles et al. (2013) [10] Age 3 3 3 Gender 3 3 3 Grade 5 5 3
Stage grouped stage clinical , pathological
T-and pathological N-stage grouped stage
Race 3 5 3
Surgery Procedure 5 3 3
Radiotherapy dose 5 3 5
Concomittant chemotherapy 5 3 5
Adjuvant chemotherapy 5 3 5
Table10shows the overall characteristics of models with an application available to users
for RC patients.
Table 10.: Characteristics of models (with an application available to users) for rectal cancer patients. Wang et al. (2011) [102] Valentini et al. (2011) [98] Bowles et al. (2013) [10] Number of Variables 5‡ 9 7‡
Dataset SEER five European
randomized trials SEER
Model regression-based regression-based regression-based
Target 0– 5 years 1– 10 years
1– 10 years (disease specific survival) 0– 5 years (conditional survival)
Performance C-index: 0.75 C-index: 0.70 –
‡ Including months which already survived (for conditional survival calculate).
Observing the variables used to calculate the survival of patients with colon cancer, only the age of the patient is common to all models (with and without an application available). The stage of cancer (in grouped form), gender of patient, grade of tumor and the number of positive nodes are the other common variables. All the tools used to predict the survival of rectal cancer patients are to calculate the conditional survival and all of them employ the age and gender of patients. The stage of cancer (in grouped form), race of patient and surgery procedure are the other common variables. Moreover, the way in which the variables were selected to be part of model was not always evident. The present work intends to use data mining techniques to select the most relevant features and compare them to the opinion of a specialist physician, using the prognostic factors and the relations between them. Another goal is to know if similar features are selected for both cancers.
![Figure 5 .: Estimated cancer age-standardised rates worldwide in 2012 , per 100 . 000 people [ 29 ].](https://thumb-eu.123doks.com/thumbv2/123dok_br/17567717.817861/24.892.246.690.188.755/figure-estimated-cancer-age-standardised-rates-worldwide-people.webp)
![Figure 11 .: Web-based calculators for accurately predicting the clinical outcome for individ- individ-ual colon cancer patients and results [ 13 ].](https://thumb-eu.123doks.com/thumbv2/123dok_br/17567717.817861/36.892.209.739.149.662/figure-calculators-accurately-predicting-clinical-outcome-individ-patients.webp)
![Figure 12 .: Unadjusted AJCC disease-specific survival for patients with CC who were diag- diag-nosed between 1988 and 2000 [ 18 ].](https://thumb-eu.123doks.com/thumbv2/123dok_br/17567717.817861/37.892.207.604.317.600/figure-unadjusted-ajcc-disease-specific-survival-patients-nosed.webp)
![Figure 14 .: Results of the browser-based calculator to predict individualized disease-specific survival and conditional survival for colon cancer patients [ 17 ].](https://thumb-eu.123doks.com/thumbv2/123dok_br/17567717.817861/38.892.171.769.516.751/results-calculator-individualized-specific-survival-conditional-survival-patients.webp)
![Figure 21 .: Interactive tool for individualized estimation of conditional survival in rectal cancer and its results [ 101 ].](https://thumb-eu.123doks.com/thumbv2/123dok_br/17567717.817861/44.892.239.702.153.746/figure-interactive-individualized-estimation-conditional-survival-rectal-results.webp)
![Figure 22 .: Kaplan-Meier curves of risk group stratification for overall survival for valida- valida-tion dataset [ 98 ].](https://thumb-eu.123doks.com/thumbv2/123dok_br/17567717.817861/45.892.204.608.150.419/figure-kaplan-meier-curves-stratification-overall-survival-dataset.webp)
![Figure 26 .: Results of the browser-based calculator to predict individualized disease-specific survival and conditional survival for rectal cancer patients [ 9 ].](https://thumb-eu.123doks.com/thumbv2/123dok_br/17567717.817861/48.892.176.770.152.392/results-calculator-individualized-specific-survival-conditional-survival-patients.webp)