Ricar do F ont es Serpa Ne w s
trategies for impro
ving t he conver sion of w as te organic matter to me thane
Escola de Engenharia
Ricardo Fontes Serpa
New strategies for improving
the conversion of waste organic
matter to methane
Dissertação de Mestrado
Mestrado em Bioengenharia
Trabalho efetuado sob a orientação do
Doutor Gilberto Jorge da Silva Martins
e da Doutora Andreia Filipa Ferreira Salvador
Ricardo Fontes Serpa
New strategies for improving
the conversion of waste organic
matter to methane
Nome: Ricardo Fontes Serpa
Endereço eletrónico: [email protected] Telefone: 918279246 Bilhete de Identidade/Cartão do Cidadão: 13601609
Título da dissertação: New strategies for improving the conversion of waste organic matter to methane
Orientadores:
Doutor Gilberto Jorge da Silva Martins Doutora Andreia Filipa Ferreira Salvador
Ano de conclusão: 2016 Mestrado em Bioengenharia
DE ACORDO COM A LEGISLAÇÃO EM VIGOR, NÃO É PERMITIDA A REPRODUÇÃO DE QUALQUER PARTE DESTA TESE/TRABALHO.
Universidade do Minho, _____/_____/_________
A
GRADECIMENTOS
No decorrer do trabalho desenvolvido no âmbito desta dissertação, várias foram as pessoas que me ofereceram o seu apoio, às quais gostaria de expressar toda a minha gratidão.
Ao meu orientador, Gilberto Martins por toda a disponibilidade, orientação, conhecimentos transmitidos e todo o apoio fornecido dentro e fora do laboratório, bem como a confiança depositada em mim no desenvolvimento deste trabalho. À minha co-orientadora Andreia Salvador pelo apoio incansável, disponibilidade e boa disposição. Foi um prazer trabalhar com ambos e aprendi imenso sob a sua orientação.
A todos os meus colegas do LBA. Carla, Ana Luísa, Salomé, João, Sérgio, Márcia, Rita, Sónia, entre outros, que deram o seu contributo, seja pela ajuda nos trabalhos experimentais ou pelo bom ambiente de trabalho que todos os dias estava presente no laboratório.
Aos meus colegas com quem convivi diariamente no DEB. À Débora, à Ana, ao Rodrigo e à Ângela pelos momentos de descontração (ou não) e pela amizade. Um agradecimento especial à Diana por todo o seu apoio e carinho. Também aos meus colegas de curso e aos meus amigos conterrâneos que apesar de longe, não deixaram dar a sua contribuição.
Quero deixar um agradecimento muito especial à minha família. À minha mãe e ao meu irmão que nunca deixaram de me dar todo o seu apoio e de acreditar em mim em todo o meu percurso académico. Por último um sentido agradecimento, em memória do meu pai, José Humberto de Serpa, que infelizmente não me pôde acompanhar neste último ano, mas que me proporcionou todos os meios para concluir esta etapa e cujo forte apoio sempre foi incondicional e essencial em todos os momentos bons e nos mais complicados.
R
ESUMO
O biogás, que é composto maioritariamente por metano, é um componente gasoso produzido por microorganismos que usam como substrato moléculas simples, como o acetato, o hidrogénio ou o dióxido carbono, é uma conhecida alternativa aos combustíveis fósseis como fonte de energia. Em comunidades sintróficas, os organismos metanogénicos e as bactérias presentes trocam eletrões entre si com o objetivo de obtenção de energia para o seu crescimento, através de pequenos compostos químicos solúveis que servem de transporte, como o hidrogénio e o formato. Estudos recentes indicam que em alguns casos, estas trocas de eletrões podem ser realizadas diretamente ou por meio de materiais condutores, sendo esta uma abordagem que poderá ser mais favorável de um ponto de visto energético, aumentando assim a eficiência da metanogénese. Este projeto visou o estudo do efeito de nanotubos de carvão (NTC) nos mecanismos que envolvem a produção de metano em comunidades metanogénicas, através de dois diferentes estudos. No primeiro estudo, foram realizados ensaios em batch com culturas puras dos organismos metanogénicos hidrogenotróficos, Methanobacterium formicicum e Methanospirillum hungatei, e acetoclásticos, Methanosaeta concilii e Methanosarcina mazei, na presença de NTC. Além disso, também foram testadas culturas puras de M. formicicum na presença de NTC, mas sem adição de um agente redutor. Pelos resultados obtidos, verificou-se que os NTC provocaram um aumento na produção de metano e redução da fase de latência nas culturas puras dos metanogénicos hidrogenotróficos. Apesar de a presença dos NTC também ter acelerado a produção de metano nas culturas dos acetoclásticos com 1 g/L de NTC, numa maior concentração de 5 g/L de NTC, foi registada uma inibição na produção de metano e um aumento na duração das fases de latência. Num segundo estudo foram inoculadas culturas mistas contendo Syntrophomonas wolfei, uma bactéria que metaboliza butirato, e M. hungatei. Os resultados obtidos mostraram que a produção de metano também foi acelerada nas culturas mistas inoculadas com NTC, atingindo uma taxa de produção de metano de 1.03 ± 0.03 mM/d para as culturas incubadas com 5 g/L NTC, enquanto que na ausência de NTC, a taxa obtida foi de apenas 0.72 ± 0.01 mM/d. No âmbito deste trabalho, também foi realizada uma adaptação de biomassa em reatores anaeróbios, com o objetivo a longo prazo de adicionar os NTC para estudar o seu efeito em comunidades microbianas complexas. Por último, a análise dos resultados obtidos neste trabalho permitiu concluir que os NTC têm um efeito benéfico na conversão dos substratos a metano pelos microorganismos metanogénicos e pelas co-culturas sintróficas de S. wolfei e M. hungatei. Contudo, serão necessários mais estudos com os NTC para compreender melhor de que forma estes poderão estar envolvidos nos mecanismos de transferência de eletrões entre espécies, pois a sua influência neste processo continua por determinar.
A
BSTRACT
Biogas is an alternative to substitute fossil fuels and is mostly composed by methane, a gas component that is produced by microorganisms called methanogens that use compounds such as acetate, hydrogen and carbon dioxide as substrates. In syntrophic communities, methanogens and bacteria exchange electrons for energetic purposes, normally through the use of soluble small chemical compounds that act as shuttles, such as hydrogen or formate. However, it has been recently suggested that in some cases this electron exchange can be performed directly or with the aid of conductive materials, which can potentially be a more energy conserving approach, thus improving the efficiency of methanogenesis. This project addressed the study of the effect of carbon nanotubes (CNT) in methane production by methanogenic communities, in two distinct studies. In the first study, assays were performed in batch with pure cultures of hydrogenotrophic, Methanobacterium formicicum and Methanospirillum hungatei, and acetoclastic methanogens, Methanosaeta concilii and Methanosarcina mazei, in the presence of CNT. Also, growth of pure cultures of M. formicicum was tested in the absence of a reducing agent. The results showed that CNT presence in pure cultures of the hydrogenotrophic methanogens resulted in an increased methane production and reduced lag phases. Although CNT also accelerated methane production by the acetoclastic pure cultures at 1 g/L CNT, a higher concentration of 5 g/L CNT, inhibited the methane production and induced longer lag phases. In the second study, co-cultures of butyrate-degrading bacteria Syntrophomonas wolfei and M. hungatei were grown with and without CNT, in order to determine the effect of CNT in butyrate-oxidizing syntrophic communities. The presence of CNT accelerated methane production by this co-culture, with methane production rate reaching a value of 1.03±0.03 mM/d for co-cultures incubated with 5 g/L CNT, while co-cultures in the absence of CNT only registered a rate of 0.72±0.01 mM/d. Adaptation of sludge in anaerobic bioreactors was also performed with the long-term objective of adding CNT, in order to assess its effect in complex microbial communities. By analysing the results obtained in this work, it was concluded that CNT improved hydrogen and acetate conversion to methane by pure cultures of methanogens and by syntrophic co-cultures of S. wolfei and M. hungatei. However, future studies with CNT are encouraged in order to understand the mechanisms by which CNT influences the methanogenic activity and in which cases it can be involved in interspecies electron transfer, since with the results obtained it remains unclear if they have a role in electron exchange between different species.
T
ABLE OF CONTENTSAgradecimentos ... iii
Resumo... v
Abstract... vii
List of Figures ... xiii
List of Tables ... xv
Lista de Abbreviations ... xvii
1. State of the art ... 1
1.1 Anaerobic digestion ... 2
1.1.1 Microbiology and physiology of methanogens ... 5
1.2 Syntrophy and interspecies electron transfer in microbial anaerobic communities ... 9
1.2.1 Indirect electron transfer ... 13
1.2.2 Indirect electron transfer via chemical compounds ... 14
1.2.3 Direct interspecies electron transfer (DIET) ... 14
1.2.4 Direct electron transfer via conductive materials ... 15
1.3 Carbon nanotubes (CNT) ... 17
2. Aims and motivation ... 21
3. Effect of CNT in methanogenic pure cultures ... 25
3.1 Introduction... 26
3.2 Materials and methods ... 28
3.2.1 Preparation and incubation of the pure cultures ... 28
3.2.2 Analytical methods ... 29
3.2.3 Scanning Electron Microscopy (SEM) ... 29
3.3 Results ... 30
3.3.1 Methane production by pure cultures of M. concilii ... 30
3.3.2 Methane production by pure cultures of M. mazei ... 33
3.4 Discussion ... 47
4. Effect of CNT in co-cultures of S. wolfei and M. hungatei ... 53
4.1 Introduction... 55
4.2 Materials and methods ... 57
4.2.1 Preparation and incubation of the co-cultures ... 57
4.2.2 Analytical methods ... 57
4.3 Results ... 58
4.4 Discussion ... 61
5. Adaptation of anaerobic sludge to ethanol and VFA mixture in reactor operation ... 65
5.1 Introduction... 66
5.2 Materials and Methods ... 68
5.2.1 Reactor setup ... 68
5.2.2 Anaerobic sludge preparation ... 69
5.2.3 Preparation of feeding solutions ... 69
5.2.4 Routine analysis ... 69
5.3 Results ... 72
5.4 Discussion ... 77
6. Conclusions and future perspectives ... 81
References ... 85
7. Appendices ... 95
7.1 Appendix I – Chapter 3 ... 96
7.1.1 Composition of basal medium and bicarbonate and salts and vitamins solutions... 96
7.1.3 Substrate comsumption by methanogenic pure cultures ... 97
7.2 Appendix II – Designação do Anexo II ... 99
7.2.1 Routine analysis data ... 99
L
IST OF
F
IGURES
Figure 1.1 – Steps in the conversion of complex organic compounds to methane. ... 4 Figure 1.2 – Different mechanisms for interspecies electron transfer. ... 7 Figure 1.3 – Graphene sheets folded up as A) SWCNT; and B) MWCNT. ... 17 Figure 3.1 – Cumulative methane production by the acetoclastic methanogen M. concilii in the presence of different CNT concentrations. ... 30 Figure 3.2 – SEM analysis of M. concilii with and without CNT. ... 32 Figure 3.3 – Cumulative methane production by pure cultures of M. mazei in the presence of different CNT concentrations ... 34 Figure 3.4 – SEM analysis of M. mazei with and without CNT. ... 36 Figure 3.5 – Cumulative methane production by M. formicicum incubated with different amounts of CNT. ... 37 Figure 3.6 – SEM analysis of M. formicicum with and without CNT. ... 39 Figure 3.7 – Cumulative methane production in pure cultures of M. formicicum, without the addition of Na2S. ... 40
Figure 3.8 – Cumulative methane production by the hydrogenotrophic methanogen M. hungatei in the presence and absence of CNT. ... 43 Figure 3.9 – SEM analysis of M. hungatei with and without CNT. ... 45 Figure 3.10 – ORP averages determined in the experiments with M. concilii and M. mazei when incubated with and without CNT. ... 48 Figure 3.11 – ORP averages determined in the experiments with M. formicicum and M. hungatei, incubated with and without CNT and in the abiotic assay performed with different CNT concentrations. ... 46 Figure 4.1 – Cumulative methane production (A) and conversion of butyrate to acetate (B) by the co-culture of S. wolfei and M. hungatei in the presence and in the absence of CNT. ... 58 Figure 4.2 – Cumulative methane production by M. hungatei pure cultures in the presence and absence of CNT. ... 60 Figure 5.1 – Reactor setup ... 68
ethanol and reactors fed with VFAs. Results are presented in averages of the duplicates. ... 73
Figure 5.4 – Methane production, ethanol and acetate averages present in R1 and R2 ... 74
Figure 5.5 – COD and VFA along time for R3 and R4. ... 75
Figure 7.1 – Acetate consumption and methane production in M. concilii pure cultures ... 97
Figure 7.2 – Acetate consumption and methane production in M. mazei pure cultures ... 97
Figure 7.3 - Hydrogen consumption and methane production by M. formicicum pure cultures ... 98
Figure 7.4 – Hydrogen consumption and methane production by M. hungatei pure cultures ... 98
Figure 7.5 – Methane production rates and ORP values in R1 and R2 ... 99
L
IST OF
T
ABLES
Table 1.1 – General characteristics of some methanogenic archaea families ... 6 Table 1.2 – Characteristics of mesophilic methanogens M. concilii, M. hungatei, M. formicicum, M. mazei ... 9 Table 1.3 - Reactions occurring in obligate methanogenic syntrophic cultures ... 12 Table 3.1 – Methane produced by M. concilii when incubated with different CNT concentrations ... 31 Table 3.2 – Initial and final acetate concentrations detected in M. concilii incubations and final methane concentration obtained ... 31 Table 3.3 – pH and ORP values measured in pure cultures containing M. concilii supplied with CNT in different concentrations ... 33 Table 3.4 – Methane production by pure cultures of M. mazei with and without CNT at different time points of the assay ... 34 Table 3.5 – Acetate consumption and methane produced by M. mazei with and without CNT ... 35 Table 3.6 – pH and ORP values measured throughout the M. mazei assay in the presence of CNT .... 35 Table 3.7 – Cumulative methane production by pure cultures of M. formicicum incubated with and without CNT. ... 38 Table 3.8 – Initial and final hydrogen concentrations detected in M. formicicum cultures incubated with and without CNT and final methane concentrations obtained ... 38 Table 3.9 – pH and ORP values measured throughout the experiment with M. formicicum pure cultures ... 39 Table 3.10 - Methane production by M. formicicum pure cultures without the addition of a reducing agent... 41 Table 3.11 – Hydrogen to methane conversion by M. formicicum pure cultures without the addition of the reducing agent Na2S. ... 42
Table 3.12 – ORP and pH values measured in M. formicicum pure cultures without the addition of Na2S
... 42 Table 3.13 – Cumulative methane production by pure cultures of M. hungatei with and without CNT in different points of the course of the assay. ... 44
pure cultures ... 46
Table 4.1 – Total conversion of butyrate to acetate ... 59
Table 4.2 – Methane production rate, lag phase, time of maximum methane and ORP values in co-cultures and pure co-cultures ... 60
Table 5.1 – VSS determined in each of the four reactors throughout the assay ... 76
Table 5.2 – pH averages of reactors 1 to 4 ... 76
Table 5.3 – ORP values averages at the entrance and exit of R1, R2, R3 and R4 ... 76
Table 5.4 – Reactions occurred in the AD process with ethanol and acetate as the substrates for methane production ... 77
Table 7.1 – VSS and TSS concentrations in R1, R2, R3 and R4 ... 100
L
IST OF
A
BBREVIATIONS
AD – Anaerobic digestionAQDS – anthraquinone-2,6-disulphonate CNT – Carbon nanotubes
COD – Chemical oxygen demand
DIET – Direct interspecies electron transfer DNA – Deoxyribonucleic acid
EGSB – Expanded granular sludge bed EPS – Extracellular polysaccharides GAC – Granular activated carbon GC – Gas chromatography
HPLC – High pressure liquid chromatography MCR – Methyl-coenzyme M-reductase
MWCNT – Multi-walled carbon nanotubes NTC – Nanotubos de carvão
OLR – Organic loading rate ORP – Redox potential RNA – Ribonucleic acid
SAA – Specific acetoclastic activity SEM – Scanning electron microscopy STP – Standard temperature and pressure SWCNT – Single-walled carbon nanotubes TSS – Total suspended solids
UASB – Up-flow anaerobic sludge blanket VFA – Volatile fatty acids
1.1
Anaerobic digestion
To use a reliable and renewable energy resource is a main societal goal and methane (CH4) production from organic wastes is one of the most effective ways to accomplish that goal (Li et al. 2011). Large technological developments have been made in the field of anaerobic digestion (AD) in the last two decades, since this has proven to be a very promising approach to both waste management and renewable energy resources (Adekunle & Okolie 2015). AD process is one of the most economic ways to treat industrial wastewater and consists in the reduction of complex organic polymers through a series of biochemical reactions that degrade them into simpler molecules (i.e. CO2 and CH4) in the absence of oxygen (Stams et al. 2012).
Methane is the name given to the simplest existing alkane, composed by one atom of carbon and four atoms of hydrogen and it is the main component of natural gas. Methane is used as fuel for electrical generation, as vehicle fuel, and it can also be utilized in the production of biomethanol (Khirsariya & Mewada 2013; Düren et al. 2004). However, with a concentration increasing at a rate of about 1% per year, it is the second most abundant carbon-containing gas in the atmosphere (Cicerone & Oremland 1988), and is included in a group of gases called greenhouse gases.
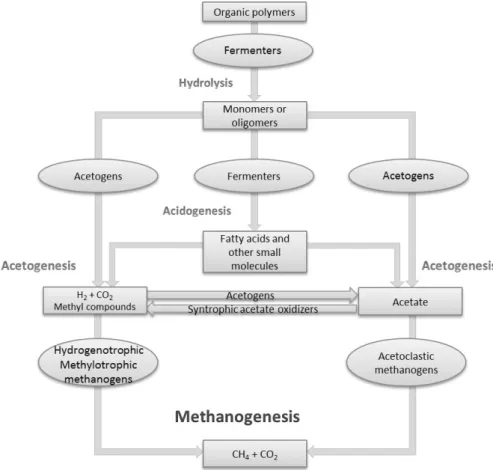
With the very probable depletion of fossil fuels occurring in the not so distant future, comes the need to obtain alternative and more resourceful ways of generating energy (Merlin Christy et al. 2014), making methane an interesting option. Though it might be an environmental hazard when in abundance in the atmosphere, the controlled conversion of organic waste to methane in bioreactors can be a sustainable and efficient way of treating waste and generating bioenergy. The following schematic drawing (Figure 1.1) represents the anaerobic food chain for the conversion of complex organic matter to methane in anaerobic conditions and shows the steps needed to convert complex organic molecules into the final products.
Figure 1.1 – Steps in the conversion of complex organic compounds to methane; adapted from Meslé et al. 2013.
The first step in anaerobic digestion is the hydrolysis, in which insoluble organic polymers such as proteins, polysaccharides and nucleic acids are hydrolysed by strict anaerobes, involving the production of several extracellular hydrolytic enzymes (Schink 1997). Different microorganisms produce different enzymes that are responsible for breaking down complex molecules into shorter chains. The complex biodegradable materials are transformed into simpler soluble organic compounds, such as monosaccharides, fatty acids, glycerol and amino acids, making this a fundamental step, since methanogens are unable to directly use such complex compounds as a substrate for methane production (Merlin Christy et al. 2014). The products of hydrolysis are further converted into smaller molecules such as organic acids, alcohols, carbon dioxide and hydrogen, in a process named acidogenesis. The intermediate products that are formed in this step can be reduced when in the presence of alternative electron acceptors, which is why these reactions can only be performed in anoxic conditions (McInerney et al. 2008). Hydrogen produced in this phase needs to be consumed by other microorganisms since the next phases depend on low hydrogen partial pressure to occur due to thermodynamic constraints (Adekunle &
Okolie 2015). Before they can be converted to methane, major products of acidogenesis, such as volatile fatty acids (VFA) and alcohols still need to go through one more process, named acetogenesis (Meslé et al. 2013). During this phase, hydrogen molecules are formed with protons serving as the final electron acceptors, leading to the formation of the methanogenic substrates, i.e. acetate, carbon dioxide and hydrogen. The final step of anaerobic digestion is named methanogenesis, where methane production takes place. This may be a slow reaction, depending on the substrate (i.e. hydrogenotrophic methanogens have a fast doubling time, while acetogenic methanogens perform this step slower) and can only be carried out under strict anaerobic conditions (Adekunle & Okolie 2015; Murphy & Thanasit Thamsiriroj 2013). Because acetogenesis can only occur in low hydrogen partial pressures, the activity of methanogens is crucial for the depletion of hydrogen, making both reactions a collaboration effort between the two different microorganisms. There is still much to know about methanogenesis, but it is currently accepted that it can be carried out in three distinct ways, depending on the source of carbon: hydrogenotrophic methanogenesis, methylotrophic methanogenesis and acetoclastic
methanogenesis(Meslé et al. 2013). As their names suggest, these processes differ in the
compound which acts as the electron donor, being hydrogen in hydrogenotrophic, methyl groups in methylotrophic and acetate in acetoclastic methanogenesis. All pathways have the final step in common, which is the demethylation of methyl-coenzyme M to methane and the reduction of the heterodisulfide of coenzyme M and coenzyme B (Peder E. Cedervall 2010; Thauer et al. 1993). It is because of this ability to deplete resources such as carbon dioxide or smaller organics, that methanogenesis is considered to be a fundamental part of the carbon cycle (McInerney et al. 2009).
1.1.1 Microbiology and physiology of methanogens
Microorganisms capable of performing methanogenesis are called methanogens. All methanogens have a number of characteristics that set them apart from other microorganisms: they belong to the Archaea domain, phylum Euryarchaeota, obtain all their energy for growth by producing CH4, are strict anaerobes, therefore unable to survive in oxic environments and, as
mentioned before, capable of utilizing a limited number of substrates to produce methane (Liu et al. 2012). All known methanogens possess a core enzyme that catalyses the final reduction in
them in the environment by targeting the gene mcrA, which encodes the α-subunit of this enzyme (Denman et al. 2007; Juottonen et al. 2006; Luton et al. 2002)
Methanogens are most abundant in environments with the lack of alternative electron acceptors,
such as Fe3+, O2, NO3- and SO42-. They are most commonly found in places like deep subterranean
habitats, flooded soils, gastrointestinal tracks of humans and animals and oil reservoirs (Whitman et al. 2006). Also, methanogens have been reported to be able to survive in a wide range of
temperatures (15 ᵒC to 100 ᵒC) and pH (3 to 10) (Zinder 1993). Currently, there are fourteen
known families of methanogenic archaea and some characteristics of a few of these families are listed in the Table 1.1.
Table 1.1 – General characteristics of some methanogenic archaea families
Characteristics
Family Shape Substrates for
methanogenesis Gram stain Motility
GC content (mol %)
Methanobateriaceae Long or short rods H2 + CO2, formate, alcohols
Mostly
positive Non motile 23-61
Methanothermaceae Rods H2 + CO2 Positive Non motile 33-34
Methanococcaceae Irregular cocci H2 + CO2 and formate Negative Motile 29-34
Methanomicrobiaceae Rods, spirals, plates or
irregular cocci
H2 + CO2, formate and
alcohols Negative
Motile or non
motile 39-61
Methanocorpusculaceae Small irregular cocci H2 + CO2, formate and
alcohols Negative
Motile or non
motile 48-52
Methanospirillaceae Curved rods H2 + CO2, formate
Mostly
negative Motile 40-45
Methanosarcinaceae Pseudosarcina, irregular
cocci, sheathed rods
H2 + CO2, acetate and methyl compounds Positive or negative Frequently non motile 36-52
Methanosaetaceae Sheathed rods Acetate Negative Non motile 49-57
Adapted from: Whitman et al. 2006; Zinder 1993; Barber et al. 2011; Mori et al. 2012; Iino et al. 2010; Zhou et al. 2014; Parshina et al. 2014.
Each of these families is divided in genera: in the Methanobacteriaceae family, there are
Methanobacterium, Methanobrevibacter and Methanosphaera and Methanothermobacter genera; Methanosarcinaceae includes the Methanosarcina, Methanosalsum, Methanomethylovorans,
Methanomicrococcus genera; Methanosaetaceae contains the Methanosaeta genus; and Methanospirillaceae contains the Methanospirillum genus. There are also other methanogens that are unaffiliated to any of these families as they require a more thorough analysis to define their taxonomic classification (Whitman et al. 2006).
The most abundant species of methanogens found in anaerobic reactors include Methanospirillum hungatei, Methanosarcina mazei, Methanosaeta concilii and Methanobacterium formicicum (Tale et al. 2015; Silva et al. 2016; Chen, Rotaru, Liu, et al. 2014; Leclerc et al. 2004; Kato et al. 2012; Salvador et al. 2013). In Table 1.2, some of the main characteristics of these four different species are represented.
1.2
Syntrophy and interspecies electron transfer in microbial anaerobic
communities
Methanogens are unable to use complex organic molecules as substrates, thus requiring them to be degraded into more simple compounds before they can be used for methanogenesis. The key for making this happen lies in syntrophic interactions between different species belonging to distinct taxonomic and metabolic groups (McInerney et al. 2008). Syntrophy was first noticed in 1967 by Marvin P. Bryant and his colleagues when they were conducting a study with a Methanobacillus omelianskii culture that lost its ability to use ethanol as a substrate. It was at that time that they were able to identify two distinct microorganisms in the culture, instead of only
one: the S-organism, which fermented ethanol to acetate and hydrogen and Methanobacterium
bryantii strain MoH that used the hydrogen, creating favourable conditions for the growth of the S-organism (Stams & Plugge 2009). The culture of Methanobacillus omelianskii was then found to be in fact a syntrophic co-culture.
According to Schink et al. (1997), syntrophic interactions can be defined as “cooperations in which both partners depend on each other to perform the metabolic activity observed and in which the mutual dependence cannot be overcome by simply adding a co-substrate or any type of nutrient”. So as H2 and formate are the major electron carriers, methanogens become crucial to syntrophy because they can efficiently remove either hydrogen or formate from the environment. Bacteria are crucial as well due to their role in degrading more complex molecules
Table 1.2 – Characteristics of mesophilic methanogens M. concilii, M. hungatei, M. formicicum, M. mazei
Methanogenic species Microscopic images Substrate Cell envelope structure References
M. concilii Acetate S-layered sheath overlying an amorphous granular layer; spacer plugs subunits form concentric rings
(Albers & Meyer 2011; Whitman et al. 2006)
M. hungatei H2/CO2; formate
S-layered sheath overlying a single S-layered wall; multilayered spacer plugs between cells; intermediate amounts of tetraether
lipids in plasma membrane
(Migas et al. 1989; Whitman et al. 2006; Beveridge & Schultze-Lam
1996)
M. formicicum H2/CO2; formate
Amorphous cell wall of pseudomurein; plasma membrane with intermediate amounts of tetraether lipids
(Battumur et al. 2016; Beveridge & Schultze-Lam 1996; Whitman et al.
2006)
M. mazei Acetate;
H2/CO2 (poor growth)
Amorphous cell wall of methanochondroitin; over top of a single S-layer; few tetraether lipids in plasma membrane
(Osumi et al. 2008; Beveridge & Schultze-Lam 1996; Rivkina et al.
Anaerobic growth on propionate is an example of a syntrophic interaction, in which methanogens live off the products of proton-reducing bacteria that metabolize propionate, producing acetate and H2 that are then used by methanogens for methane production. These reactions and others that occur in obligate methanogenic syntrophic cultures are shown in Table 1.3.
Syntrophic microorganisms can be either facultative or obligate, depending whether or not they can survive in environments with high H2 partial pressure. For example, during glycolysis, glucose is
converted to acetate, releasing CO2, H2 and H+ as a reduced product (Equation 1.1)
(ΔG = - 216 kJ/mol) Eq. 1.1
In the midst of this process, NADH is produced by oxidation of glyceraldehyde-phosphate to 3-phosphoglycerate. However, in the presence of high amounts of H2, this oxidation is no longer thermodynamically possible (Stams & Plugge 2009). Some facultative bacteria are able to oxidize NADH by reducing intercellular metabolites in energetic favourable reactions, compensating the lack of
H2 depletion by methanogens. In the downside of this ability to oxidize NADH on their own, these
bacteria end up losing some energy potential, as their ATP gain would be higher when H2 utilizing anaerobes are present (Stams & Plugge 2009).
Stams & Plugge (2009) defined obligate syntrophic consortia as the following:
Microorganisms are capable of degrading fatty acids while working together, but individually neither the methanogens nor the bacteria can;
They grow in conditions close to the thermodynamic equilibrium;
Due to the influence of the inter-microbial distances in biodegradation and specific growth rates, both microorganisms form aggregates;
Sharing of chemical energy is possible due to evolved biochemical mechanisms.
Apart from hydrogen, the acetate that is formed during syntrophic reactions listed in Table 1.3 can also be used by acetoclastic methanogens for methane production according to the following reaction:
(ΔG = -36 kJ/mol) Eq. 1.2
A good example of a microorganism capable of establishing syntrophic interactions with methanogens is Syntrophomonas wolfei. This species is considered a metabolic specialist that metabolizes saturated
short-chain fatty acids in syntrophic association with hydrogen and formate users, and can only grow alone in crotonate, an unsaturated fatty acid (Sieber et al. 2010). Other species such as Syntrophomonas zehnderi and Pelotomaculum schinkii are obligate syntrophs, thus unable to grow alone in any substrate (McInerney et al 2008).
One common group in methanogenic aggregates present in wastewater digesters treating wastewater
from brewery industry (therefore, in the presence of ethanol) is Geobacter (Rotaru et al. 2014a).
Geobacter sulfurreducens and Geobacter metallireducens can grow together in anaerobic medium containing fumarate as the electron acceptor and ethanol as the electron donor. This was the first documented case of direct interspecies electron transfer (DIET) (Summers et al. 2010). This syntrophic relationship is described in detail in Section 1.2.4.
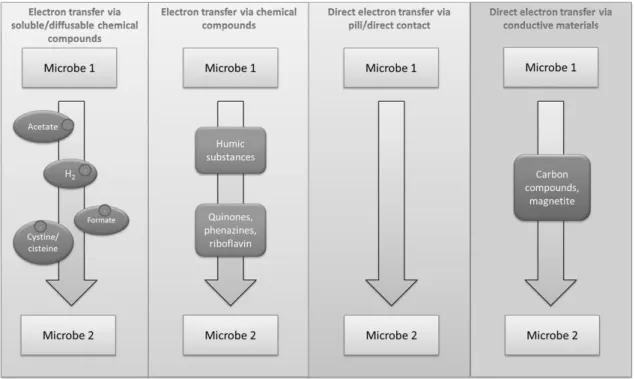
Electron exchange between species in microbial communities is still a mechanism not completely understood, but it is a fundamental process in methanogenic environments (Shrestha & Rotaru 2014). Interspecies electron transfer is the way that microorganisms transfer energy between each other and can be conducted in four different ways as shown in the following diagram (Figure 1.2).
1.2.1 Indirect electron transfer via H2/formate
The most commonly observed mechanism of electron transfer in methanogenic communities is the
indirect electron transfer via H2/formate(Sieber et al. 2014). Hydrogen acts as a shuttle in many
syntrophic interactions because it is a small molecule and can easily diffuse in the medium and it is a powerful electron donor under anaerobic conditions. The task of keeping hydrogen at low
concentrations is attributed to the hydrogenotrophic methanogens and their ability of removing the hydrogen in metabolic processes (Sieber et al. 2012). The acetogens’ metabolism is inhibited when hydrogen concentration rises and the methanogens are stimulated, consuming the hydrogen formed which will then in turn stimulate the acetogenic activity (Sieber et al. 2012)
The following chain of reactions is an example of the chemical reaction that occurs when a bacterium (ethanol consumer) and a hydrogenotrophic methanogen are in syntrophy and interspecies hydrogen transfer takes place:
First, the metabolism of ethanol produces acetate with the release of electrons (Equation 1.3):
(ΔG = 9.6 kJ/mol) Eq. 1.3
Then, the bacteria use these electrons to produce hydrogen, through different reactions (Equation 1.4 to Equation 1.7):
(ΔG = 3 kJ/mol) Eq.1.4
(ΔG = - 3 kJ/mol) Eq.1.5
(ΔG = 18 kJ/mol) Eq.1.6
(ΔG = 37 kJ/mol) Eq.1.7
Finally, H2 serves as an electron donor for methane production, according to Equation 1.8:
(ΔG = - 130.6 kJ/mol) Eq.1.8
For indirect electron transfer via formate, the global reaction is as follows (Equation 1.9):
Table 1.3 - Reactions occurring in obligate methanogenic syntrophic cultures; adapted from (Zinder 1993)
Substrate Examples of organisms Reaction TotalΔGᵒ’
(kJ/mol CH4) Td (h) Ethanol Geobacter metallireducens -116.3 <24 Hydrogenotrophic methanogen Overall reaction Butyrate Syntrophomonas wolfei -39.4 84 Hydrogenotrophic methanogen Overall reaction Propionate Syntrophobacter wolinii -34 168 Hydrogenotrophic methanogen Overall reaction Benzoate Syntrophus buswelii -15.8 168 Hydrogenotrophic methanogen Overall reaction Acetate
Acetate oxidizing bacteria
-31 36
Methanogen
1.2.2 Indirect electron transfer via chemical compounds
Chemical compounds such as humic substances can also act as electron shuttles that allow interspecies electron transfer. Lovley et al. (1999) demonstrated that quinone structures present in humic substances, can mediate electron transfer between humics-reducing and humics-oxidizing microorganisms. Electron transfer between Geobacter metallireducens and Wolinella succinogenes could be mediated by anthraquinone-2,6-disulphonate (AQDS), a humic analogue (Lovley et al. 1999). In this specific case, G. metallireducens oxidizes acetate and reduces AQDS, which is further oxidized by W. succinogenes with reduction of fumarate. Oxidation of acetate without AQDS could not happen since G. metallireducens does not have the ability to reduce fumarate and W. succinogenes is unable to oxidize acetate. These quinone structures are reduced to a hydroquinone form that can either react with Fe(III) or act as an electron donor for anaerobic microbial respiration. Therefore, humic substances and soluble quinones may play an important environmental role as mediators of exocellular electron transfer, since they can also act in other reduction processes, like azo-dye cleavage, reduction of nitroaromatics and reduction of uranium (Stams et al. 2006), as well as act as a terminal electron acceptor in the anaerobic oxidation of aromatic hydrocarbons such as toluene and benzene (Lovley et al. 1996; Cervantes et al. 2001). Aside from humic substances, other soluble chemical compounds, such as phenazines, melanin and riboflavin can also play a similar role in the mediation of interspecies electron transfer, with riboflavin being a particularly efficient mediator in azo-dye reduction (dos Santos et al. 2004).
1.2.3 Direct interspecies electron transfer (DIET)
An alternative mechanism for electron transfer in methanogenic environments is DIET, in which electrons are transferred from one species to another directly, without the need for electron exchange through soluble molecules (Rotaru et al. 2014a) or mediated by other compounds, as discussed in previous sections. DIET was first reported by Summers et al. (2010) in defined co-cultures of Geobacter sulfurreducens and G. metallireducens grown in a medium with ethanol as the electron donor and
fumarate as the electron acceptor. In these co-cultures, it was known that G. metallireducens could
metabolize ethanol, but was unable to use fumarate as an electron acceptor, while G. sulfurreducens
could reduce fumarate, but was unable to metabolize ethanol(Summers et al. 2010). Co-cultures were
grown with a strain of G. sulfurreducens in which the hyb gene that encodes a hydrogenase subunit
deleted was unable to use hydrogen. Therefore, it was suggested that both Geobacter were most likely exchanging electrons directly by forming large electrically conductive aggregates, since the acetate
produced by G. metallireducens could not be used as an electron donor either, because it was
consumed by G. sulfurreducens (Summers et al. 2010). Both species are capable of establishing
electrical connections through their pili, which makes this direct electron exchange possible (Rotaru et al. 2014a). Knowledge of this process is still very limited and further studies are required to understand and evaluate the impact of DIET on methane producing environments.
Recent studies have showed that the acetoclastic specialist Methanosaeta harundinacea possesses the
ability to accept electrons via DIET and that DIET can possibly predominate over interspecies H2/formate transfer during anaerobic digestion (Rotaru et al. 2014a). However, the electron accepting components that allow Methanosaeta to participate in DIET are not known, although a mechanism has
been hypothesized by Rotaru et al (2014). In this study, co-cultures of ethanol-metabolizing G.
metallireducens and strictly acetoclastic methanogen M. harundinacea were grown. As depicted in Equation 1.3, ethanol oxidation results in the formation of acetate and the release of electrons and, in
order for the ethanol present in these cultures to be completely metabolized, it was necessary for M.
harundinacea to utilize the electrons released, as well as the acetate formed. The results showed that ethanol was completely consumed, indicating that the methanogen was able to utilize the electrons
released when ethanol was consumed by the bacteria and, since M. harundinacea is unable to use
hydrongen as an electron acceptor, it was suggested that they were exchanging electrons directly
(Rotaru et al. 2014a). Furthermore, some methanogens, namely M. hungatei and M. formicicum are
unable to form co-cultures with G. metallireducens (Rotaru et al. 2014a), suggesting that not all
methanogenic archaea have the ability of exchanging electrons directly.
DIET can be a more efficient way of interspecies electron transfer when compared to indirect electron transfer if we take into account that this mechanism has a greater potential for energy conservation, since no electron carriers are involved (Lovley 2011), so it could represent a very interesting alternative for improving anaerobic degradation and methane production rates.
1.2.4 Direct electron transfer via conductive materials
Many studies have pointed that a variety of conductive materials can promote interspecies electron transfer (Lovley 2011; Sieber et al. 2012; Shrestha & Rotaru 2014). Methanogens could be enriched
accelerate methanogenesis in terms of onset time and production rate, and caused a significant
enrichment of Geobacter and Methanosarcina species (Kato et al. 2012). Moreover, another recent
study performed with magnetite suggested that magnetite could compensate for the lack of
pilin-associated cytochrome OmcS of G. sulfurreducens to mediate electron transfer between G.
sulfurreducens and extracellular electron donors or acceptors (Liu et al. 2014). It was also verified in the same study that OmcS gene expression by G. sulfurreducens decreased in the presence of magnetite which could mean that the bacteria adapted to the conductive materials, spending less energy in the cytochrome biosynthesis to facilitate electron transfer.
In anaerobic digesters, granular activated carbon (GAC) has been used to stimulate the metabolism in
reactors’ start-up, as well as to deal with reactor instabilities (Rotaru et al. 2014; Liu et al. 2012).
Therefore, GAC was evaluated in its ability to promote DIET and it was found that in co-cultures with G. metallireducens and Methanosarcina barkeri, methane was produced in large amounts and with a very small or non-existent lag phase, when compared to the co-cultures with the same microorganisms in the absence of GAC (Liu et al. 2012).
Biochar, which is a charcoal-like product of the incomplete combustion of biomass in a limited supply of oxygen, used mostly as soil amendment, is a conductive material and has been shown to promote DIET between syntrophic co-cultures in a study performed with co-cultures of G. metallireducens and either G. sulfurreducens or M. barkeri with ethanol as an electron donor (Chen et al. 2014b). The methanogenic co-cultures (with G. metallireducens and M. barkeri) in the presence of biochar were able to utilize 86% of the electrons that resulted from ethanol metabolism for methane production, while the co-cultures grown in the same conditions but without biochar did not register any methane production
or ethanol consumption at all. Also, G. metallireducens and M. barkeri did not form aggregates, but
attached to the biochar, which suggests that the electrons were exchanged via electrical connections formed by the biochar, rather than biological connections (Chen et al. 2014b).
Another example of a conductive material used in the study of DIET is carbon cloth. In a similar study as the one performed with biochar, carbon cloth was also added to co-cultures of G. metallireducens and G. sulfurreducens or M. barkeri (Chen et al. 2014a). It was showed that this carbon material accelerated the ethanol consumption and methane production by the co-cultures. While co-cultures not amended with carbon cloth took 40 days to start metabolizing ethanol, comparing to the 10 days necessary to start this process in the presence of carbon cloth (Chen et al. 2014a).
All these materials have one thing in common: they are all highly conductive and can influence interspecies electron exchange, even though the mechanisms of action are not always well understood.
1.3
Carbon nanotubes (CNT)
Due to their properties, conductive materials in a nanoscale can favour microbial extracellular electron transfer, which can play an important role in biogeochemical cycles, bioremediation and several bioenergy strategies (Liu et al. 2014). CNT are long cylindrical hollow structures, with a diameter rounding the order of a nanometer, whose walls are formed by a single layer of carbon atoms bonded in an hexagonal lattice, named graphene (Javey & Kong 2009). They are known for their unique physical properties, such as their large surface area and strength despite their small dimensions, and can be excellent semiconductors (Javey & Kong 2009). They also have been reported to improve settleability and dewaterability in activated sludge under aerobic conditions, producing no negative effects (L. L. Li et al. 2015). In addition, the conductive properties of carbon nanotubes make them function as great redox mediators, accelerating electron transfer from a primary electron donor to a terminal electron acceptor (Pereira et al. 2014), and can possibly facilitate reactions in methanogenic communities. There are two types of carbon nanotubes in terms of structure: single-walled carbon nanotubes (SWCNT) and multi-walled carbon nanotubes (MWCNT). While SWCNT can be thought of as a graphene sheet rolled up to form a seamless cylindrical structure, MWCNT are arranged by multiple sheets as shown in Figure 1.3 (Vidu et al. 2014; Zhang et al. 2013).
Figure 1.3 – Graphene sheets folded up as A) SWCNT; and B) MWCNT.
of the MWCNT (Peigney et al. 2001). However, when CNT form aggregates, the surface area decreases significantly in the case of the SWCNT (Zhang et al. 2009). Also, the SWCNT have a diameter of about 1 nm, while the diameter of MWCNT has a wider range that depends on the number of walls (Peigney et al. 2001).
CNT influence on anaerobic communities (complex cultures and co-cultures) still needs investigation. Recent studies have demonstrated that CNT can improve acetate consumption and methane production in anaerobic granular sludge containing a great amount of the acetotrophic methanogen Methanosaeta concilii (L. L. Li et al. 2015). This fact allied to the much higher conductivity verified in anaerobic granular sludge, due to the exposure to CNT, suggests that these materials may simulate
methane production by M. concilii. CNT also have the ability to alter electron flow routes of microbial
communities (Yan et al. 2013). In this case, Shewanella oneidensis, a metal-reducing bacterium that
relies on extracellular electron transfer for its respiration, was studied for its ability to reduce nitrobenzene in the presence of CNT. It was shown that the presence of CNT led to a significantly faster reduction of nitrobenzene by immobilized cells, which suggests that they were involved in the extracellular electron transfer process (Yan et al. 2013).
CNT may however be toxic to microorganisms and can affect their growth. Kang et al (2007) demonstrated that SWCNT can have a strong antimicrobial activity in a study performed with Escherichia coli. In addition, MWCNT were studied for their effects in the microbial activity of upflow anaerobic sludge blanket reactors (UASB) and it was found that their presence resulted in a reduced microbial viability, as well a reduction in VFA and biogas production (Yadav et al. 2016). Another study performed by Luongo & Zhang (2010) showed that MWCNT caused inhibition in respiration by aerobic sludge, having a toxic effect that was intensified with higher concentrations.
Cytotoxicity of these CNT seems to be related to the damage of cell walls when direct contact is established and this effect seems to be more evident with SWCNT than with MWCNT (Pasquini et al.
2012; Vecitis et al. 2010; Kang et al. 2008). Kang et al. (2008) performed a study with E. coli in which
was verified that the diameter of CNT was an important factor in their cytotoxicity towards bacteria. A concentration of 0.3 g/L of CNT was enough to cause a major loss in cell viability that was over 80% in the SWCNT case, while it was of over 20% in the case of MWCNT (Kang et al. 2008). Some authors have hypothesized that both aggregate morphology and dispersitivity of the CNT are the main factors affecting cytotoxicity (more than the physiochemical properties of the functional groups present in CNT), meaning that they can be manipulated to be less harmful to the microorganisms (Pasquini et al. 2012).
Electrons are exchanged between anaerobic microorganisms when they are performing AD. This is a fundamental process in methane production and it can be aided by the presence of conductive materials, in order to improve its efficiency in energy conservation. Also, there is still much room for comprehension of the mechanisms involved in interspecies electron transfer by methanogenic communities. Therefore, the research done in the framework of this thesis aimed to study the effect of conductive materials in methanogenic cultures and how we can improve methane production in a larger scale.
The mechanisms involved in interspecies electron transfer in a methanogenic consortium were studied, so that they can be better understood. In order to achieve this, the three main goals were:
1) to assess the influence of CNT on CH4 production rate by different methanogenic archaea, both
hydrogenotrophic and acetoclastic methanogens;
2) to assess the effect of CNT on the syntrophic conversion of butyrate to CH4;
3) to adapt syntrophic consortia to certain substrates in anaerobic reactors and the posterior application of CNT, in order to determine their effect on methane production.
3.1
Introduction
Carbon materials have been reported to influence methane production by methanogenic aggregates and anaerobic granular sludge (Liu et al. 2012; Chen et al. 2014b; L. L. Li et al. 2015). It has been reported that materials such as CNT, graphite, biochar, carbon cloth and GAC improved methane production by the methanogenic communities (Liu et al. 2012; Chen et al. 2014a; Chen et al. 2014b; L. L. Li et al. 2015; Zhao et al. 2015). Some authors suggested that carbon materials participate in interspecies electron transfer, between Geobacter species and acetoclastic methanogens from genera Methanosaeta (Rotaru et al. 2014a) and Methanosarcina (Rotaru et al. 2014b). However, the effect of multi wall carbon nanotubes directly on pure cultures of methanogens was never studied before. Therefore, in this Chapter, pure cultures of hydrogenotrophic and acetoclastic methanogens were incubated with CNT in order to investigate its influence on methanogenesis directly and also to provide a better comprehension on the processes in which methane production by microbial communities, such as anaerobic sludge or defined co-cultures, is improved when carbon materials are present. The methanogenic species selected for conducting these studies are commonly found in anaerobic sludge (Leclerc et al. 2004; Kato et al. 2012; Salvador et al. 2013; Chen, Rotaru, Liu, et al. 2014; Tale et al. 2015; Silva et al. 2016): Methanobacterium formicicum and Methanospirillum hungatei as hydrogenotrophic methanogens, meaning that they convert hydrogen and carbon dioxide to methane (Equation 3.1), and Methanosaeta concilii and Methanosarcina mazei as acetoclasts, which produce methane and carbon dioxide from acetate (Equation 3.2).
Methane production from hydrogen and CO2 by hydrogenotrophic methanogens:
Equation 3.1
Methane production from acetate by acetoclastic methanogens:
3.2
Materials and methods
3.2.1 Preparation and incubation of the pure cultures
Pure cultures of four different methanogens namely, Methanobacterium formicicum (DSM 1535), Methanosaeta concilii (DSM 3671), Methanosarcina mazei (DSM 2053) and Methanospirillum hungatei (DSM 864) were grown in anaerobic medium with and without CNT, in order to evaluate the effect of CNT on methane production rate. For each pure culture, different concentrations of CNT were tested; 0 g/L, 1 g/L and 5 g/L, and all assays were carried out in triplicate.
Commercial carbon nanotubes (CNT, Nanocyl 3100) were used for this purpose. CNT are characterized by having a homogeneous size and morphology with aligned walls parallel to the main axis of the nanotubes (Tessonnier et al. 2009). They are highly conductive, have an extremely porous surface with a high area and a narrow tubular morphology with outer and inner tube diameters at an average of 10 nm and 4 nm, respectively (Tessonnier et al. 2009). The Nanocyl 3100 CNTs also have small amounts of debris in their interior as well as on the exterior when compared to other MWCNTs available in the market (Tessonnier et al. 2009).
The experimental assays were conducted in 120 mL serum bottles containing 45 mL of basal medium and 5 mL of inoculum (10 % v/v). Anaerobic basal medium was prepared according to Stams et al., (1993), and its detailed composition can be found in appendix 1. Resazurine (0.5 mg/L) was added as a redox indicator. After distributing the medium, serum bottles were closed with black butyl rubber stoppers and aluminum caps, before being pressurized (by using a manifold) with a gas mixture of 80% H2 and 20% of CO2 for growing the hydrogenotrophic cultures and 80% N2 and 20% CO2 mixture for
growing acetoclastic methanogens. The medium was sterilized by autoclaving at 120 °C, at 1 Bar, during 20 min.
Active methanogenic cultures were maintained for several weeks. The inoculation of test vials was done by using the cultures during their exponential phase. Before inoculation the following solutions were added: sodium bicarbonate (4 g/L) for buffering the medium; salts and vitamins, required for growth (detailed composition is displayed in Appendix I; and sodium sulfide (240 mg/L) to reduce the medium. The bicarbonate solution used for the hydrogenotrophic cultures contained 0.33 g of acetate (approximately 0.17 g/L) which was added to serum bottles containing H2/CO2 for growing hydrogenotrophic
methanogens, serving as an additional carbon source required for growth (Ekiel et al. 1983). For growing M. concilii and M. mazei, acetate was supplemented in a concentration of 20 mM and 10 mM,
respectively. The addition of solutions and inoculation of pure cultures were done under strict anaerobic and sterile conditions. Cultures were then incubated in the dark at 37 °C. For growing hydrogenotrophic cultures, serum bottles were incubated with agitation (120 rpm) in order to improve gas dissolution. Abiotic control assays were prepared as described above (with H2/CO2 and with N2/CO2 + acetate), but
without inoculation with methanogenic archaea.
3.2.2 Analytical methods
Methane and hydrogen accumulated in the bottles headspace were sampled with a gas tight syringe and quantified by gas chromatography (GC) by using a GC BRUKER SCION 456 connected to a TCD detector (MOLSIEVE/PLOT).
Acetate concentrations were determined by high performance liquid chromatography (HPLC) using an HPLC (Jasco, Tokyo, Japan) with a Chrompack column (67H) coupled to a UV detector at 210 nm. For that purpose, liquid samples were taken at the time of inoculation, during exponential phase and during stationary phase, centrifuged and the supernatant filtered by using a syringe filter (0.20 µm). Samples were stored at -20 °C until analysis by HPLC. Redox potential and pH were measured with a mV meter (Consort 533 VWR: 662-1409) and a pH/mV meter (WTW pH7110 VWR: 662-1767), respectively.
3.2.3 Scanning Electron Microscopy (SEM)
At the end of each experiment, samples were prepared for SEM analysis by filtering 1 mL through a 0.20 µm filter. Fixation of the samples was performed with a 2.5% (v/v) glutaraldehyde solution, made in PBS 1x buffer, for 2 hours, in order to stabilize and cross-link organic molecules within the cellular material, thus preserving the morphology and making the cells more resistant to subsequent preparation steps. After washing 3 times with PBS 1x buffer for 15 minutes each, samples were dehydrated through a series of ethanol baths of increasing concentrations (10, 25, 50, 75, 90 and 100% (v/v)) for the duration of 20 minutes each. Samples were then washed with 100% ethanol one last time for 30 minutes. Finally, samples were dried in a desiccator and after sputter coated with Au/Pt to increase conductivity. The electronic microscopic images were obtained with a Leica Cambridge S360 microscope (SEMAT/UM).
3.3
Results
Methane production by acetoclastic and hydrogenotrophic methanogens in the presence of CNT was followed in batch experiments. The obtained results are exposed in the following sections.
3.3.1 Methane production by pure cultures of M. concilii
The results obtained for M. concilii are depicted on Figure 3.1. When M. concilii cultures were incubated with 1 g/L and 5 g/L CNT, the methane production rate was affected as can be observed in Figure 3.1.
Figure 3.1 – Cumulative methane production by the acetoclastic methanogen M. concilii in the presence of different CNT concentrations.
The evolution of lag and exponential phases were similar in the control assay and in the assay containing 1 g/L CNT, while for 5 g/L CNT methane was produced at a slower rate, resulting in a less perceptive exponential phase. Maximum methane yield was reached after 18 days of incubation when M. concilii was exposed to 1 g/L of CNT, while in the presence of 5 g/L about 35 days were necessary for the complete conversion of acetate to methane.
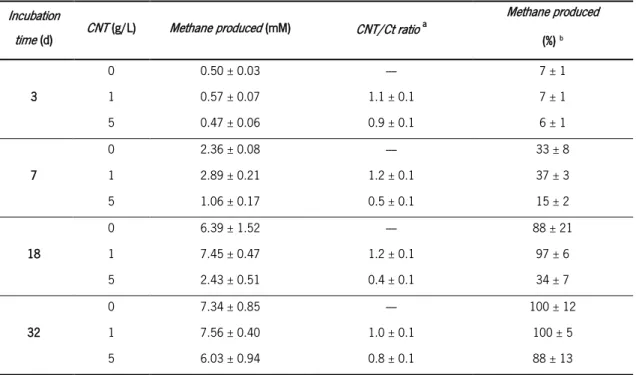
Methane produced by M. concilii after 3, 7, 18 and 32 days of incubation, with and without CNT, is shown in Table 3.1. Three points of interest were chosen for the evaluation of the methane produced by the cultures with and without CNT in order to compare the results obtained. The amount of methane started off similarly within 3 days past the beginning of the assay and after that, results varied according to the concentration of CNT supplied to the cultures. At day 7, the control assay and 1 g/L
0 1 2 3 4 5 6 7 8 9 0 2 4 6 8 10 12 14 16 18 20 22 24 26 28 30 32 34 36 38 CH 4 / m M Time / d 0 g/L CNT 1 g/L CNT 5 g/L CNT
CNT cultures produced 2.36±0.08 mM and 2.87±0.22 mM respectively, while cultures with 5 g/L CNT produced only 1.06±0.17 mM. By the time the 0 g/L and 1 g/L CNT assays reached plateau phase at day 18, they had produced 6.39±1.52 mM and 7.19±0.49 mM respectively, having the 5 g/L CNT cultures produced only 2.43±0.513 mM. This means that the cultures supplied with 1 g/L CNT produced more methane and 5 g/L CNT cultures produced far less, when compared to control cultures.
Table 3.1 – Methane produced by M. concilii when incubated with different CNT concentrations
Incubation
time (d) CNT (g/L) Methane produced (mM) CNT/Ct ratio
a Methane produced (%)b 3 0 0.50 ± 0.03 ---- 7 ± 1 1 0.57 ± 0.07 1.1 ± 0.1 7 ± 1 5 0.47 ± 0.06 0.9 ± 0.1 6 ± 1 7 0 2.36 ± 0.08 ---- 33 ± 8 1 2.89 ± 0.21 1.2 ± 0.1 37 ± 3 5 1.06 ± 0.17 0.5 ± 0.1 15 ± 2 18 0 6.39 ± 1.52 ---- 88 ± 21 1 7.45 ± 0.47 1.2 ± 0.1 97 ± 6 5 2.43 ± 0.51 0.4 ± 0.1 34 ± 7 32 0 7.34 ± 0.85 ---- 100 ± 12 1 7.56 ± 0.40 1.0 ± 0.1 100 ± 5 5 6.03 ± 0.94 0.8 ± 0.1 88 ± 13
aCNT/Ct ratio represents the number of times the production of methane increased relatively to the control assay.
bThe percentage of methane produced was calculated relatively to the maximum methane produced during the experiment, which
correspond to the theoretical methane production expected assuming total conversion of the acetate provided at the beginning of the
incubation.
Acetate was converted to methane by all cultures. The initial and final concentrations of acetate are presented in Table 3.2.
Table 3.2 – Initial and final acetate concentrations detected in M. concilii incubations and final methane concentration obtained
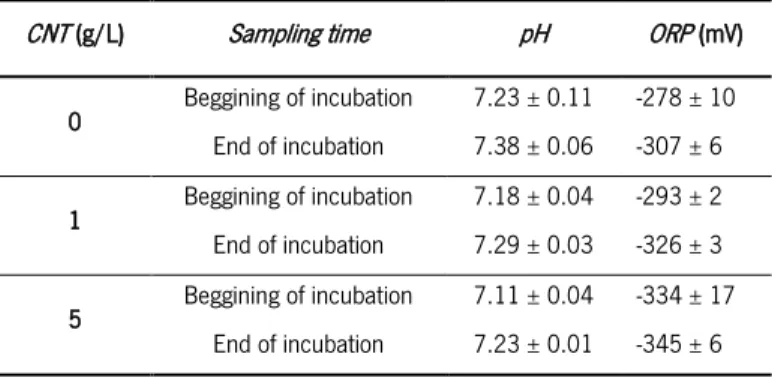
The pH was monitored throughout the assay and showed a tendency to slightly increase from the beginning to the end of the incubation in all assays, with small differences between concentrations of CNT used. The results displayed in Table 3.3 show that redox potential (ORP) values of the growth medium were more negative for higher concentrations of CNT and decreased throughout the experiment.
The results of SEM analysis for each concentration of CNT studied are depicted in Figure 3.2. In the absence of CNT, cells appear to present more extracellular polymeric substances (EPS), than when CNT are present. In Figure 3.2D, the spacer plug that these cells form between them when they connect with each other can be seen. The CNTs have the same aspect in the abiotic assay as in the biotic assays.
Figure 3.2 – SEM analysis of M. concilii with and without CNT. A) abiotic assay with only CNTs displayed with a concentration of 0.5 g/L;
Table 3.3 – pH and ORP values measured in pure cultures containing M. concilii supplied with CNT in different concentrations
CNT (g/L) Sampling time pH ORP (mV)
0 Beggining of incubation 7.23 ± 0.11 -278 ± 10 End of incubation 7.38 ± 0.06 -307 ± 6 1 Beggining of incubation 7.18 ± 0.04 -293 ± 2 End of incubation 7.29 ± 0.03 -326 ± 3 5 Beggining of incubation 7.11 ± 0.04 -334 ± 17 End of incubation 7.23 ± 0.01 -345 ± 6
3.3.2 Methane production by pure cultures of M. mazei
Pure cultures of M. mazei grown with acetate as the substrate behaved differently to the presence of CNT when compared to M. concilii, the other acetoclastic methanogen tested. Methane production by M. mazei is illustrated in Figure 3.3.
This methanogen had a distinct answer when incubated with different concentrations of CNT. While the presence of CNT at a concentration of 1 g/L benefited the overall methane production, the cultures containing 5 g/L of CNT showed a lower methane production rate, when compared to the control cultures growing without CNT. As it can be seen in Figure 3.3, the control assay’s curve of cumulative methane production remained in between both curves of cultures containing CNT, whereas the curves obtained for the cultures incubated with 1 g/L CNT and 5 g/L CNT were higher and lower respectively, for all points measured during incubation time.
Maximum methane yield was achieved earlier in the vials with 1 g/L of CNT, when compared to the others. The cultures supplied with 5 g/L of CNT were the ones that produced methane at a slower rate. Methane produced after 8, 13 and 21 days of incubation are presented in Table 3.4. In an earlier phase (until 8 days of incubation), the amount of methane produced (approximately 2.3 mM) by the cultures incubated with 1 g/L CNT was higher than the amount in control cultures (approximately 1.5 mM), while in the cultures supplied with 5 g/L CNT methane production was lower (approximately 0.9 mM). As the experiment proceeded, the cultures supplied with 1 g/L CNT produced methane always at a higher rate, when compared to the cultures without CNT. However, with 5 g/L of CNT, the pure cultures grew at a slower rate, although in all conditions cultures ended up reaching a similar maximum methane yield by the end of incubation time, after 21 days (Figure 3.3). Nonetheless, cultures with 0
Figure 3.3 – Cumulative methane production by pure cultures of M. mazei in the presence of different CNT concentrations
Acetate was not completely consumed in any of the conditions (Table 3.5). Conversion of acetate to methane was similar for all CNT concentrations, although the cultures supplied with 5 g/L took longer to produce the same amount of methane.
Table 3.4 – Methane production by pure cultures of M. mazei with and without CNT at different time points of the assay
Incubation time (d) CNT (g/L) Methane produced (mM) CNT/Ct ratio a Methane produced (%) b
8 0 1.53 ± 0.38 ---- 7 ± 2 1 2.28 ± 0.14 1.5 ± 0.1 10 ± 1 5 0.89 ± 0.18 0.6 ± 0.1 4 ± 1 13 0 6.28 ± 1.10 ---- 29 ± 5 1 11.57 ± 0.52 1.8 ± 0.1 51 ± 2 5 6.00 ± 0.79 1.0 ± 0.1 28 ± 4 21 0 17.06 ± 0.27 ---- 77 ± 1 1 17.64 ± 0.13 1.0 ± 0.0 80 ± 1 5 15.48 ± 0.66 0.9 ± 0.0 70 ± 4
aCNT/Ct ratio represents the number of times the production of methane increased relatively to the control assay.
bThe percentage of methane produced was calculated relatively to the maximum methane produced during the experiment, which
correspond to the theoretical methane production expected assuming total conversion of the acetate provided at the beginning of the
incubation. 0 2 4 6 8 10 12 14 16 18 20 0 2 4 6 8 10 12 14 16 18 20 22 24 26 28 30 CH 4 / m M Time / d 0 g/L CNT 1 g/L CNT 5 g/L CNT
Table 3.5 – Acetate consumption and methane produced by M. mazei with and without CNT
CNT (g/L) [acetate]i (mM) [acetate]f (mM) [CH4]f (mM)
0 21.90 ± 1.84 1.65 ± 0.36 17.20 ± 0.29
1 22.48 ± 0.70 1.49 ± 0.43 17.80 ± 0.22
5 21.45 ± 1.06 1.41 ± 0.41 17.24 ± 0.27
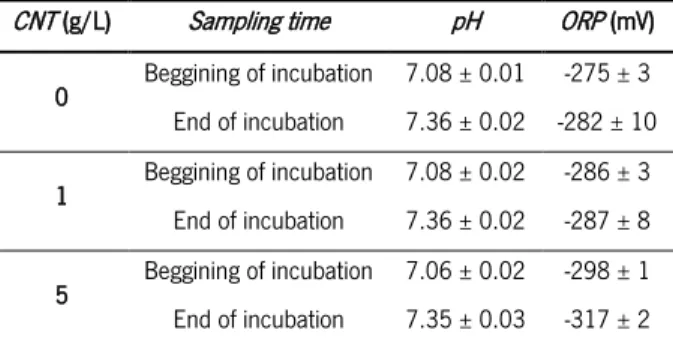
The pH did not vary much during the experiment (Table 3.6). pH measured at the beginning of the incubation was similar in all the assays (7.08 for assays without CNT and with 1 g/L CNT, and 7.06 in the assays with 5 g/L CNT) and slightly increased at the end of the experiment (7.36 for 0 and 1 g/L and 7.35 for 5 g/L). On the other hand, as it was also observed in the M. concilii’s assays, CNT presence seemed to cause a decrease in ORP values.
Throughout the assays with acetoclastic methanogens, pH did not suffer big alterations in either case. There was a very small increase in both cases that evolved very similarly for each of the concentrations of CNT used for both organisms. No major variation of these values was expected in these pure cultures since no products formed in the process which methane is produced through the use of acetate have a direct influence in the pH of the media (Equation 3.2).
SEM electrophotography showed that M. mazei cells appeared as the typical aggregates in the absence of CNT and also in their presence (Figure 3.4). However, in the assays without CNT the cell aggregates seem bigger (formed by a higher number of sarcina cells) while in the assays with CNT smaller aggregates could be observed.
Table 3.6 – pH and ORP values measured throughout the M. mazei assay in the presence of CNT
CNT (g/L) Sampling time pH ORP (mV)
0 Beggining of incubation 7.08 ± 0.01 -275 ± 3 End of incubation 7.36 ± 0.02 -282 ± 10 1 Beggining of incubation 7.08 ± 0.02 -286 ± 3 End of incubation 7.36 ± 0.02 -287 ± 8 5 Beggining of incubation 7.06 ± 0.02 -298 ± 1 End of incubation 7.35 ± 0.03 -317 ± 2
Figure 3.4 – SEM analysis of M. mazei with and without CNT. A) abiotic assay with only CNTs displayed with a concentration of 0.5 g/L; B) M. mazei cultures in the absence of CNT; C) M. mazei cultures with 1 g/L of CNT; D) M. mazei cultures with 5 g/L of CNT.
3.3.3 Methane production by pure cultures of M. formicicum
Pure cultures of M. formicicum were grown in the presence of CNTs. In Figure 3.5, the results of methane production along time can be observed.
As can be observed in Figure 3.5, the behavior of methane production by M. formicicum was different for increasing amounts of CNT. As with other methanogens, M. concilii and M. mazei, higher concentrations of CNT resulted in shorter (almost non-existent in the case of 5 g/L CNT) lag phases. The presence of CNT resulted in a faster growth rate, especially in cultures with 5 g/L CNT, with maximum methane yield being reached earlier than in the other assays, at around 9 days of incubation time. However, cultures containing 1 g/L of CNT only achieved the highest levels of methane after 14 days.