João Elias Valente de Jesus
FPGA based Ultrasound Wireless
Communication System
João Elias Valente de Jesus
FPG
A based Ultr
asound W
ir
eless Communication Sys
Dissertação de Mestrado
Ciclo de Estudos Integrados Conducentes ao Grau de
Mestre em Engenharia Eletrónica Industrial e de Computadores
Trabalho efetuado sob a orientação do
Professor Doutor José Manuel Tavares Vieira Cabral
e coorientação do
Doutor Marcos Silva Martins
João Elias Valente de Jesus
FPGA based Ultrasound Wireless
Communication System
In first place, I would like to express my gratitude to my advisor, Professor Doctor José Manuel Tavares Vieira Cabral, for the orientation and support throw-out this project. Then I would like to thank co-advisor Doctor Marcos Martins for the guidance and support provided during the entire project.
I also would like to thank the Department of Industrial Electronics of Minho University for all necessary conditions and facilities provided to carry out this dissertation.
I also want to express my gratitude to all my friends and colleagues specially Anderson Batista, Carlos Freitas, Cátia Chamusca, Diogo Sousa, Eduardo Barroso, José Teixeira, Marta Teixeira, Nelson Castro, Ricardo Silva, Rui Luz and Sérgio Gonçalves for theirs companionship, spirit of mutual help and support that they gave me during my academic career.
A very special thanks to my family for the unconditional support and patience showed in good and bad times.
Finally, I would like to thank all those who contributed directly and indirectly to this project. Thank you all!
This work focus on the development of a platform for an underwater wireless communication system. The system to be developed is based on acoustic transducers that are projected to emit sound waves at frequencies between 100 kHz and 4 MHz in an underwater environment. The same sensors are capable of being polarized with voltage signals of different amplitudes and, for instance, being used in different modulations.
The underwater environment is considered an unreliable communication medium due to countless factors acting in the propagation of the acoustic waves such as: high attenuation at long distances, low sound speed, and existence of effects like multipath and Doppler Effect.
Those features make it extremely difficult to predict a satisfactory underwater wireless communication condition and enhance the need for the design of a system flexible enough to work in different conditions counteracting different water channel effects. Therefore, the system could not be projected to work at a certain frequency or with a specific modulation technique. This way, the system must work as a high power signal generator.
To successful accomplish this work’s goal an exhaustive survey of all the research in this area were carried out in order to understand how these characteristics may affect the acoustic signals and those effect’s influence on the overall system requirements. Then, the project has been divided in parts such as: FPGA based modulator, digital to analog conversion unit, power amplifier, analog signal input instrumentation, analog to digital conversion unit, FPGA based demodulator and host computer user interface.
After the system being developed, several practical use cases were tested to confirm its functionality and accordance with the initial requirements. Several modular tests were also made to test specific functionalities and ate the end, a on the field test was performed with a PZT ultrasound transducer.
After all the testing it was concluded that the initial goals were meet and the project was concluded with success. The final system was able to polarize an ultrasonic emitter with 60 Vpp and output current greater than 3 A at frequencies superiors to 2 MHz. The same system was also able to receive signals as low as 14 µV from a hydrophone at frequencies above 1 MHz.
O presente trabalho tem como objetivo o desenvolvimento de uma plataforma para comunicações subaquáticas sem fios. O sistema a ser desenvolvido baseia-se em transdutores acústicos que são projetados para emitir ondas sonoras em ambiente subaquático, com frequências entre os 100 kHz e os 4 MHz. Os respetivos sensores são também capazes de serem polarizados com sinais de tensão de variadas amplitudes podendo, portanto, serem utilizados para emitir sinais em diferentes modulações.
O ambiente subaquático é considerado um meio de comunicação problemático devido a inúmeros fatores que afetam a propagação das ondas acústicas no mesmo, tais como: alta atenuação a longas distâncias, a baixa velocidade do som, e a existência de efeitos como o multipath e o Efeito Doppler.
Essas características fazem com que seja extremamente difícil prever as condições de operação naquele meio. Em consequência, há a necessidade de projetar um sistema suficientemente flexível para que o mesmo possa operar em diferentes condições e não ser afetado pelos efeitos do canal aquático. Como tal, o sistema não pode ser projetado para trabalhar a uma determinada frequência ou com uma determinada técnica de modulação. O que implica que o mesmo deve funcionar como um gerador de sinal de alta potência.
Este projeto foi dividido em partes, tais como: modulador baseado em FPGA, a unidade de conversão analógico para digital, amplificador de potência, a unidade de conversão digital para analógico, a instrumentação do sinal analógico, o desmodulador, também baseado em FPGA e a interface de utilizador.
Depois de o sistema ter sido desenvolvido, vários casos de uso prático foram testados para confirmar a sua funcionalidade e verificar se estavam de acordo com os requisitos iniciais. Vários testes modulares foram também feitos para testar funcionalidades específicas bem como testes em ambiente real com um transdutor de ultra-sons PZT.
Após todos os testes concluiu-se que os objetivos iniciais foram cumpridos e o projeto foi concluído com sucesso. O sistema final foi capaz de polarizar um emissor de ultra-som com 60 Vpp e corrente de saída superior a 3 A e a frequências superiores a 2 MHz. O mesmo sistema também foi capaz de receber sinais de amplitude igual a 14 µV a 1 Hz.
ACKNOWLEDGEMENTS ... V ABSTRACT ... IX RESUMO ... XI TABLE OF CONTENTS ... XIII LIST OF TABLES ... XVII LIST OF FIGURES ... XVIII ACRONYMS LIST ...XXIII
1 INTRODUCTION ... 2 1.1 MOTIVATION ... 5 1.2 OBJECTIVES ... 5 1.3 METHODOLOGIES ... 5 1.3.1 Tasks organization ... 6 1.4 DISSERTATION STRUCTURE ... 7 1.5 APPLICATION SCENARIOS ... 7
2 STATE OF THE ART ... 10
2.1 UNDERWATER ACOUSTIC CHANNEL ... 10
2.1.1 Sound propagation and attenuation ... 12
2.1.2 Noise types and sources ... 13
2.2 TYPICAL APPLICATIONS FOR PIEZOELECTRIC ULTRASONIC TRANSDUCERS ... 14
2.3 OVERVIEW OF EXISTING UNDERWATER ACOUSTIC SYSTEMS ... 16
2.4 PIEZOELECTRIC ULTRASONIC EMITTERS ... 17
2.4.1 Ultrasonic projector parameters ... 18
2.5 PIEZOELECTRIC ULTRASONIC RECEIVER ... 19
2.5.1 Existing ultrasonic preamplifiers ... 20
3 SYSTEM ANALYSES ... 22
FPGA based Underwater Wireless Communication System
XIV
3.2.2 Software stack layer ... 26
3.2.3 Physical layer ... 26
3.2.4 Hardware stack layer ... 27
3.3 DEVELOPMENT CONSIDERATIONS ... 28
3.3.1 Hydrophone signal acquisition considerations ... 28
3.3.2 Cable considerations ... 29
3.3.3 Noise considerations ... 30
3.3.4 Preamplifier considerations ... 30
3.3.5 Variable gain amplifier considerations ... 30
3.3.6 Variable gain control unit considerations ... 31
3.3.7 ADC considerations ... 31
3.3.8 Demodulator considerations ... 32
3.3.9 Modulator considerations ... 32
3.3.10 DAC considerations ... 32
3.3.11 High frequency power electronics considerations ... 32
3.3.12 Logic system considerations ... 34
3.3.13 Firmware considerations ... 34
3.3.14 USB communication considerations ... 34
3.3.15 Application level considerations ... 35
3.4 POWER CONSIDERATIONS ... 35
4 SYSTEM DESIGN ... 38
4.1 INSTRUMENTATION DESIGN ... 38
4.1.1 ADC module ... 39
4.1.2 Antialiasing filter ... 40
4.1.3 Variable gain amplifier unit ... 41
4.1.3.1 Low noise amplifier ... 43
4.1.3.2 Decoupling filters ... 44
4.1.3.3 Ferrite bead ... 45
4.1.4 High pass filter ... 46
4.1.5 Hydrophone selection ... 47 4.1.6 DAC ... 47 4.1.6.1 Analog output ... 48 4.1.6.2 RF transformer ... 49 4.1.7 Voltage regulators ... 50 4.1.7.1 Buck Converter ... 50 4.1.7.2 Buck-Boost converter ... 51 4.1.8 Instrumentation cooling ... 51
4.2.1 Boost converter ... 53
4.2.2 Power amplifier ... 54
4.2.3 Input signal isolation and filtering ... 55
4.2.4 Operational amplifiers ... 56
4.2.4.1 Virtual ground and voltage regulators ... 57
4.3 FPGA MODULE ... 58
4.4 LOGIC SYSTEM DESIGN ... 61
4.4.1 Demodulator ... 62
4.4.2 Variable gain controller ... 62
4.4.3 Modulator... 63
4.4.4 Interface layer ... 63
4.5 SOFTWARE DESIGN ... 64
4.6 FIRMWARE DESIGN ... 65
5 SYSTEM IMPLEMENTATION ... 68
5.1 SINGLE MODULES PROTOTYPING ... 68
5.1.1 DAC prototype ... 69
5.1.2 ADC prototype ... 70
5.1.3 Voltage regulator prototype ... 71
5.1.4 Power emitter prototype ... 72
5.1.5 Spartan 3 prototype ... 73
5.2 FULL SYSTEM PROTOTYPE ... 74
5.2.1 Instrumentation circuitry ... 74 5.2.1.1 DAC ... 74 5.2.1.2 ADC ... 75 5.2.1.3 Antialiasing LPF ... 75 5.2.1.4 VGA ... 76 5.2.1.5 Analog multiplexer ... 76
5.2.1.6 Fixed gain amplifiers ... 77
5.2.1.7 Hydrophone selector system ... 77
5.2.2 PCB ... 78
5.3 FINAL PCB DESIGN ... 79
5.4 POWER EMITTER IMPLEMENTATION ... 80
5.4.1 Power emitter circuit design ... 80
5.4.2 Power emitter PCB design ... 81
5.5 SOFTWARE IMPLEMENTATION ... 83
FPGA based Underwater Wireless Communication System
XVI
5.7.1.1 VGA controller unit implementation ... 87
5.7.2 Modulator unit implementation ... 88
5.8 SYSTEM INTEGRATION ... 89
6 TESTS AND RESULTS ... 92
6.1 HOST APPLICATION RESULTS ... 93
6.2 MICROCONTROLLER RESULTS ... 93
6.3 LOGIC SYSTEM RESULTS ... 93
6.4 DAC RESULTS ... 94 6.5 INSTRUMENTATION RESULTS ... 95 6.5.1 Maximum attenuation ... 95 6.5.2 Small Gain ... 96 6.5.3 Large gain ... 97 6.6 ADC RESULTS ... 97
6.7 POWER AMPLIFIER RESULTS ... 98
6.7.1 Recommended safety precautions ... 98
6.7.2 Power amplifier frequency response ... 99
6.8 ON THE FIELD RESULTS ...100
6.8.1 Power amplifier noise reduction ...101
7 CONCLUSIONS AND FUTURE WORK ... 104
7.1 CONCLUSIONS ...104
7.2 FUTURE WORKS ...105
List of Tables
TABLE 2-1:TRANSDUCER CAPACITANCE. ... 18
TABLE 3-1:TRANSDUCERS POWER CONSUMPTION. ... 32
TABLE 4-1:ADC’S OUTPUT DATA FORMAT. ... 39
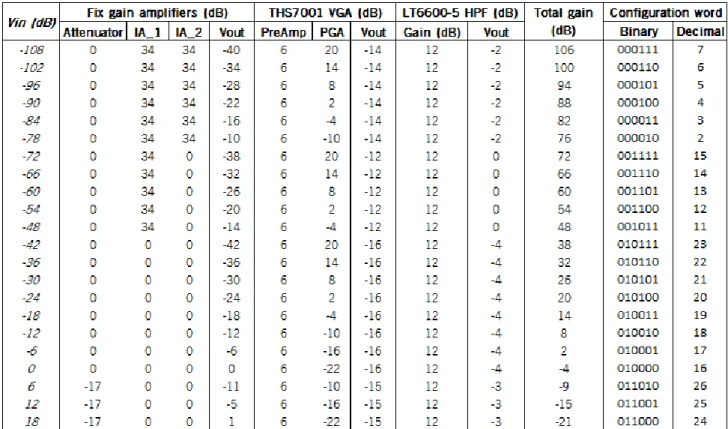
TABLE 4-2:NOMINAL GAIN/ATTENUATION ... 41
TABLE 4-3:VGA UNIT GAIN CONFIGURATION. ... 42
TABLE 4-4:INPUT CODING VERSUS ANALOG OUTPUT CURRENT. ... 48
TABLE 5-1:MICROCONTROLLER PINOUT. ... 84
TABLE 5-2:DEMODULATOR UNIT I/O INTERFACE. ... 85
TABLE 5-3:DEMODULATOR UNIT MICROCONTROLLER INTERFACE. ... 85
TABLE 5-4:DEMODULATOR UNIT ELECTRONICS CONNECTIONS. ... 86
TABLE 5-5:DEMODULATOR INTERFACE. ... 86
TABLE 5-6:VGAU HARDWARE INTERFACE... 86
TABLE 5-7:MODULATOR UNIT MICROCONTROLLER INTERFACE. ... 88
TABLE 5-8:MODULATOR UNIT ELECTRONICS CONNECTIONS. ... 89
FPGA based Underwater Wireless Communication System
XVIII
List of Figures
FIGURE 1-1:HOW DOLPHINS ECHOLOCATE [2] ... 2
FIGURE 1-2:FIRST MEASUREMENT OF SOUND SPEED ON [3]. ... 3
FIGURE 1-3:A TYPICAL SOSUS WATCH FLOOR[5]... 4
FIGURE 2-1:COMMUNICATION PROCESS ELEMENTS. ... 10
FIGURE 2-2:TRANSMISSION LOSS AS FUNCTION OF RANGE FOR THE FREQUENCIES OF 0,25,50,100 AND 200 KHZ [10]. ... 11
FIGURE 2-3:UNDERWATER CHANNEL EQUIVALENT MODEL... 11
FIGURE 2-4:ATTENUATION AS FUNCTION OF FREQUENCY AND DISTANCE [9]. ... 12
FIGURE 2-5:DIFFERENT SOURCES OF NOISE IN THE OCEAN [13]. ... 13
FIGURE 2-6:PRINCIPLE OF AN ACTIVE SONAR [14]. ... 14
FIGURE 2-7:FISH FINDER SONAR [16]. ... 15
FIGURE 2-8:EXAMPLE OF A SONAR FISH FINDER. ... 16
FIGURE 2-9:UNDERWATER RECORDING SYSTEMS ... 16
FIGURE 2-10:PVDF4X28µM (LEFT),PZT110µM (TOP),PVDF110µM (RIGHT), ... 17
FIGURE 2-11:CCHULTRASONIC TRANSDUCER FAMILY... 17
FIGURE 2-12:CCH-5938D-25LB ULTRASONIC EMITTER. ... 18
FIGURE 2-13:SQ48BROADBAND HYDROPHONE. ... 19
FIGURE 2-14:C304XRHYDROPHONE... 19
FIGURE 2-15:AQ-201PREAMPLIFIER ... 20
FIGURE 2-16:SA03DIFFERENTIAL PREAMPLIFIER ... 20
FIGURE 3-1:UML USE CASE DIAGRAM... 23
FIGURE 3-2:SYSTEM STRUCTURE. ... 24
FIGURE 3-3:HARDWARE CONNECTION BETWEEN SYSTEM LAYERS. ... 25
FIGURE 3-4:APPLICATION LAYER ... 26
FIGURE 3-5:PHYSICAL LAYER ... 26
FIGURE 3-6:HARDWARE LAYER ... 27
FIGURE 3-7:CETACEAN RESEARCHTM HYDROPHONE PINOUT. ... 29
FIGURE 3-9:ANTIALIASING FILTERING REQUIREMENTS. ... 31
FIGURE 3-10:CAPACITOR CURRENT CONSUMPTION OVER FREQUENCY ... 33
FIGURE 4-1:INSTRUMENTATION MODULES DIAGRAM. ... 38
FIGURE 4-2:ADC IN 2VPP DIFFERENTIAL INPUT. ... 39
FIGURE 4-3:LT6600-5GAIN PLOT... 40
FIGURE 4-4:LT6600-5NOISE DENSITY PLOT. ... 40
FIGURE 4-5:LT6600-5CONFIGURATION CIRCUITRY. ... 40
FIGURE 4-6:THS7001BLOCK DIAGRAM. ... 41
FIGURE 4-7:VGA UNIT DIAGRAM. ... 43
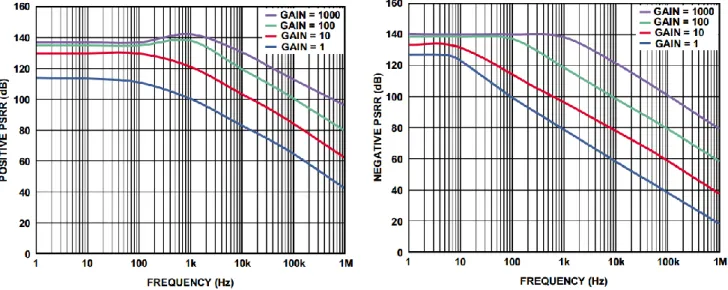
FIGURE 4-8:NOISE SPECTRAL DENSITY VS.FREQUENCY. ... 43
FIGURE 4-9:GAIN VS. FREQUENCY. ... 43
FIGURE 4-10:POSITIVE PSRR VS.FREQUENCY. ... 44
FIGURE 4-11:NEGATIVE PSRR VS.FREQUENCY. ... 44
FIGURE 4-12: DECOUPLING CAPACITORS CONFIGURATION... 44
FIGURE 4-13:B-20F-57 IMPEDANCE VS FREQUENCY. ... 45
FIGURE 4-14:HPF CIRCUIT. ... 46
FIGURE 4-15:MAGNITUDE AND PHASE OF THE HPF’S TRANSFER FUNCTION. ... 46
FIGURE 4-16:HYDROPHONE SELECTION SYSTEM. ... 47
FIGURE 4-17:DIFFERENTIAL OUTPUT CONFIGURATION USING AN RF TRANSFORMER. ... 48
FIGURE 4-18:COILCRAFT TTW TRANSFORMER FAMILY PACKAGING. ... 49
FIGURE 4-19:TTWB2040 TRANSFORMER FREQUENCY RESPONSE. ... 49
FIGURE 4-20:LM2596 CONFIGURATION CIRCUIT. ... 50
FIGURE 4-21:PTN78000A CONFIGURATION. ... 51
FIGURE 4-22:POWER ELECTRONICS MODULE DIAGRAM. ... 52
FIGURE 4-23:600W10-60V TO 12-80VBOOST CONVERTER. ... 53
FIGURE 4-24:BJTS H-BRIDGE. ... 54
FPGA based Underwater Wireless Communication System
XX
FIGURE 4-27:ANALOG INPUT SIGNAL PATH. ... 55
FIGURE 4-28:LM7171 OPEN LOOP FREQUENCY RESPONSE. ... 56
FIGURE 4-29:ANALOG INPUT SIGNAL PATH WITH THE LM7171 GAIN. ... 56
FIGURE 4-30:LM675 IN A VOLTAGE FOLLOWER CONFIGURATION. ... 57
FIGURE 4-31:MC7818CTG CONFIGURATION CIRCUIT. ... 57
FIGURE 4-32:MC7918CTG CONFIGURATION CIRCUIT ... 57
FIGURE 4-33:USB-FPGAMODULE 1.15D WITH SPARTAN 6. ... 58
FIGURE 4-34:USB-FPGAMODULE 1.15D CLOCK DIAGRAM [26]. ... 59
FIGURE 4-35:POWER SUPPLY MODULE 1.2 FROM ZTEXGMBH... 60
FIGURE 4-36:USB-FPGAMODULE 1.15D 3.3VDC/DC CONVERTER. ... 60
FIGURE 4-37:SYSTEM GENERATOR COMPILATION SETTINGS. ... 61
FIGURE 4-38:SYSTEM GENERATOR CLOCKING SETTINGS ... 61
FIGURE 4-39:DEMODULATOR MODULE INTERFACE. ... 62
FIGURE 4-40:VGA CONTROL UNIT MODULE INTERFACE. ... 62
FIGURE 4-41:MODULATOR MODULE INTERFACE. ... 63
FIGURE 4-42:LOGIC SYSTEM INTERFACE. ... 63
FIGURE 4-43:HOST APPLICATION FLOWCHART. ... 64
FIGURE 4-44:MICROCONTROLLER FIRMWARE FLOWCHART. ... 65
FIGURE 5-1:ADC ADAPTER BOARD. ... 68
FIGURE 5-2:DAC ADAPTER BOARD ... 68
FIGURE 5-3:DAC PROTOTYPE CIRCUIT. ... 69
FIGURE 5-4:DAC PROTOTYPE PCB PREVIEW. ... 69
FIGURE 5-5:DAC PROTOTYPE PCB. ... 69
FIGURE 5-6:ADC PROTOTYPE SCHEMATIC. ... 70
FIGURE 5-7:ADC PROTOTYPE PCB PREVIEW. ... 70
FIGURE 5-8:ADC PROTOTYPE PCB. ... 70
FIGURE 5-9:VOLTAGE REGULATOR PROTOTYPE SCHEMATIC. ... 71
FIGURE 5-11:VOLTAGE REGULATOR PROTOTYPE PCB. ... 71
FIGURE 5-12:POWER EMITTER PROTOTYPE SCHEMATIC. ... 72
FIGURE 5-13:POWER EMITTER PROTOTYPE PCB PREVIEW. ... 72
FIGURE 5-14:POWER EMITTER PROTOTYPE PCB. ... 72
FIGURE 5-15:SPARTAN 3 ADAPTER FOR DAC AND ADC PROTOTYPES. ... 73
FIGURE 5-16:SPARTAN 3 PROTOTYPE SETUP. ... 73
FIGURE 5-17:ADAPTER BOARDS FOR AD8429,AD8184,THS7001 AND LT6600-5. ... 74
FIGURE 5-18:DAC CIRCUIT. ... 74
FIGURE 5-19:ADC CIRCUIT. ... 75
FIGURE 5-20:ANTIALIASING LPF CIRCUIT. ... 75
FIGURE 5-21:VGA CIRCUIT. ... 76
FIGURE 5-22:ANALOG MULTIPLEXER CIRCUIT. ... 76
FIGURE 5-23:INSTRUMENTATION AMPLIFIERS CIRCUITS. ... 77
FIGURE 5-24:HYDROPHONE INPUT SELECTOR SWITCH. ... 77
FIGURE 5-25:FULL SYSTEM PROTOTYPE PCB. ... 78
FIGURE 5-26:FULL SYSTEM PROTOTYPE SETUP. ... 78
FIGURE 5-27:FINAL SYSTEM PCB PREVIEW. ... 79
FIGURE 5-28:FINAL SYSTEM PCB. ... 79
FIGURE 5-29:FINAL SYSTEM SETUP. ... 79
FIGURE 5-30:INPUT LPF AND RF TRANSFORMER SCHEMATIC. ... 80
FIGURE 5-31:OPERATIONAL AMPLIFIER AND POWER PUSH-PULL SCHEMATIC. ... 80
FIGURE 5-32:OPERATIONAL AMPLIFIER’S VOLTAGE REGULATORS AND VIRTUAL GROUND SCHEMATICS. ... 81
FIGURE 5-33:POWER AMPLIFIER PCB PREVIEW. ... 81
FIGURE 5-34:POWER AMPLIFIER PCB. ... 82
FIGURE 5-35:COOLER AND FAN SETUP. ... 82
FIGURE 5-36:JAVA CODDING FOR THE HOST ECHO APPLICATION. ... 83
FPGA based Underwater Wireless Communication System
XXII
FIGURE 5-39:DEMODULATOR UNIT DETAILS. ... 86
FIGURE 5-40:VGAU CONFIGURATION WORD SELECTION. ... 87
FIGURE 5-41:ANALOG GAIN VS. SELECTED MEMORY INDEX. ... 87
FIGURE 5-42:MODULATOR UNIT MICROCONTROLLER INTERFACE. ... 88
FIGURE 5-43:MODULATOR UNIT DETAILS. ... 88
FIGURE 5-44:FINAL SYSTEM INTEGRATION. ... 89
FIGURE 6-1:PICOSCOPE 2200SERIES. ... 92
FIGURE 6-2:DAC OUTPUT AT 200 KHZ SINE WAVE. ... 94
FIGURE 6-3:DAC OUTPUT AT 1MHZ SINE WAVE ... 94
FIGURE 6-4:DAC OUTPUT AT 4MHZ SINE WAVE. ... 94
FIGURE 6-5:VGA UNIT AS ATTENUATOR. ... 95
FIGURE 6-6:VGA UNIT AS 14 DB AMPLIFIER AT 1MHZ... 96
FIGURE 6-7:VGA UNIT AS 14 DB AMPLIFIER AT 2MHZ... 96
FIGURE 6-8:VGA UNIT AS 100 DB AMPLIFIER AT 1MHZ. ... 97
FIGURE 6-9:ADC’S OTR SIGNAL. ... 97
FIGURE 6-10:ELECTRICAL SAFETY SIGN. ... 98
FIGURE 6-11:AMPLIFIER OUTPUT VOLTAGE AT 1MHZ. ... 99
FIGURE 6-12:AMPLIFIER OUTPUT VOLTAGE AT 2MHZ. ... 99
FIGURE 6-13:PZT2 MM. ...100
FIGURE 6-14:EMITTER 5 AT 20V1MHZ PULSE. ...100
FIGURE 6-15:POWER SUPPLY NOISY OPERATION MODE. ...101
ADC Analog to Digital Converter
AUVs Autonomous Underwater Vehicles
BJT Bipolar Junction Transistors
BPF Band Pass Filter
DAC Digital to Analog Converter
DFS Digital Format System
FIFO First In, First Out
FPGA Field-Programmable Gate Array
GPIO General Purpose I/O
HPF High Pass Filter
I/O Input/Output
IC Integrated Circuit
LCD Liquid Crystal Display
LOFAR Low Frequency Analysis and Recording
LPF Low Pass Filter
NAVFACs Naval Facilities
ONR Office of Naval Research
OSI Open Systems Interconnection
OTR OuT-of-Range
PCB Printed Circuit Board
PGA Programmable Gain Amplifier
PSRR Power Supply Rejection Ration
PT Lead Titanate
PVDF PolyViyliDeneFluoride
PZN Lead Zinc Niobate
PZT Lead Zirconate Titanate
SIO Special I/O
FPGA based Underwater Wireless Communication System
XXIV
ULNA Ultra-Low Noise Amplifier
USB Universal Serial Bus
UUVs Unmanned Underwater Vehicles
VGA Variable Gain Amplifier
VGAU Variable Gain Amplifier Unit
FPGA based Underwater Wireless Communication System
2
1
Introduction
Sound is produced when an object vibrates disturbing nearby air, liquid or solid molecules, and generating compression waves that travel in all directions away from the source. Those waves are perceived as sound when they collide with a human or an animal ear drum and causing a mechanical disturbance that is detected by neurons in the internal ear.
Sound can vary in frequency (high pitch vs. low pitch), amplitude (loudness), and periodicity (the temporal pattern of frequency and amplitude). Together, these three variables can create a complex variety of signals, from an insect's noise to human voice and vocal music. Since sound waves propagate rapidly through air and water, (about 331 m/sec) and (about 1500 m/sec), respectively, acoustic signals can be quickly started, stopped, or modified to send a message.
The human ear is able to detect, at best, sound frequencies within the range of about 20-20,000 hertz (vibrations per second). But some insects (as well as other animals like bats and dolphins) produce and detect sounds that are above this frequency range. Some grasshoppers and moths, for instance, produce ultrasonic sounds around 80 kHz and dolphins can hear frequencies as high as 150 kHz [1].
Dolphins use sound waves to echolocate (Figure 1-1) food in the sea and it involves emitting and interpreting sounds to detect objects’ location underwater and is especially useful for two reasons: Bodies of water are often far too murky for sight, and sound actually travels quickly underwater, much faster than in air [2].
Dolphins use sound waves to communicate between them. Communication via acoustic waves has such advantages as effectiveness in long-range, doesn't need line of sight, but also has its disadvantages such as: reveals the sender's location, it's less effective in noisy environments and suffers high attenuation with distance. These advantages and disadvantages have paved the way for the exploration of the sound properties for military purposes such as the SOund, NAvigation and Ranging (SONAR). Sonar is a system that uses transmitted and reflected underwater sound waves to detect and locate submerged objects or measure distances underwater. It has been used for submarine and mine detection, depth detection, commercial fishing, diving safety and communication at sea. The Sonar device sends out a subsurface sound wave and then listens for the returning echoes.
As early as 1822, Daniel Colloden used an underwater bell to calculate the speed of sound underwater in Lake Geneva, Switzerland. It was concluded that the velocity of sound in water was 1435 m/s. This value is not too different from currently known values and it led to the invention of dedicated sonar devices by other inventors later on [3].
Figure 1-2: First measurement of sound speed on [3].
A century later, by early 1950, Frederick Hunt, the head of Harvard University’s Underwater Sound Laboratory during WWII, argued that the U.S. Navy could use the SOund Fixing and Ranging (SOFAR) channel to
FPGA based Underwater Wireless Communication System
4
Under great secrecy, late in 1950, the Office of Naval Research (ONR) developed an undersea surveillance system designed to detect and track Soviet submarines using the SOFAR channel. The system that resulted was given the then highly classified name SOund Surveillance System (SOSUS).
Several arrays of hydrophones were placed at the ocean bottom. The hydrophones were connected by underwater cables to processing centers located on shore called “Naval Facilities” (NAVFACs) and then, Low Frequency Analysis and Recording (LOFAR) instruments installed at the NAVFACs were designed to analyze low-frequency underwater sounds to show which frequencies were present. The distinctive sound signatures generated by submarines could then be seen in what were called LOFAR-grams.
Figure 1-3 depicts a typical SOSUS watch floor. This one, at Centerville Beach, held hundreds of LOFAR “gram-writers,” each turning out a frequency-versus-time representation of an array’s low-frequency sound output along a given beam direction [5].
Figure 1-3: A typical SOSUS watch floor[5].
The SOSUS system was very successful in detecting and tracking the noisy diesel and then nuclear Soviet submarines of the Cold War. And, in October 26, 1962 after the SOSUS station on Turks Island makes a contact. The submarine, the C-20, was identified as a Soviet "F" class and it was forced to surrender [6]. From then on, the water was not a place where a submarine could dive undetected or hide, anymore.
This episode of undersea warfare brought up the importance of the underwater environment as a medium capable to transmit and receive acoustic signals. After that, the water as a communication channel has gain major importance in several fields, especially in the military. However, industrial scientific and medical progresses were made as a result of that.
1.1
Motivation
Along with the ever increasing list of applications for underwater acoustic communications systems, the used transducers were also improved over the times. From the bell, used by Daniel Colloden in 1822, to calculate the speed of sound underwater in Lake Geneva [3], to the 1 Mbps piezoelectric transducer, developed by Marcos Martins, in he’s PhD Thesis [7], plenty of water went under the bridge.
The proliferation of piezoelectric transducers posed a challenge for the hardware developers to take full advantage of those transducers, especially in systems where operation covers a wide band of frequencies. This dissertation work aims to take on these challenges and develop a hardware system to match the requirements specified by Marcos Martins [7].
At the academic level, this project represents a fantastic opportunity to develop a multidisciplinary system. It also poses an interesting challenge at the integration level, because it provides an opportunity to work on a Hardware/Software co-design approach, making it a great opportunity to put into practice concepts learned during the course by the author. Therefore, more than an academic task, it represents a personal challenge and provides an excellent opportunity to integrate an active and dynamic team with a good work ethic.
1.2
Objectives
The goal of this dissertation is to develop an electronic system capable of driving the piezoelectric ultrasound emitters developed by Marcos da Silva Martins, at he’s PhD Thesis, Ultrasonic Wireless Broadband Communication System for Underwater Applications, presented in 2013 at Minho University [7].
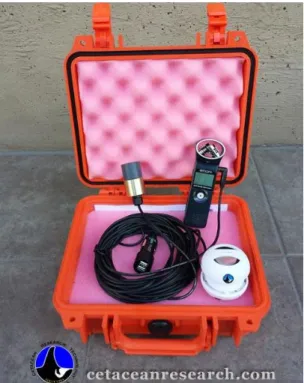
Those transceivers must be driven by a power circuit that generates a 30Vpp sinusoidal signal at 4 MHz. The system must also acquire acoustic signals using a Cetacean ResearchTM C304XR hydrophone, which
generates a signal of frequency between 100 kHz and 4 MHz with 11.2 V maximum amplitude.
1.3
Methodologies
To successfully accomplish this dissertation’s goal, the project was analyzed in different phases, at different levels in a bottom-up approach. This approach aimed to reduce the complexity of the overall project into smaller and independent systems. To accomplish that, the work was processed in different phases, such as: research, analysis, design, development, testing and documenting. In the documentation phase, the overall
FPGA based Underwater Wireless Communication System
6
1.3.1
Tasks organization
The first phase of the current work was essentially a research phase that was performed in two main tasks. The first consisted in a research of the underwater acoustic communications systems state of the art, its technologies and transducers types being used. At this phase, the acoustic transducers to be used were characterized. The second task was a research on important theoretical concepts required to develop high frequency electronics, as well as the challenges faced when developing high speed mixed signal electronics, such as: power amplifiers, instrumentation, logic circuits.
The second phase, consists on an in-depth analysis of the system developed and its requirements. At this phase, technical and non-technical constraints were discussed based on the functional requirements. The use-cases were also presented in order to be used as guidelines for the following stages.
At the third phase, the design of a solution for the entire system was presented. From this phase on the system was viewed as a group of simpler systems, from the software layer all the way down to the instrumentation and power electronics. Therefore, solutions for desktop application, microcontroller firmware, FPGA’s (Field-Programmable Gate Array) bitstream, Analog to Digital Converter (ADC) and Digital to Analog Converter (DAC)’s instrumentations and the power electronics were designed and simulated.
The fourth phase, implementation, was composed by several tasks which aimed to implement independently the subsystems designed in the previous phase, such as: the desktop application in Java, the microcontroller firmware in C language, the logic programing in Matlab/Simulink, the digital-to-analog conversion, the analog-to-digital conversion, the instrumentation, the signal amplification and the power electronics.
At the integration phase, all subsystems were connected together and then tested for functionality and robustness. These tests were conducted in a convenient environment, using different transducers. At the end, results of each category were presented and both instrumentation and power amplification circuits were tested and characterized.
At the last phase, some conclusions were drawn about the achieved results. This conclusion aimed to describe which goals were achieved, which weren’t and why.
1.4
Dissertation structure
For documentation purposes, the document is structured in seven chapters.
Chapter 1, Introduction;
Chapter 2, state-of-the-art.
Chapter 3, System analysis;
Chapter 4, System design;
Chapter 5, System implementation.
Chapter 6, Results;
Chapter 7, Conclusion and future work;
1.5
Application scenarios
Despite the communication capability of the system under development, the same system could be applied in a variety of different applications, such as:
Marine life listening;
Ocean mapping;
Divers communications (diver to diver or diver to ship);
Information exchange (underwater Internet through Underwater Sensor Nodes (USNs));
Underwater surveillance applications;
Underwater Wireless Video Transmission;
Assisted or Autonomous navigation (Unmanned Underwater Vehicles (UUVs) or Autonomous Underwater Vehicles (AUVs)).
The oceans research being made today needs Underwater Autonomous Vehicles (UAVs) to reach the most extreme, dangerous and deep places in the sea. Therefore, those vehicles need to be able to be remotely controlled and also retrieve the collected data in real-time.
Sensor networks for the industry are other application for this system. Industrial resources exploration can use sensor networks for monitoring the platforms and their machinery in the sea. Divers often need to communicate between each other to minimize risk and to be able to exchange information underwater. Other applications may include video and audio streaming [8].
FPGA based Underwater Wireless Communication System
10
2
State of the art
A communication process takes place throw-out three basic elements that must be present in a communication system. Without these, the communication process won’t work. These elements are: the emitter, the transmission channel and the receiver (Figure 2-1). The emitter converts a signal produced by an information source into an appropriate form to its propagation through the channel. The receiver captures the signal from the transmission channel and extracts its information content [9].
Figure 2-1: Communication process elements.
There are several types of transmission channels but, for this project, the focus is in the underwater channel. By underwater channel it should be understood any considerable large enough volume water, such as a fish tank, a swimming pool, a lake or the ocean.
2.1
Underwater acoustic channel
Since acoustic waves are subjected to low attenuation in water [10], they are considered as being preferable for this environment, especially in deep waters with stable thermal conditions. However, despite the advantages of acoustic communication in underwater environments, when compared to optical and radio, the propagation of sound also has significant challenges that influence the development of underwater acoustic communication systems. This is mainly due to the slow of acoustic propagation in water (about 1500 m/s).
When studying sound propagation in the underwater channel, phenomena like attenuation, ambient noise, Doppler Effect, propagation delay and multipath must be taken into account to accurately modulate it. However, for this dissertation work, only attenuation and ambient noise will be taken into consideration.
With the increase of the frequency, it is possible to increase the data-rate, but it also increases the attenuation, leading to a decrease in communication range, because underwater acoustic signals are
frequency-dependent attenuated (Figure 2-2) and an increase in attenuation leads to a signal weakening at the reception point, which leads to a degradation in the Signal-to-Noise Ratio (SNR).
Figure 2-2: Transmission loss as function of range for the frequencies of 0, 25, 50, 100 and 200 kHz [10]. These limitations set the maximum range at which a system is capable of operating. Because of that, a compromise between bandwidth and range has to be achieved.
The underwater channel equivalent model used for this dissertation’s purposes can be seen in Figure2-3 which depicts a signal being affected by a gain and noise, which represents the attenuation and ambient noise adding to a noise signal when it travels in water.
Figure 2-3: Underwater channel equivalent model.
Based on this model, shown in, Figure 2-3, the signal 𝑆𝑅 received by a certain hydrophone, represents the emitted signal 𝑆𝐸 multiplied by the attenuation plus the ambient noise.
FPGA based Underwater Wireless Communication System
12
2.1.1
Sound propagation and attenuation
Attenuation is one of the most important properties regarding underwater acoustic channels because it is present in all types of underwater environments, and its value increases with an increase in distance and frequency [9].
Attenuation is made up of three main components: spreading loss, absorption loss and scattering loss [11] but, for this dissertation’s purposes, the attenuation that occurs in an underwater acoustic channel over a distance 𝑙, for a signal of frequency 𝑓 is given by equation 2, where 𝑘 is the spreading factor, which describes the geometry of propagation (typically 1.5 is used for practical spreading) [12], and 𝑎(𝑓) is the absorption coefficient, expressed in dB.
𝐴(𝑙, 𝑓) = 𝑙𝑘𝑎(𝑓)𝑘 (2)
Figure 2-4 shows how distance and frequency affects the attenuation of a signal under water. It can be seen that a 1 MHz signal suffers an attenuation of 350 dB when transmitted at a distance of 1 km. For lower frequencies, for instance 500 kHz, attenuation is only 150 dB.
2.1.2
Noise types and sources
The noise present in an underwater acoustic channel can be classified in three types: man-made noise, site-specific noise and ambient noise. The man-made noise is made by human activities such as noise of machines, submarines and vassals. The site-specific noise exists only in certain places. The ambient noise is due to turbulence, rain, breaking waves, and maritime activity [9], Figure 2-5 shows some sources of noise existing in aquatic environments.
FPGA based Underwater Wireless Communication System
14
2.2
Typical applications for piezoelectric ultrasonic transducers
A transducer is a device that converts a signal in one form of energy to another form of energy. There is two types of piezoelectric ultrasonic transducers; the emitters or projectors and the receivers or hydrophones.
An ultrasonic emitter (or projector) converts electrical energy into mechanical energy and needs an external voltage source to operate, therefore consuming energy, while an ultrasonic receiver (or hydrophone) generates a signal when excited by a mechanical wave, i.e, converts mechanical energy into electrical energy.
Applications for ultrasound transducers range from military devices to medical imaging and industrial applications. Military devices, for example, such as the underwater SONAR system, uses sound waves to navigate, detect objects on or under water, such as other submarines.
In case of a SONAR, a signal is converted into acoustic waves by an underwater transducer, and sent through water. When the acoustic wave strikes something such as a fish or an object, it is reflected back. Then it is acquired and analyzed to decode useful information such as: size, composition, and shape of the object. The exact extent of what can be discerned depends on the frequency, power of the signal transmitted and sensitivity of the hydrophone being used.
Two types of technology share the name sonar: passive sonar is essentially listening for the sound made by vessels, submarines or fish and active sonar (Figure2-6) which emits pulses of sounds and listens for its echoes.
In the cleaning industry, ultrasonic transducers are commonly used in small tabletop ultrasonic cleaners and medical applications like dental offices. This cleaning activity is based on the cavitation and implosion effect and as a result of ultrasonic activity displace and remove loosely held contaminants such as dust from surfaces. This method presents the advantage of not using any extra chemical product [15].
In sonars, the acoustic signal has low frequency and can reach several tens of kilometers. On the other hand, medical imaging works with higher frequencies, reaching hundreds of MHz, with signals reaching just few centimeters. Figure 2-7 depicts the operation of fish finder sonar.
For underwater communications, systems operate in frequencies between sonar and medical applications because of range requirements, making a tradeoff between range and frequency.
FPGA based Underwater Wireless Communication System
16
2.3
Overview of existing underwater acoustic systems
Ultrasonic transducers are used in a variety of applications. This applications range from military SONARs, fish-finder SONARs, seabed mapping SONARs, marine life listening devices and underwater communication systems.
From a structural point of view, these devices include some common parts, namely: a human interface device, usually a Liquid Crystal Display (LCD), a signal generator, a projector and (or) a hydrophone and a signal analyzer.
In the case of SONARs, the systems include a projector and a hydrophone, or use a single transducer acting as an emitter and receiver (Figure 2-8), while marine life listening devices only use a hydrophone and electronics to amplify the collected signal. Figure 2-9 represents a Cetacean Research Technology's SQ26-H1 Portable Underwater Recording System that includes a hydrophone and a digital recorder.
2.4
Piezoelectric ultrasonic emitters
A piezoelectric actuator generates a displacement when subjected to an electric field. This displacement is capable of applying a force and, therefore, the actuator is capable of doing work in the form of an acoustic wave.
There are several materials available for ultrasound transducers, such as: the Lead Zirconate Titanate (PZT), Lead Titanate (PT) and Lead Zinc Niobate (PZN) ceramics and Polyviylidenefluoride (PVDF) [11]. This study will focus on PZT ceramic and PVDF polymer transducers Figure 2-10 since these were the transducers developed by Marcos da Silva Martins[11].
Figure 2-10: PVDF 4x28µm (Left), PZT 110µm (Top), PVDF 110µm (Right),
However, there are several other options on the market. Beijing Cheng-cheng Weiye Science and Technology Co., Ltd, for example, provides a wide range of industrial ultrasonic emitters, like the CCH family [17].
FPGA based Underwater Wireless Communication System
18
2.4.1
Ultrasonic projector parameters
The CCH-5938D-25LB Figure 2-12 for example, which is used for ultrasonic cleaning, is a high efficiency, Static Capacity 5400 pF, high power, 60 W and a resonance frequency of 25 kHz [18].
Figure 2-12: CCH-5938D-25LB ultrasonic emitter.
This ultrasonic tubular transducer is used in distillation, cleaning, mix and mill for various chemical procedures. However, for this dissertation work it is intended to use different ultrasonic projectors, with different specifications like: area, thickness and number of layers, (Table 2-1).
Table 2-1: Transducer capacitance.
Although the physical characteristics are important in these projectors, the parameter that matters for this work is the overall transducer’s capacitance, which can be calculated using equation 3. This value is important because it is related to the projector current consumption, when driven at a certain frequency.
𝐶 = 𝐸𝑜𝐸𝑟𝐴 𝑑𝑁
(3) Where C is the capacitance in Farad, 𝐸𝑜 is the vacuum permittivity (8,85E-12), 𝐸𝑟 is the PVDF relative permittivity to the vacuum (12), 𝐴 is the area in meters, 𝑑 is the thickness in meters and 𝑁 is the number of layers.
2.5
Piezoelectric ultrasonic receiver
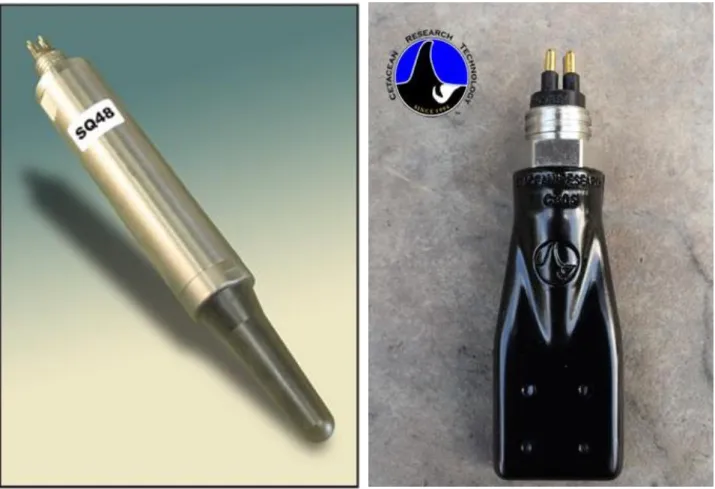
Hydrophones convert the underwater sound into an electrically signal, consequently the electrical properties of the transducer are important. There are different hydrophones in the market such as SQ48 Broadband Hydrophone from Shanghai Enou Technology Ltd (Figure 2-13) and C304XR from Cetacean ResearchTM Technology (Figure 2-14).
Figure 2-13: SQ48 Broadband Hydrophone. Figure 2-14: C304XR Hydrophone
The hydrophone used was a Cetacean ResearchTM C304XR which has a sensitivity of -201 [dB re
1V/µPa], a preamplifier gain of 20 dB and an effective sensibility of -181 [dB re 1V/µPa]. In terms of frequency, it presents a linear frequency range (±3 dB) between 0.012 and 1000 kHz and a frequency range (+3/-12 dB) between 0.005 and 2000 kHz. The output impedance is 10 Ω.
FPGA based Underwater Wireless Communication System
20
2.5.1
Existing ultrasonic preamplifiers
An ultrasonic preamplifier is a voltage amplifier that is placed between the hydrophone and its amplifier in order to provide sufficient gain or broadband signal-to-noise enhancement for optimum acquisition. Preamps can also be used to compensate for amplitude losses caused by very long cables, between the transducer and the test instrument, to improve signal-to-noise ratio. In general, a preamplifier can be used in almost any application where additional gain is required for optimum performance.
The hydrophone preamplifier must be an Ultra-Low Noise Amplifier (ULNA), because it is in the path of very small signals, otherwise inserts noise in the signal of amplitude equivalent to the signal itself, reducing the SNR. If that happens, the signal may not be recoverable even through filtering.
Some hydrophones already include a preamplifier from factory, others don’t. Some examples of ultrasonic preamplifiers are the AQ-201 (Figure 2-15), with a gain of 26 dB over a bandwidth of 140 kHz, an input referred noise (IRN) of 100 nV/√Hz.
The Shanghai enzhou Instrument Co., LTD (Figure 2-16) offers a differential input and output preamplifier (SA03) which has a 40 dB gain over a Bandwidth of 4 Hz to 80 kHz.
FPGA based Underwater Wireless Communication System
22
3
System analyses
The system analysis aims clarify the goal of the project, what challenges were expected to be faced and also decompose the system in simpler parts to simplify the development phase.
The objective of this dissertation work is the development of an acoustic modem for underwater communications. It includes the project of an ultrasonic emitter and receiver to drive ultrasonic transducers at frequencies of 4 MHz
3.1
System requirements
Requirements are divided into functional and non-functional requirements. The functional requirements are those that describe specific behaviors of the system. Non-functional requirements are requirements that derive from functional requirements. For instance, if it is a requirement (functional) for the system be usable onboard, it is a (non-functional) requirement the usage of a dedicated battery or the operation with the boat’s power supply voltage.
3.1.1
Functional requirements
The system has to be pluggable in an ordinary computer through a Universal Serial Bus (USB) port.
The system has to drive a transducer with a sinusoidal signal between 3.3 Vpp and 24 Vpp;
The sinusoidal signal has to vary in frequency between 100 kHz and 4 MHz;
The system has to read and amplify signals between 100 kHz and 4 MHz;
The system has to read and amplify signals between 100 µVpp to 11.22 V;
The system must be programmable on-the-fly without any key pressing or jumper setting;
3.1.2
Non-functional requirements
The system has to be powered from 230 V AC and from a 12 V battery;
The overall system has to be transported easily in a single case;
The system has to operate long hours without overheating;
The system has to be enclosed in an inaccessible case;
3.1.3
Use cases
To meet requirements, the user must be able to: upload the firmware, configure hardware, send a string and receive a string. These are the required use-cases and can be seen in Figure 3-1.
FPGA based Underwater Wireless Communication System
24
3.2
System Structure
From the developer point of view, the system is divided into three main layers, namely: application layer, hardware layer and physical layer.
At the application layer, the system performs the user interface, the data processing and retrieving process, and handles the communications with the hardware layer.
The hardware layer responds to the application layer, in a slave mode. At this layer, the data coming from the application is decoded and modulated and amplified in voltage and power to be sent to the physical layer. In a similar way, the data coming from the physical layer is acquired, demodulated and sent to the application. The physical layer is basically composed by both transceivers, the emitter and receiver, and the water channel itself. The ultrasonic emitter is polarized with a voltage signal, generates an acoustic wave, which propagates through the water and reaches the hydrophone, where the effect reverses itself. In the hydrophone, the pressure wave generates a voltage signal, which is passed into the hardware layer.
This structure can be seen in Figure 3-2.
3.2.1
Interconnection diagram
The hardware connection between the three layers, mentioned above, is chosen based on the data types been exchanged and the expected symbol rate. Therefore, as mentioned in chapter 2, the connection between the computer, where the application layer is implemented and the microcontroller, which is part of the hardware layer, should be USB.
The decision to use a USB connection is based on the fact that this connection protocol enables high bandwidth, 480Mb/s in case of USB2.0 [19], which is enough for this project’s requirements, and presents also the advantage of being the most used connector in computers and mobile devices, which meets other requirements.
The connection between the hardware layer and the physical layer is divided in two. One connection for power, connecting the power amplifier and the ultrasound emitter, composed by a standard power cable and a coaxial cable connecting the hydrophone and the instrumentation circuitry. These connections are depicted in Figure 3-3.
FPGA based Underwater Wireless Communication System
26
3.2.2
Software stack layer
At the application layer, the system must perform the user interface and the USB communication handling routines. These two different tasks should be as independent as possible to provide abstraction. Consequently, the USB communication detail shouldn’t be visible from the application point of view and in a similar way, the user interface shouldn’t be sensitive to the interface medium.
Ideally, any of the previous layers should be changed without affecting the other, because they should be independent has the diagram suggests in Figure 3-4.
Figure 3-4: Application layer
3.2.3
Physical layer
The physical layer is composed by the projector transducer and the hydrophone and the underwater channel itself. The projector, as expressed in the previous chapter, is a capacitive device that is subjected to the hardware layer output signal and generates an acoustic wave. The receiver or hydrophone, is exposed to the acoustic waves, under the water and generates an electrical signal that, is fed to the instrumentation circuitry at the hardware layer.
The overall physical layer can be depicted in Figure 3-5.
3.2.4
Hardware stack layer
At the hardware level, the signal path is divided into output signal (going out the modulator) and input signal (coming into the demodulator). Both the input and output signals exist in analog and digital forms. The output signal, enters the hardware layer at the microcontroller, through the USB2.0 bus. Then, the microcontroller feeds the modulator (implemented in the Field-Programmable Gate Array (FPGA) with one byte at a time. The modulator processes the received bytes and generates a 14 bit word to drive the DAC, which generates an analog signal. From this point on, in the signal path, the signal assumes the analog form. The generated analog signal is then amplified in voltage and power, and applied to the ultrasonic projector, which is part of the physical layer.
The input signal enters the hardware layer through the hydrophone, it is filtered, amplified and then gets sampled by the ADC. From this point on, in the input signal path, the signal is digital. After sampling the signal it is converted in a 14 bit word, which is passed to the demodulator that, at its turn, feeds the microcontroller with a byte.
FPGA based Underwater Wireless Communication System
28
3.3
Development considerations
To successfully meet the system requirements, several constraints, in different sections, had to be analyzed. These constraints range from the operating system, all the way down to the physical layer. The understanding of these constraints were very important because those were used as guidelines to optimize the system as much as possible, early in the design phase. This way, the first implementation was expected to be less buggy than otherwise.
In the following subsection of this chapter, those constraints are analyzed and understood one by one. In the next chapter, at the design phase, the appropriate consideration to overcome these issues were presented.
3.3.1
Hydrophone signal acquisition considerations
The receiver sensitivity 𝑅𝑠 of a hydrophone, expressed in 𝑑𝐵, is the ratio between its response and a standard response. The hydrophone’s response is the voltage that it generates when subjected to the sound pressure of the fluid surrounding it. The standard response for hydrophones, in underwater environments is 1 𝑉/𝜇𝑃𝑎.
Based on [20], [21], the receiver sensitivity of an hydrophone, 𝑅𝑠, of a receiver can be calculated using equation 4 where 𝑉𝑜𝑢𝑡 is hydrophone the response in the fluid and, 𝑉𝑟𝑒𝑓 is the standard response hydrophones in underwater environment.
𝑅𝑠 = 20 ∗ 𝑙𝑜𝑔10(
𝑉𝑜𝑢𝑡 [𝑉/𝜇𝑃𝑎]
𝑉𝑟𝑒𝑓 [𝑉/𝜇𝑃𝑎])
(4)
Considering 𝑉𝑟𝑒𝑓 = 1 [𝑉/µ𝑃𝑎 ] , and solving 4 in order to 𝑉𝑜𝑢𝑡, it is obtained 5, which expresses
𝑉𝑜𝑢𝑡 in [𝑉/µ𝑃𝑎] as function of the receiver sensitivity. This way, equation 5 allows to obtain the response for
a particular hydrophone, knowing its sensitivity. Thus, for 𝑅𝑠 = −181 𝑑𝐵, applying 5, 𝑉𝑜𝑢𝑡 = 8.91 ∗ 10−10 [𝑉/𝜇𝑃𝑎].
𝑉𝑜𝑢𝑡 = 10𝑅𝑠20 (5)
This value can be converted to [𝑉/𝑃𝑎] by multiplying 𝑉𝑜𝑢𝑡 by 1 ∗ 106. Therefore, for the Cetacean
The maximum output voltage 𝑉𝑜𝑢𝑡_𝑚𝑎𝑥 expected to be generated by the hydrophone depends on its RMS Overload Accoustic Pressure (RMSOAP) parameter, which assumes a maximum value of 202 𝑑𝐵 [𝑟𝑒 1𝑢𝑃𝑎]. Thus, 𝑉𝑜𝑢𝑡_𝑚𝑎𝑥 = 8.91𝐸−10[𝜇𝑃𝑎𝑉 ] ∗ 10
202
20 [𝜇𝑃𝑎] = 11.222 𝑉
Therefore, this hydrophone has a sensitivity of 8.91𝐸−10 𝑉/𝜇𝑃𝑎 or 891 µ𝑉/𝑃𝑎 and is capable to
generate a signal smaller or equal to 11.222 𝑉 between the SignalOut and Gnd pins (Figure 3-7).
Figure 3-7: Cetacean ResearchTM hydrophone pinout.
3.3.2
Cable considerations
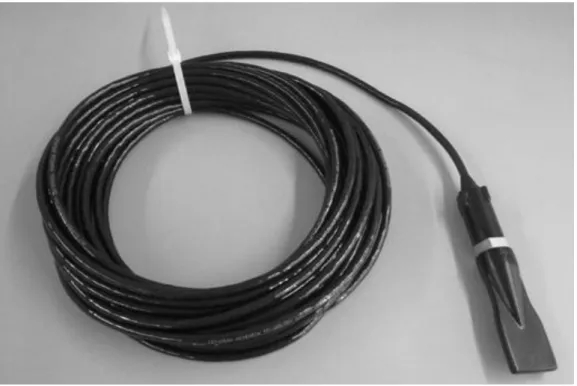
To transmit the signal from the hydrophone to the instrumentation circuitry, a 10 𝑚 cable was used. The cable (Figure 3-8) has four wires and an outer shielding net. The outer shielding net was connected to the hydrophones’ 𝐺𝑛𝑑 pin. Each wire of the selected cable, has a resistance of 900 𝑚Ω and a parasitic capacitance of 2.2 𝑛𝐹 between it and each of the nearby wires.
FPGA based Underwater Wireless Communication System
30
3.3.3
Noise considerations
Since it is a requirement for the system to emit and receive the signal in a band between 𝑓𝐿 = 100 𝐾𝐻𝑧 and 𝑓𝐻 = 4 𝑀𝐻𝑧 and, given the fact that the used cable acts as a Low Pass Filter (LPF) blocking signals of
frequency above 𝑓𝐻, only a input High Pass Filter (HPF) is required to remove signals bellow 𝑓𝐿.
The required HPF blocks signals of frequency bellow 𝑓𝐿 = 100 𝐾𝐻𝑧 while the LPF implemented by the
cable, rejects signals of frequency above 𝑓𝐻 = 4 𝑀𝐻𝑧. Thus, the HPF and the LPF, in series, form a Band Pass
Filter (BPF).
3.3.4
Preamplifier considerations
The preamplifier to be implemented has to be projected to have a low input noise in order to be able to amplify very small signals without reducing its Signal o Noise Ratio (SNR), ideally amplify a 8.91 µ𝑉 signal, because 8.91𝐸−10[ 𝑉
𝜇𝑃𝑎 ] ∗ 10𝐸3 [𝜇𝑃𝑎] = 8.91𝐸−6 [𝑉]. The highest input impedance possible, to reduce
the energy requirements to the hydrophone. The maximum input voltage of 11.222 𝑉 to be able to read the hydrophone’s full voltage range. The maximum Power Supply Rejection Ration (PSRR) to reduce the power supply noise influence in the amplified signal and a maximum output current to drive the upstream circuitry.
3.3.5
Variable gain amplifier considerations
The gain applied to the received signal must be variable, in order to maintain the signal in the ADC acquisition range. Therefore, a Variable Gain Amplifier (VGA) must be used to enable the system to change its gain dynamically.
Based on the hydrophone parameters, it can generate a signal between 8.91 µ𝑉 and 11.22 𝑉, and the ADC’s acquisition range is 1 𝑉. Therefore a gain 𝐺 has to be applied to the signal, and so, when the input signal is 11.22 𝑉 the gain of 𝐺𝑚𝑎𝑥 = 20 ∗ 𝑙𝑜𝑔10(11.2221 ) = −21 𝑑𝐵 has to be applied to the signal and when the signal is 8.91 µ𝑉 again of 𝐺𝑚𝑖𝑛 = 20 ∗ 𝑙𝑜𝑔10(8.9𝐸
−6
1 ) = 101 𝑑𝐵. This way, although the input signal’s
3.3.6
Variable gain control unit considerations
The gain of the VGA is digitally set. Thus, a logic unit was created in the FPGA to abstract the details of the gain setting procedure from the demodulator. This way, the interface between the demodulator and the Variable Gain Control Unit (VGCU) consists in a generic signal through which the demodulator requests the desired gain to the VGCU and the VGCU decodes the request.
3.3.7
ADC considerations
The signal to acquire has a maximum frequency 𝑓𝐻 = 4 𝑀𝐻𝑧 and, based on the Nyquist sampling theorem, must be sampled at the sampling frequency 𝑓𝑠 = 𝑁𝑓𝐻 where 𝑁 ≥ 2. As the hardware permits, 𝑁 was taken as 𝑁 = 6, therefore 𝑓𝑠 = 24 𝑀𝐻𝑧. The variable 𝑁 was taken as 6 because is a multiple of the FPGA’s main clock source and, based on the Nyquist sampling theorem, is large enough to provide a reasonable approximation between the analog signal and its discrete representation.
Being 𝑓𝑠 = 24 𝑀𝐻𝑧 and based on [22], a LPF is required to filter the signal before sampling. This filter has to remove any signal component with 𝑓 ≥ 𝑓𝑠
2 ⁄ . Because 𝑓𝑠
2
⁄ > 𝑓𝐻 the LPF can be designed to have a cutoff frequency of 𝑓𝐻. This way, its attenuation is greater at 𝑓𝑠
2
⁄ . Figure 3-9 show antialiasing filter requirements for a clean sampling.
Figure 3-9: Antialiasing filtering requirements.
After filtering, the signal is converted from single end to differential, and an offset 𝑉𝑐𝑚 is added, required to enter the ADC according to its specifications. The ADC samples the signal and converts it to a 14 bit word, which feeds the demodulator, implemented in the FPGAs.
FPGA based Underwater Wireless Communication System
32
3.3.8
Demodulator considerations
The demodulator is a logic module that receives a 14 bit word from the ADC, stores it to build an array of samples and converts it into a byte which is passed to the microcontroller. The demodulator also sets the VGA value, according to signal strength and demodulation techniques being used.
3.3.9
Modulator considerations
The modulator and demodulator perform inverse tasks. The demodulator logic unit receives a byte from the microcontroller and generates a signal to be converted to analog, based on the modulation being used. Then, a sequence of 14 bit words is generated to be sampled by the DAC.
3.3.10
DAC considerations
Since the system is required to generate an analog signal of frequency 𝑓𝑎 = 4 𝑀𝐻𝑧, the DAC’s sampling frequency must be 𝑓𝑠 ≥ 𝑁𝑓𝑎, where 𝑁 ≥ 2. Therefore, choosing 𝑁 = 6, the sampling frequency
is 𝑓𝑠 = 24 𝑀𝐻𝑧. The variable 𝑁 was also taken as 6 because is a multiple of the FPGA’s main clock source and, based on the Nyquist sampling theorem, is large enough to provide a reasonable approximation between the digital signal and its analog version.
3.3.11
High frequency power electronics considerations
Because several transducers are intended to be used, the transducer parameters aren’t known, since the project has to be transducer independent. Thus, it as to be assumed the worst case scenario, which is the transducer with highest capacitance and the maximum frequency of the analog signal 𝑓𝑎 = 4 𝑀𝐻𝑧. Table 3-1 shows all five transducers current consumption at 30 𝑉 and 𝑓𝑎 = 4 𝑀𝐻𝑧.
The impedance of a emitter can be calculated using equation 6, which expresses 𝑍𝑐 [Ω] as function of frequency 𝑓.
𝑍𝑐 = 𝑗𝜔𝐶1 [Ω], 𝜔 = 2𝜋𝑓 (6)
Meaning while, its current consumption is given by equation 7. 𝐼𝑐(𝑡) =
𝑉𝑐(𝑡) 𝑍𝑐
(7) Combining equation 6 and equation 7, it can be seen that the current consumption on an ultrasonic emitter depends on the applied voltage and the transducer impedance, which depends on the frequency 𝑓 of the signal and the capacitance 𝐶 of the transducer. While the applied voltage can be fixed throughout the device operation, the impedance
Figure 3-10 plots the current consumption of the piston type 8x28 µm 2 cm hydrophone, (Table 3-1) when subjected to a 30 V sin wave of frequencies between 100 kHz and 4 MHz. in the same plot it can be verified that the current consumption increase exponentially with the frequency. This result poses major challenges when operating in ever increasing frequencies.
FPGA based Underwater Wireless Communication System
34
3.3.12
Logic system considerations
The logic system, running in the FPGA, implements the modulator, demodulator, a variable gain unit and the logic to interface the microcontroller.
The modulator and demodulator logic units are likely to be redesign in future works, out of the scope of this work, for modulations and demodulations improvement, while the logic to interface the microcontroller and the variable gain unit aren’t. That way, to simplify future interventions, the logic system is divided in two different layers, an interface layer and a data processing layer.
The interface layer includes the logics to interface the modulator and the demodulator with the external world, which is the microcontroller’s interface logic, the variable gain unit, the DAC and the ADC, and its functionality is to route data in and out of those units that are likely to be changed with frequency.
The processing layer is composed by the modulator and demodulator and it’s planned to be the easily changeable.
3.3.13
Firmware considerations
The microcontroller interfaces the host computer and the FPGA. It is required to be used to avoid implementing the USB controller in the FPGA. Its function is to deliver the data received from the USB Bus to the modulator and retrieve data from the demodulator to deliver to the host. This data exchange is made through an USB connection.
Because the microcontroller has First In, First Out (FIFO) memories to buffer the USB data, two FIFOs are reserved for this project. One for input and other for output. The input FIFO holds data coming from the demodulator, while the output FIFO stores the data going to the modulator.
3.3.14
USB communication considerations
Despite the target baud rate of 1 Mbps, and the possibility of the system to operate in full duplex, which would be translated in 2 Mbps, the communication link between the hardware and the host computer as chosen to make possible larger baud rates, just in case the physical layer is improved.
The used USB connection, the USB2.0 is capable of transferring 480 Mbit/s. This way, the system bottleneck is transferred to the instrumentation and physical layer.
3.3.15
Application level considerations
The system being developed is not a complete communication system but, instead, an implementation of the first layer of the Open Systems Interconnection (OSI) model. Therefore, the application software to run on the host isn’t the main target of this dissertation work. However, an application was developed to send a string and listen to its echo. This way, more complex applications can be developed on the top of it.
3.4
Power considerations
As described in the functional requirements, the system has to be powered from a 230 V AC as well as from a 12 V battery to make it possible to be carried onboard, for example. This requirements implies that both the signal power amplifier and the FPGA, including the receiver instrumentation, have to be able to work when connected to the grid as well as to an ordinary battery.
To supply power to the system from the electric grid, which is 230 V AC, two computer power supply were used, one for the FPGA board and other for the signal power amplifier. The power supply used for the FPGA board, was a 230 V AC to 16 V DC converter, and the one used for the signal power amplifier was a 230 V AC to 24 V DC converter.
To supply power to the FPGA board and instrumentation from a 12 V battery, no special precautions have to be taken into consideration because it works properly with voltages between 10 V and 16 V. Meaning while, to supply power to the signal power amplifier, a Step-Up converter was used to convert the 12 V into 44 V, which is the minimum voltage required for the power amplifier to work properly.
FPGA based Underwater Wireless Communication System
38
4
System design
The proper approach to guarantee the quality and correctness of hardware and software design includes validation techniques such as simulation and testing. The application of these techniques ensures the correct relationship between a specification and the corresponding implementation.
The previous chapter, which described the analysis phase, was intended to decompose the system into small subsystems and make it possible to analyze them independently from each other. That goal was accomplished and, from this chapter on, until the integration phase, the system is treated as a group of subsystems. This way, the level of complexity was decreased significantly.
Chapter 4, covering the system design phase, aims to start from issues discussed at the analysis phase and present a solution for those. The solutions for the challenges, described in the analysis phase, are expected to be known at the end of this chapter. For that to be accomplished, the proposed solutions were simulated and validated.
4.1
Instrumentation design
The instrumentation is the hardware involved in the acquisition, filtering, amplification and sampling of the hydrophone signal. These hardware stages were divided into several modulus as described in chapter 3. These modules are the hydrophone selection switch, the VGA unit, the antialiasing filter and the ADC (Figure 4-1).
Figure 4-1: Instrumentation modules diagram.
![Figure 2-2: Transmission loss as function of range for the frequencies of 0, 25, 50, 100 and 200 kHz [10]](https://thumb-eu.123doks.com/thumbv2/123dok_br/17593825.819738/37.892.269.705.180.473/figure-transmission-loss-function-range-frequencies-khz.webp)