C
C
a
a
l
l
m
m
a
a
f
f
t
t
e
e
r
r
t
t
h
h
e
e
s
s
t
t
o
o
r
r
m
m
?
?
P
P
o
o
r
r
t
t
u
u
g
g
a
a
l
l
o
o
n
n
e
e
y
y
e
e
a
a
r
r
a
a
f
f
t
t
e
e
r
r
t
t
h
h
e
e
e
e
n
n
d
d
o
o
f
f
t
t
h
h
e
e
a
a
d
d
j
j
u
u
s
s
t
t
m
m
e
e
n
n
t
t
p
p
r
r
o
o
g
g
r
r
a
a
m
m
R
R
i
i
c
c
a
a
r
r
d
d
o
o
P
P
a
a
e
e
s
s
M
M
a
a
m
m
e
e
d
d
e
e
D
D
e
e
z
z
e
e
m
m
b
b
r
r
o
o
d
d
e
e
2
2
0
0
1
1
5
5
W
W
P
P
n
n
.
.
º
º
2
2
0
0
1
1
5
5
/
/
1
1
3
3
DOCUMENTO DE TRABALHO WORKING PAPERCalm after the storm? Portugal one year after the end of the
adjustment program
Ricardo Paes Mamede
*
WP n. º 2015/13
DOI: 10.15847/dinamiacet-iul.wp.2015.13
1. INTRODUCTION ... 3
2. THE DYNAMICS OF PUBLIC DEBT ... 5
3. CORPORATE INDEBTEDNESS ... 10
4. COMPETITIVENESS WEAKNESSES ... 12
5. THE ROOM FOR GROWTH-PROMOTING POLICIES ... 14
6. CONCLUSIONS ... 16
________________________________________________________________________________
Calm after the storm? Portugal one year after the end of the
adjustment program
ABSTRACT
One year after the end of the adjustment program, Portugal seems to be passing through a period of calm after three years of a storm that lead the country many years backward in economic activity, employment, investment, and social conditions. The change of economic climate is largely due to the improvement in external conditions, especially the abundant liquidity provided by the ECB since 2012. However, Portugal still has a long way to go before recovering from pre-crisis levels of economic activity. Additionally, there are reasons to suspect that the recent macroeconomic improvements may prove to be unsustainable, while a sustainable recovery of the Portuguese economy is being hampered by the high levels of public debt and private sector debt (especially among non-financial corporations).
KEYWORDS: Macroeconomic adjustment; Debt restructuring; Competitiveness; Portuguese economy.
________________________________________________________________________________
1. INTRODUCTION
In May 2011 Portugal agreed with the EU institutions and the IMF the implementation of an austerity program, following a number of contractionary fiscal measures already in place since 2010. The combined effect of this program and the spill-overs accruing from the simultaneous fiscal consolidation across the EU had a devastating impact on Portuguese economy and society1. Between 2010 and 2014, GDP fell by 5.4%, investment dropped by nearly 30%, total employment fell by 7% (i.e., 350,000 net jobs were lost), the unemployment rate reached a peak of 17.5% in the first quarter of 2013 and, by the end of 2014, was still above 14% (from 12% in 2010). About 65% of the unemployed (9.1% of the labour force) were out of job for at least 12 months. Nearly 60% of those without a job did not have access to any unemployment benefit. The population at risk of poverty and social exclusion increased from 25.2% in 2010 to nearly 27.5% in 2013, while the intensity of poverty rate2 increased from 23.2% to 30.3% in the same period.
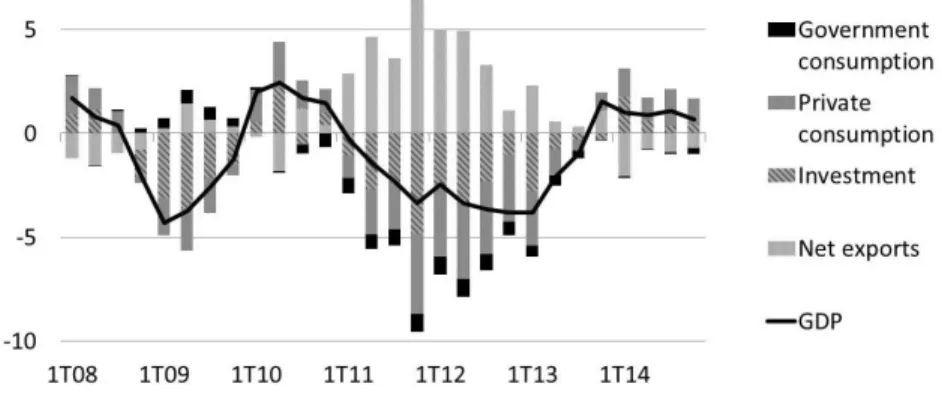
As Figure 1 shows, the economic recession in Portugal was associated with a steep drop of internal demand (especially investment and private consumption) between the first quarter of 2011 and the third quarter of 2014, which was only partially compensated by the positive contribution of net external demand to GDP growth.
Figure 1 – Quarterly GDP growth (year-on-year) and contribution of demand components (%)
Source: INE.
1 Veld (2013) estimates that the spillovers from simultaneous fiscal consolidation across the EU led to a cumulative loss of 15,3% of GDP between 2011 and 2013 (as compared to the effects of a stand-alone fiscal consolidation in Portugal).
2 This rate is measured as the difference between the at-risk-of-poverty threshold (set at 60 % of the national median equivalised disposable income after social transfers) and the median equivalised disposable income of persons below the same at-risk-of-poverty threshold, expressed as a percentage of the at-risk-of-poverty threshold.
________________________________________________________________________________
Figure 1 also shows that the downward trend in the economic situation in Portugal seems to have been somewhat reversed since last quarter of 2013. In fact, during 2014 GDP grew 0.9% on an annual basis, and growth is expected to nearly double in 2015. Around 80,000 net jobs were created between 2013 and 2014, and the unemployment rate fell 2.3 percentage points (p.p.) to 14.1%. For the second consecutive year (and for the first time in several decades), Portuguese current account was in surplus. The public budget also registered a positive structural primary balance since 2012, reaching 2.7% in 2014 (from -5.1% in 2010). These improvements in external and public accounts, as well as in economic activity and employment, have been considered by the Portuguese government and by international institutions as a sign of success of the adjustment program that ended in June 2014, notwithstanding its economic and social costs.
However, Portugal still has a long way to go before recovering from pre-crisis levels of economic activity. In spite of the recent improvements, by the end of 2014 real GDP was still at its 2003 value. Investment levels were back to those of the late 1980s, being insufficient even to replace the existing capital stock (Net Fixed Capital Formation decreased by 2.3% since 2010). Total employment has not been so low since 1995. The drop in the unemployment rate seems to be largely explained by the growth of emigration (which has not been so high since the 1960s, leading to a decrease in total population of 180.000 people, or 2%, since 2010), by the growth of inactivity (264.000 people were pushed out of the labour force during this period)3, and by the expansion of occupational programs for unemployed people (who during that period do not count as unemployed for statistical purposes)4.
Moreover, there are reasons to believe that the recent macroeconomic improvements may prove to be unsustainable. For example, the return to growth in 2014 has been driven by internal demand, with net exports giving a negative contribution to the annual change in GDP, which leads to question the potential for an export-led recovery. In addition, the recent growth in private consumption and investment is partially explained by the Constitutional Court’s decision to block some of the fiscal consolidation measures adopted by the government, raising doubts about the capacity to meet the budgetary goals for 2015. Finally, the relatively optimistic growth forecasts for the near future may still prove insufficient to substantially reduce the extent of labour slack.
3 According the IMF (2015), “A broader measure of labor slack that adds discouraged workers—which increased sharply during the crisis— to official unemployment and labor force, and adjusts for involuntary short-term work, is estimated to reach 20.5 percent in 2014, compared with only 9.5 percent before the crisis in 2008. Arguably, the large outward migration flows of workers since 2011 could be added to labor market slack as well, as many migrants would likely return to Portugal if jobs would become available.”
________________________________________________________________________________
At the present juncture, a sustainable recovery of the Portuguese economic seems to be hampered by the high levels of public debt, private sector debt (especially among non-financial corporations) and overall net external debt. In the following sections of this paper I will present in greater detail the challenges posed by the dynamics of public debt (section 2), the high levels of corporate indebtedness (section 3) and the competitiveness weaknesses of the Portuguese economy (section 4). Section 5 discusses the policy measures that have been, or could be, implemented to address these challenges. Section 6 concludes.
2. THE DYNAMICS OF PUBLIC DEBT
All the parties involved in the design and implementation of the austerity program – the Portuguese government, the IMF, the ECB, and the European Commission – consider the Portuguese sovereign debt to be sustainable, within the most probable macroeconomic scenarios. International private investors seem to think likewise: Portugal has smoothly returned to sovereign debt markets since 2013, facing historically low interest rates5. The Portuguese authorities were also able to improve the repayment profile of public debt by extending maturities to 15 years and conducting a number of bond swap operations. Taking advantage of the favourable monetary context, the Ministry of Finance built up a cash buffer that meets a substantial amount of pre-financing for 2015 (IMF, 2015)6.
The financial pressure on the Portuguese government in the coming months has been significantly reduced by the low levels of interest rates, the soft and discrete debt rescheduling, and the built up of a cash buffer. This, however, should not elude the challenge posed to Portugal by the dynamics of public debt.
By the end of 2014 Portugal’s debt-to-GDP ratio reached 128.9%, thus falling to initiate a downward trend. This value not only is substantially higher than in 2010, when public debt reached 96.2% of the GDP, but it is also disappointing when compared to the projections included in the original version of adjustment program (107.6%).
Such a high debt-to-GDP ratio translates every year into a significant amount of interest payments (4.5% of GDP in 2014). Moreover, it represents an additional constraint for complying with the
5 The implicit interest rate on 10-year Portuguese bonds reached a historical low of 1,5% in March 2015. 6 This cash buffer is not free of costs, though: according to some estimates, the related interest paid by the Portuguese States amounted to 500 million in 2014.
________________________________________________________________________________
budgetary rules of EU’s Fiscal Compact7. Recall that, according to the latter, Member States whose debt-to-GDP ratio exceeds the 60% reference level in the latest recorded fiscal year, have to reduce it at an average rate of at least one twentieth per year of the exceeded percentage points. To comply with this rule, the Portuguese government would have to run unprecedented high budget surpluses for several years. The following figures illustrate this point.
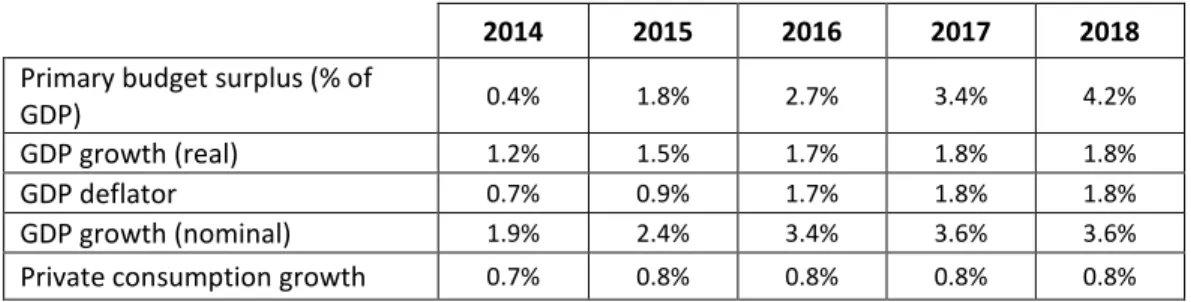
In May 2014 the Portuguese government presented its Stability and Growth Program (SGP) for the period 2014-2018. This document included the government’s mid-term macroeconomic projections, which are reproduced in Table 1.
Table 1 – Mid-term forecasts for Portugal, 2014-2018
2014 2015 2016 2017 2018 Primary budget surplus (% of
GDP) 0.4% 1.8% 2.7% 3.4% 4.2%
GDP growth (real) 1.2% 1.5% 1.7% 1.8% 1.8%
GDP deflator 0.7% 0.9% 1.7% 1.8% 1.8%
GDP growth (nominal) 1.9% 2.4% 3.4% 3.6% 3.6%
Private consumption growth 0.7% 0.8% 0.8% 0.8% 0.8%
Source: Ministry of Finance (May, 2014).
As the table shows, the Portuguese government expected the primary surplus to gradually increase to 4.2% of GDP in 2018, in a macroeconomic context marked by moderate GDP growth (between 1.2% and 1.8%), moderate inflation (between 0.7% and 1.8%), and moderate growth of private consumption (0.7%-0.8%). These forecasts are compatible with the Fiscal Compact, assuring that the debt-to-GDP ratio would approach the 60% threshold at the rate of 1/20 per year from 2017 onwards, assuming that the average interest rate on the overall Portuguese sovereign debt would remain stable during the period.
However, the projections shown above are hardly compatible with past experience of any comparable country. In Cabral et al. (2014) we have analysed the data for the 28 EU Member States between 1996 and 2013, corresponding to 491 observations without missing data. We then checked the number of observations corresponding to cases in which: the primary surplus was equal to or greater than 1.8% of the GDP; nominal GDP growth was no more than 3.6%; and the GDP deflator was at most 1.8%. Only 6% of the cases correspond to these conditions. If we add the restriction
________________________________________________________________________________
that private consumption cannot growth above 0.8% per year, we are reduced to 2% of the cases (10 out of 491). Finally, none of these few cases corresponded to countries with high levels of external debt (recall that the Portuguese external debt is presently above 100% of GDP). In other words, the mid-term forecasts that are compatible with Portugal complying with the Fiscal Compact were hardly ever seen in Europe in recent decades, and only happened occasionally (and not in several successive years, as is expected in the Portuguese case), even in countries with a much healthier macroeconomic situation than Portugal.
More recently, the IMF (2015) has presented a more modest macroeconomic mid-term forecast for Portugal. The Fund expects annual GDP growth to reach 1.6% until 2018, the GDP deflator 1.7%, and the primary balance 2.5% of the GDP. These figures imply that the reduction in the debt-to-GDP ratio will be significantly slower than the EU budgetary rules determine. According to the IMF, the debt-to-GDP ratio will be 124.1% in 2018, corresponding to a rate of reduction of 0.7% per year (that is, seven times less than the required target). Put simply, the FMI forecasts that Portugal will not comply with the Fiscal Compact.
Given the discussion above regarding the experience of EU Member States since 1996, IFM’s recent forecasts seem more plausible than the ones presented by the Portuguese government in 2014 (even if they imply that Portugal will not meet EU’s fiscal rules in the medium-term). However, it is worth noting that the IMF’s forecasts regarding real GDP growth, the GDP deflator and the budget surpluses are close to the conditions we assumed in Cabral et al. (2014), when discussing the experience of EU Member States in the last two decades. That is, even if we used IMF’s more moderate forecasts regarding the budget surplus, the conclusion would still be the same: in order to put the debt-to-GDP ratio on a downward trend (however modest), Portugal would have to conduct a process of budgetary adjustment that is highly implausible at the light of the historical experience8.
In other words, without a substantial restructuring of the public debt, the debt-to-GDP ratio will only improve if Portugal runs unprecedented levels of budget surpluses for over a decade. This requires that at least one of the following conditions holds: (i) public expenditures are drastically reduced and/or public revenues significantly increase; or (ii) the evolution of the main macroeconomic variables (interest rates, real GDP growth, inflation, etc.) is much more favourable
________________________________________________________________________________
than is presently forecasted by national and international institutions. There are, however, significant constraints to any of these hypothetical developments.
It should be noted that several budget-related reforms have been implemented in Portugal since the turn of the century (that is, even before the adjustment program was in place), as the following examples illustrate: (i) between 2000 and 2009 the civil servants real wages decreased (-3.4% for salaries less than 1.000 euros and -6.7% for higher wages), contrasting with the 9.6% increase in private sector wages during the same period; (ii) Portugal was the fourth of 32 OECD countries in which the weight of public employment in the labour force decreased the most (1.5%, compared with 0.2% in the OECD average); (iii) Portugal is by far the EU country where the General Government’s wage bill as a percentage of GDP fell the most since 2005 (4.1 percentage points compared to an average of 0.1 in the EU); (iv) in 2006, Portugal adopted one of the most ambitious pension system’s reform in the OECD, by introducing a sustainability factor relating the calculation of public pensions with average life expectancy.
This strand of reforms was reinforced in the context of the adjustment program. Between 2010 and 2014, expenditures excluding interest dropped by 13% (-5.3% of GDP). Measures adopted on the expenditure side include: several cuts in civil servants’ wages (representing between 15% and 20%), an increase in the weekly working time (from 35 to 40 hours) and reductions in the compensation of extra-time work, a reduction in the number of civil servants (by nearly 50,000, duplicating the adjustment program’s target), cuts in virtually all social benefits and more stringent means-testing criteria, cuts in pensions (between 3,5% and 10%), reductions in public services provision and quality (including closing/merging units, reducing the number of schools and primary health institutions, increasing the number of students per class, imposing strict targets for medical consultations per doctor at primary health units, reducing auxiliary staff, etc.), and cutting public investment (from 5.8% of GDP in 2010 to 2.1% in 2014).
Public revenues, in turn, increased by 5%. This was achieved by adopting several measures targeting direct and indirect taxations, as well as social contributions. The increases in the VAT rates (the main rate increased from 21% to 23%, and several special rates were abolished) were insufficient to compensate for the reduction in economic activity and employment. The same happened to social security contributions. Therefore, the increase in revenues was due to direct
________________________________________________________________________________
taxation (which grew from 8.8% of GDP in 2010 to 11.1% in 2014), mostly related with higher tax rates on personal income and reductions in small-scale tax evasion9.
In sum, after 15 years of budget-related reforms and four years of deep fiscal consolidation, it seems unreasonable to expect that future reductions in the Portuguese debt-to-GDP ratio can be achieved through further substantial cuts in public expenditure or increases in tax revenues, without incurring the risk of social, political and economic disruption.
At present, the favourable evolution of macroeconomic conditions (the reduction in interest rates, the depreciation in euro’s exchange rate against the US dollar, and the decrease in oil prices), together with the positive performance of Portuguese exports (which are expected to grow by 4.5% in 2015), have fostered optimistic views regarding economic recovery and public debt sustainability. However, as I have shown above, in the absence of debt restructuring even real growth rates of GDP around 2% per year are insufficient to put debt-to-GDP ratio on an economically and politically sustainable downward trend10. The capacity to achieve higher rates of growth, however, is severely hampered by the high levels of corporate indebtedness and the profile of specialization of the Portuguese economy. I will address these two topics in the following sections.
9 Several measure have been adopted in this domain, including: crossing fiscal information from different sources, harmonizing fiscal rules, increasing penalties for fraudulent behavior, expanding the tax auditing staff, creating incentives for consumers to request invoices in daily consumption (e.g., tax benefits in proportion of the values of invoices, a weekly lottery of top-of-the-range cars using the invoices numbering, etc.).
________________________________________________________________________________
3. CORPORATE INDEBTEDNESS
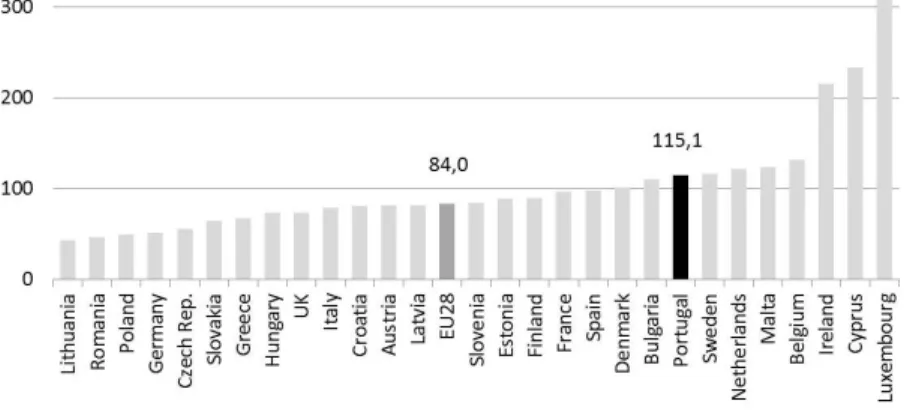
The debt of non-financial corporations (NFCs)11 increased rapidly in Portugal since the mid-1990s: from 59.2% of the GDP in 1995, to 83.9% in 2000, 105.2% in 2007 and 115.1% in 2014. Presently, Portugal has one of the most indebted corporate sectors in Europe, as shown in Figure 2.
Figure 2 – Debt of non-financial corporations in 2014 (% of GDP)12
Source: Eurostat.
The high levels of corporate debt pose several risks to the Portuguese economy. As the IMF (2013) put it, “the high debt burden serves as a drag on corporate profitability and investment growth” and “poses a threat to banks’ balance sheets and financial stability through increasing non-performing loans and corporate bankruptcies” (p.51).
In fact, non-performing loans to NFCs have increased significantly in Portugal in recent years, especially during the austerity program: according to the Bank of Portugal, they represented 2,1% of total loans to NFCs in September 2008 (when Lehman Brothers went bankrupt), 5% by the start of the program (May 2011), and 14,6% in the beginning of 2015.
The strong increase of non-performing loans in recent years resulted from a combination of: (i) the deep economic recession, which reduced the profitability of firms and, therefore, their capacity to repay their debts; (ii) the tightening of credit conditions, which limited the possibilities for the revolving of bank credits; and (iii) the almost absence of alternative sources of funding for
11 IN the present definition the debt of NFC includes loans, debt securities, and trade credits and advances. 12 Corporate debt is here presented in non-consolidated terms, corresponding the sum of loans and securities other than shares on the liability side.
________________________________________________________________________________
Portuguese firms (partly explained by the fact that 99% of these are SMEs). Moreover, the ability of firms to liquidate assets to repay debts was limited under the prevailing market conditions.
Burdened with high debt and lacking alternative means to adjust, Portuguese firms were forced to cut on investment and operating costs (notably, labour costs), thus contributing to deepen the economic recession – and, consequently, the indebtedness problem of both the private and the public sector.
In the context of the adjustment program, several measures were adopted to address the problem of corporate deleveraging in Portugal. These include measures related with new in- and out-of-court debt restructuring and insolvency procedures, reinforced monitoring mechanisms, improved access to funding (guarantees, stimulus to privately-run investment funds, etc.), and targeted tax measures (e.g., temporary tax incentives for debt restructuring, minimizing the distortions resulting from the different tax treatment of debt versus equity). However, the impact of these measures has been modest, given not only the dimension of the problem, but also several practical difficulties in implementation (e.g., opportunistic behaviour by insolvent firms, resistance of both creditors and debtors to restructuring, lack of new financing, a weak insolvency administration, an overburdened judicial system, understaffing of public agencies, etc.) (IMF, 2015). In any case, it is clear that a drastic corporate balance-sheet adjustment would risk weakening the Portuguese banking sector. In the worst case scenario, this could ultimately jeopardize the fiscal consolidation effort that has been put in place in recent years, by passing over debt from private hands to the public sphere.
At the beginning of 2015 the rate of non-performing loans was still increasing, while the deleveraging of the Portuguese corporate sector was proceeding slowly, at the cost of productive investment. With the recent improvement in credit conditions, the key obstacle to a more rapid adjustment of Portuguese NFCs’ financial position was the growth of sales. This, however, was being hampered both by the deleveraging of the public and the private domestic sectors, and by the slow growth of external demand (especially from the EU).
In fact, examples of similar crises in past have shown that the adjustment of corporate balance sheets was largely driven by a strong export performance. Typically, this was fostered not only by strong external demand, but also by nominal exchange rate adjustments (IMF, 2013). Being part of a monetary union, Portugal cannot rely on the exchange rate mechanism to drive the necessary gains in competitiveness: although the recent depreciation of the euro is expected to have a positive impact on Portuguese exports (not only to extra-eurozone markets, but also within the monetary union, for industries that compete directly with third country producers), it does not affect
________________________________________________________________________________
the competiveness of Portuguese firms vis-à-vis its euro zone competitors. Therefore, further gains in price competitiveness would have to be obtained through the continuation of the internal devaluation process. Given the very low levels of inflation in the euro zone, this would imply a prolonged period of deflation in Portugal, which would in turn aggravate the debt burden of firms, households, and the government.
In sum, the high level of corporate indebtedness has become a main obstacle to economic and employment recovery in Portugal, aggravated by the dismal economic performance and low inflation in the euro area. Even if these conditions were to be reverted in the short run, the Portuguese economy would still have to deal with a more fundamental problem: the weakness of its productive structure, to which I turn next.
4. COMPETITIVENESS WEAKNESSES
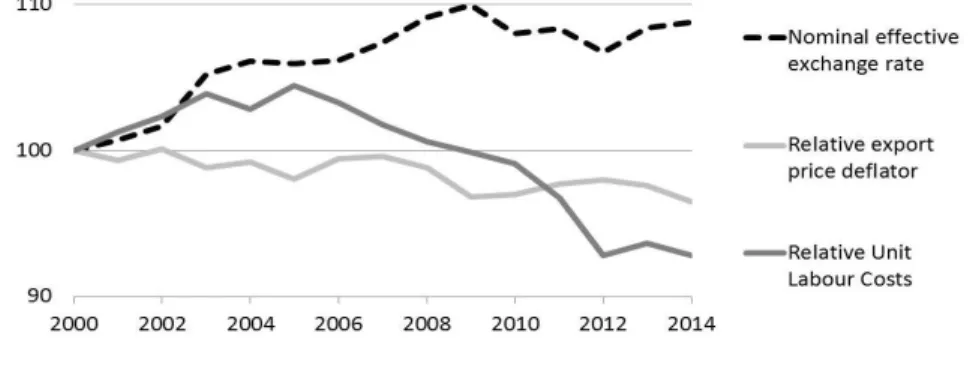
Improving external competitiveness through internal devaluation has been a central feature of the austerity program implemented in Portugal in recent years. This has been achieved through the public sector reforms mentioned in Section 2, as well as through a number of changes in labour laws. The latter included the following: reducing severance pay, restricting the possibility of appeal to the courts by dismissed workers, reducing overtime compensation, increasing working time flexibility, reducing the number of vacation days and holidays, and reducing the duration and amount of unemployment benefits. Together with the downward pressure imposed on wages by the high level of unemployment, these developments led to a substantial decrease of the relative unit labour costs (ULCs) in Portugal, as shown in Figure 3.
Figure 3 – Nominal exchange rate, unit labour costs, and export prices in Portugal vis-à-vis trading partners (2000=100)
________________________________________________________________________________
Figure 3 also shows that the decrease in relative ULCs did not translate into a substantial decrease in relative export prices, suggesting that wage cuts were used to increase the margins of exporting firms, possibly as a part of their deleveraging efforts, as was discussed in the previous section.
The relative stability of relative export prices leads to question the thesis according to which the growth in Portuguese exports in recent years has been fostered by the internal devaluation strategy13. In fact, export growth in Portugal during the years of austerity has not been particularly impressive: between 2010 and 2014, Portuguese export grew at an annual average of 5.1%, which compares with 4.7% in the pre-crisis period (2000-2007), during which the Portuguese economy was hit by a succession of negative competitive shocks (namely real and nominal exchange rate appreciations, and increased competition from emerging economies). The marginal difference in export growth rates between the two periods can be attributed to the recovery from the international crisis of 2008/2009, as well as the need of domestic firms to redirect sales to foreign customers, given the collapse in internal demand.
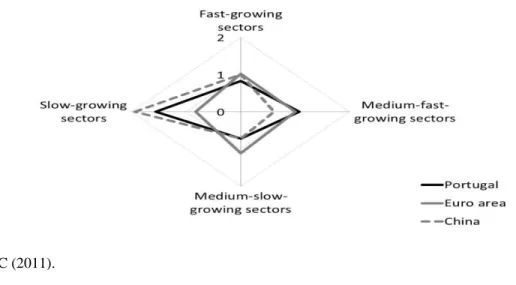
Arguably, the increase in the margins of Portuguese exporters will increase the attractiveness of investments in the tradable sector. However, as was previously discussed, investment is being hampered by low internal and external demand, as well as by the high levels of corporate debt. Moreover, the profitability of Portuguese exports has been limited in the past two decades by their specialization profile. As Figure 4 illustrates, Portugal is overspecialized in slow-growing exporting products, displaying a specialization profile that largely overlaps with that of emerging economies such as China.
Figure 4 – Export specialisation (Balassa Index) by dynamic industries in the manufacturing sector (average 2005-2009)
Source: EC (2011).
13 Uxó et al. (2014) develop this argument for the internal devaluation strategy followed in several euro zone countries.
________________________________________________________________________________
In other words, the Portuguese economy largely relies on low valued added and low growth industries, which have been facing increasing competitive pressures from emerging economies that from substantial cost advantages. In order to sustainably improve its export performance Portugal will have to upgrade its productive structure, towards more knowledge-intensive activities. However, this structural change can hardly be achieved in the medium-term, given the current financial constraints and, more importantly, the country’s huge gap in educational levels14.
5. THE ROOM FOR GROWTH-PROMOTING POLICIES
Against this background, the international institutions insist on the need to proceed with reforms that foster the price-competitiveness of the Portuguese economy. For example, in its first country report after the end of the adjustment program, the IMF (2015) called upon the Portuguese authorities to deepen labour market reforms, in particular by: postponing any further increases in the minimum wage15, limiting the sector extension of collective agreements16, and further loosening employment protection, particularly for permanent contracts. Following similar calls by the European Commission (EC, 2015), the Fund has also addressed the need to continue the efforts to reduce prices in the energy sector, as well as to revise the laws on highly regulated professions.
While these and other measures may have positive impacts on the overall efficiency of the Portuguese economy in the medium term, their implementation would be insufficient to overcome the main constraints to a sustainable economic recovery in Portugal that were discussed in the previous three sections, that is: the dynamics of public debt, the high levels of corporate indebtedness, and the weaknesses of the Portuguese export sector.
As many authors have been arguing in recent years, the sovereign debt of countries in the periphery of the euro zone can hardly be sustainable in the absence of restructuring, fiscal transfers, or an unanticipated burst of inflation (see, e.g., Eichengreen and Panizza, 2014). Until one or several of these solutions materialize, public debt will continue to exert a strong downward pressure on economic growth in Portugal, aggravated by the need to comply with the ambitious targets of EU’s fiscal rules regarding the yearly pace of debt reduction.
14 In 2014 only 43% of the population had graduated from upper secondary school, the lowest level in the EU, where the average was 72.5%.
15 The minimum wage was increased to 515 euros in 2015, after being held fixed for four years at 485 euros. 16 The survival period of collective agreements has been reduced from 5 to 3 years, with the possibility for their temporary suspension.
________________________________________________________________________________
With fiscal room reduced to a minimum and with many of the so-called structural reforms already in place17, there is not much that can be done at the national level in order to induce economic growth in Portugal. The following two examples help to illustrate the point.
The Portuguese government has decided to set up a new development financial institution, which will manage with both debt and equity (or quasi-equity) funding instruments for SMEs, drawing on different sources (including EU Cohesion Policy funds). While this initiative may help to achieve greater efficiency and effectiveness in the management of financial instruments for enterprise funding, it will not represent a dramatic transformation from the enterprise support policies that have been implemented in the recent past, nor will it be able to increase significantly the amount of funding available for productive investment.
The European Commission (EC, 2015) has also pointed out the insufficient investment in R&D and innovation by Portuguese firms, and the need to strengthen the links between universities and industry. However, as I have argued elsewhere (Mamede, 2014), the common assessments of the Portuguese research and innovation system are systematically biased, given their lack of consideration for the structural specificities of the domestic economy. In fact, almost all of the statistical indicators used by EU institutions to assess the innovative performance of countries are strongly correlated with the technology-intensity of their productive structure. As such, those indicators are more informative about the structure of each economy than the actual innovative performance given each country’s specialization profile. In Mamede (2014) I show that, when innovation indicators are normalized according to each country’s economic structure Portugal outperforms in most of them18. In other words, the problem of the Portuguese research and innovation system is not related with its lack of effectiveness but with inherited specialization profile of the country’s economy. Although there is room for improvement in the way innovative policies are designed and implemented in Portugal – for example, by improving coordination
17 The following passage summarizes the main conclusions of the recent EC’s country report on Portugal regarding the structural measures to improve competitiveness: “A wide range of reform measures have been adopted to alleviate nominal rigidities, facilitate adjustment, reduce excessive rents and encourage the reallocation of resources to the tradable sector. Significant measures have also been taken to cut red tape and make the judicial system more efficient. However, significant structural weaknesses remain in key areas, including services and regulated professions, public administration and network industries (particularly energy and transport).” (p.43)
18 To give an example: R&D expenditures in Portugal represented 1.36% of GDP in 2014; this is clearly below the EU average (2.01%) and less than half of the EU 2020 target of 3%; however, since R%D expenditure are strongly correlated with the share of high tech industries in each economy, and since these industries are nearly absent in the Portuguese case, the level of R&D expenditures is already above what would be expected, given the country’s economic structure.
________________________________________________________________________________
mechanisms within the State apparatus (see Mamede et al., 2014) – the effectiveness of these policies largely depends on the overall conditions for structural change, including sustained improvements in educational levels and financial conditions for productive investment.
6. CONCLUSIONS
The signs of recovery of the Portuguese economy have been emphasized by EU institutions in recent months as evidence of a successful adjustment program in the euro zone periphery. GDP growth returned to a positive ground in 2014 and 2015, total employment grew slightly, the unemployment rate fell, the current account have been in surplus for the first time in decades, and the structural primary balance improved substantially (as compared to 2010).
However, Portugal still has a long way to go before recovering from pre-crisis levels of economic activity. Additionally, there are reasons to suspect that the recent macroeconomic improvements may prove to be unsustainable, while a sustainable recovery of the Portuguese economy is being hampered by the high levels of public debt and private sector debt (especially among non-financial corporations).
In order to tackle its indebtedness problems – in the absence of substantial debt restructuring and/or fiscal transfers – the Portuguese economy would need to grow much faster than is presently forecasted for the coming years. According to the IMF (2015), an average growth of 1.5% during 2015-2019 would reduce only marginally the present levels of labour market slack. However, a faster pace of growth is hardly compatible with the constraints affecting the Portuguese economy, namely: its weak productive structure and the high levels of indebtedness.
One year after the end of the adjustment program, Portugal seems to be passing through a period of calm after three years of a storm that lead the country many years backward in economic activity, employment, investment, and social conditions. The abundant liquidity provided by the ECB since 2012 has allowed the Portuguese government to satisfy its current financing needs through the financial markets at favourable conditions. It has also contributed to improve the financing conditions for the Portuguese banking system, fostering the recovery of credit to the private sector. This, however, should not elude the fact that trouble may still be around the corner for Portugal.
________________________________________________________________________________
7. REFERENCES
EC (2011), “The Economic Adjustment Programme for Portugal”, DG EcFin Occasional Papers
79, European Comission.
EC (2015). “Country Report Portugal 2015”. Comission Staff Working Document 41. European Commission.
EICHENGREEN, B.; Panizza, U. (2014). “A Surplus of Ambition: Can Europe Rely on Large Primary Surpluses to Solve its Debt Problem?”. NBER Working Paper NBER Working Paper No.
20316. National Bureau of Economic Research.
IMF (2013). “Portugal: Selected Issues Paper”. IMF Country Report No. 13/19, January 2013.
IMF (2015). “Portugal: first post-program monitoring”. IMF Country Report No. 15/21, January 2015.
MAMEDE, R. (2014). “Structural challenges, innovation performance, and the role of innovation policies in Portugal”. Paper Prepared for the High-Level Economic Policy Expert Group
“Innovation for Growth - i4g”. Brussels: European Commission.
MAMEDE, R.; Godinho, M.M.; Simões, V.C. (2014). “Assessment and challenges of industrial policies in Portugal: is there a way out of the ‘stuck in the middle’ trap?”. In A. Teixeira, E. Silva e R. Mamede (eds.), Structural Change, Competitiveness and Industrial Policy: Painful Lessons from
the European Periphery. London: Routledge.
OBSERVATÓRIO SOBRE CRISES E ALTERNATIVAS (2015). “Crise e mercado de trabalho: Menos desemprego sem mais emprego?”. Barómetro das Crises n. 13 , March.
UXÓ, J.; Paúl, J.; and Febrero, E. (2014). “Internal devaluation in the European periphery: the story of a failure”. Documentos de Trabajo DAEF, (2), 1.
VELD, Jan in't (2013). “Fiscal consolidations and spillovers in the Euro area periphery and core”.
European Economy, Economic Papers 506. European Commission, Directorate-General for