A Comparative Study of Satellite and
Ground-Based Vineyard Phenology
Mário CUNHAa,1, André R.S. MARÇALa, Arlete RODRIGUESa aCentro de Investigação em Ciências Geo espaciais, Faculdade de Ciências,
Universidade do Porto
Abstract. Grapevine phenology observations are essential for ecological adaptability of grape varieties, crop management and crop modelling. Phenological events have traditionally been ground based, with observations mainly providing information concerning grape varieties over a limited spatial area and few in-season observations. Time-series of satellite imagery can rapidly provide a synoptic and objective view of grape vegetation dynamics that may be used for vineyard management. Ten-day VEGETATION image composites from 1999 to 2007 were used to examine temporal profile in the Normalized Difference Vegetation Index (NDVI) and their relationship with ground based observation of grapevine phenology. In Portugal is Douro wine region, 2 suitable tests sites with over 70% or more of their area occupied by grapevines were selected. A number of NDVI metrics were obtained for each year through logistic model adjusted to NDVI time series after noise reduction using a Savitzky-Golay filter. The comparison of ground-based vineyard phenology and satellite-derived flowering, show an average spread deviation of 3 days. The satellite derived full canopy date was significantly correlated to the veraison date (r=0.87; n=7; p<0.02). The data set provided by the VEGETATION sensor proved to be a valuable tool for vineyard monitoring, mainly for inter-annual comparisons on regional scale. Keywords: Grapevine, Phenology, Smoothed NDVI, Remote Sensing, SPOT-VEGETATION
Introduction
Premium wine production is limited to regions climatically conducive to potential growing grape-variety with balanced composition and varietal typicity and with opportune well vineyard management. For these intricate fusions of climate, genetics, viticulture and enology, phenological observations have been used by Vintners, in some regions, since the Medium Age [1].
Vegetation Phenology is the study of the time of recurring of remarkable life-cycle events of plants and the causes of inter-annual variability timing with regard to biotic and abiotic forces. Vineyard phenological data are essential for making good decision during many phases of grapegrowing, for example: selecting a vineyard site, designing the plantings, planning of labour and determining the best timing of vineyard operations such as soil management, irrigation, pest and disease control, canopy management and harvesting [2]. Phenological data also provide a basis for correlative
1 Faculdade de Ciências, Universidade do Porto, Campus Agrário de Vairão, 4485-661 Vairão, Portugal. [email protected]
I. Manakos and C. Kalaitzidis (Eds.) IOS Press, 2010 © 2010 The authors and IOS Press. All rights reserved. doi:10.3233/978-1-60750-494-8-68
studies with climate and meteorological factors to gauche the behaviour of individual varieties, for predicting their behaviour in new wine regions and indicator of possible climate change [1, 3].
Phenological events have traditionally been ground based, with observations mainly concerning grape varieties over a limited spatial area and few in-season observations. These measurements, generally performed by technical institutions or farmers are subjective, pre-disposed to errors as well as time consuming.
Earth Observation Satellite (EOS) imagery is a cost-effective means for a rapid assessment of the vegetative characteristics of large vineyard areas [4, 5, 6]. However, remote sensing measurements are still constrained by the discontinuous nature of vineyard canopies and architectural differences imposed by shoot positioning trellis. In this case mixed pixels are an integration of vine and inter-row space, that are interdependent of canopy size (opacity), canopy density (greenness) and inter-row dimension. Vineyard canopy can be considered transparent prior to budbreak, rising rapidly with leaf growth to a maximum determined by the total leaf area index. Opacity remains high until leaf fall. Through the early season each leaf retains full photosynthetic capacity, and so canopy greenness at leaf onset is a function only of canopy (and understory) opacity. At the end of the growing season, leaf photosynthesis is gradually reduced through senescence.
In the past few years many vegetation indices extracted from hyperspectral imagery have been tested for evaluating grapevine vegetation growth and/or pigmentation in Mediterranean vineyards [7, 8], but the Normalized Difference Vegetation Index (NDVI) is still the most popular [4, 9, 10].
Time-series of satellite imagery can provide a synoptic view of vineyard vegetation dynamics by measuring surface reflectance at regular time intervals that may be used for vineyard management strategies. In general, time-series NDVI data obtained by EOS include various noise components such as atmospheric disturbances, solar radiation effects, cloud cover, thus noise reduction or fitting a model to observed data is necessary before phenological stages can be determined. Tools for such pre-processing image data include different smoothing processes, for a review see [11, 12, 13, 14].
Time series of different vegetation indices provided by sensors (e.g. MODIS, MERIS, AVHRR and SPOT-VEGETATION) with high revisiting rate (8 to 16 days) and coarse resolution (250 to 1000m) have been used for monitoring the phenology not only in natural ecosystems but also in crops [15, 16]. However, the use of this kind of sensors is limited to extensively contiguous vineyard areas [10]. For this reason, we specifically confine our study to Douro region, the Port wine region, located in Northeast Portugal where the predominant land cover is vineyard with extensive contiguous areas. In Douro region grapevines cover approximately 30% of all the land, but there are some municipality where the vineyard represents more than 80% of land cover. Vineyards in this region are worked by approximately 32000 farmers, each owning an average of 1ha under vines, arising extended contiguous areas with vineyard [17].
The purpose of this work, which is ongoing, is to evaluate the capability of the VEGETATION sensor, to provide quality spectral, spatial and temporal data to identify and assess the grapevine phenology recorded on the ground. To examine the decadal response of satellite information to vineyard phenology variability, a number of different NDVI metrics were obtained through smoothed NDVI time series by double logistic model.
1. Material and methods 1.1. Study area
This work was carried out in Douro region, where viticulture, the main activity, takes place under particularly rigorous climateric conditions, on stony soil that the large majority vineyards are planted in hillsides part of them with steep sloops. The regional climate of Douro is Mediterranean, with evident continental influence and marked annual thermal contrast with strong and consistent post-flowering vine water and thermal stress.
The vineyard inter-row space ranges between 1.8 to 2.1m, and individual grapevine are separated, along the rows, by 1.0 to 1.1m. The planting density ranges between 3500 to 5500 vines per hectare. The single or double Guyot and unilateral and bilateral cordons with a height of 1.3 to 1.6m are the techniques most frequently used for training vines. The red varieties are predominant and the most noteworthy varietals are: Touriga Francesa, Tinta Roriz and Tinta Barroca [17].
In general, vineyards inter-row are managed with natural or snowed grass. Due to the natural limitations in water of the Mediterranean climate, the growth of the grass cover are temporary (between November and the end of spring), due to the choice of the species sowed or in the case of the natural autumn and winter grasses, through the mechanical or chemical control.
1.2. Test sites
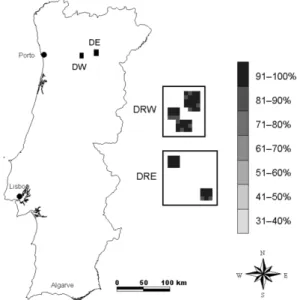
As the VEGETATION images have a pixel of 1 km2, it is important to select only large contiguous areas with vineyard. Two suitable test sites, with most of their area occupied by vineyards were selected within Douro region: Douro Western Region (DWR) and Douro Eastern Region (DER). A detailed representation of the vineyard coverage of these two test sites is presented in figure 1. The test sites have 40 (DWR) and 18 (DER) pixels (of 1×1km), in two compact groups of contiguous pixels, all with 80% or more vineyard coverage. The average vineyard occupancy is 95.3% (DWR) and 97.6% (DER).
1.3. SPOT-VEGETATION data
The ten-day synthesis (‘S10-composited’) dataset from SPOT-VEGETATION was used to produce temporal NDVI profiles for the test sites selected. The software CROP VGT [18] was used to crop a section from the satellite images with the Douro region. The final image set covers a period of 9 years, from 1999 to 2007, with 36 images from each year. For each test site, a total of 324 images were available, between January 1999 and December 2007.
The VEGETATION sensor acquires data in four spectral bands in the visible and near infrared, ranging from 0.43 to 1.75 μm [18]. Values for NDVI, were calculated from the extracted pixel values using the relationship [19]:
(
) ( )
(
near infrared) ( )
red red -infrared near + = NDVI 1where ‘near infrared’ and ‘red’ were the reflectance values in the near infrared and red waveband respectively.
As each NDVI image is obtained by merging data from 10 consecutive days, the whole site was considered as a unit, instead of using a pixel by pixel approach. This is done to prevent misregistration and other sources of errors to contaminate the temporal profiles. The average, median and standard deviation values were computed for each image/site, using only the valid pixels.
A number of PCI Geomatics scripts were developed for a full automatic image processing in order to extract the NDVI profiles in each test site.
1.4. Smoothed process and NDVI metrics
The process of maximum value compositing applied to‘S10-composited’ dataset is not sufficient to eliminate all unrealistic variability from NDVI time series [12]. In order to minimize undesirable noise in the composite NDVI time series, two widely used smoothing procedures were successively applied: an adaptative Savitzky-Golay filter as introduced by [20] to remove outlier and spikier observations and followed by the adjustment of a double logistic function to get two smoothed NDVI curves that govern the grapevine green-up and senescence [15, 16, 21]. The double logistic function models the NDVI, as a function of time (t), using seven parameters:
(
)
[
]
[
(
R)
]
Lf Bb L Bb t IP t d NDVI NDVI k IP t c k NDVI NDVI − − + − + − − − + + = exp 1 exp 1 2where t, is the time variable in day of year (DOY), k is related to the high asymptotical value (no dimension) of NVDI, c and d (day-1) denote the slopes at the “left” and Figure 1. Location of the two test sites with, the details of vineyard coverage. The gray scale corresponds to the fraction of pixel occupied by vineyard. DW- Douro Western and DE- Douro East.
“right” inflection points (IP), respectively, and IPL and IPR are the dates (DOY) of these two points. The NVDIBb and NDVILf are respectively the NDVI values before the Budbreak and during the grapevine dormancy after the leaf fall.
One advantage of using this double logistic function is that the ascendant (green-up) and descendent (senescent) parts can differ in shape. The parameters k (eq. 2) common to both logistic functions, insures continuity between the grapevine development and the senescence part of the curve [15].
The parameters of the logistic function were estimated by the Levenberg– Marquardt algorithm, that requires some reasonable initial guess values [22].
To examine the decadal response of satellite information to vineyard phenology variability, a number of NDVI metrics were obtained by derivatives of the logistic model (eq. 2) adjusted for each year. These satellite-derived phenological metrics were compared with traditional ground phenological observations.
1.5. Ground based phenology
Traditional ground phenological observations for the years 1999 to 2007 were collected on a field located at Adorigo (latitude 40º12’N, longitude 8º23’E) within the DWR test site. The phenological stages observed for the period 1999 to 2007 are: Bubbreak (Bb), Flowering (Fl) and Veraison (Vr) (table 1). No annual information for Harvest (Hv) and Leaf-fall (Lf) were made available.
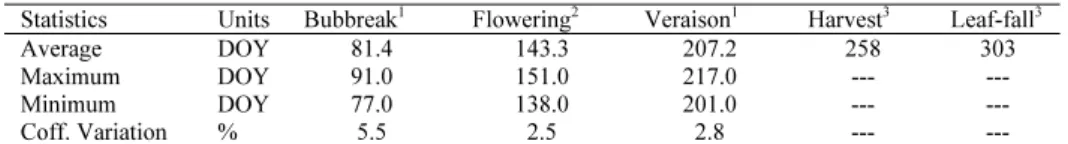
Table 1. Statistics of vineyard phenological stage at Douro region.
Statistics Units Bubbreak1 Flowering2 Veraison1 Harvest3 Leaf-fall3
Average DOY 81.4 143.3 207.2 258 303
Maximum DOY 91.0 151.0 217.0 --- ---
Minimum DOY 77.0 138.0 201.0 --- ---
Coff. Variation % 5.5 2.5 2.8 --- ---
1- 1999 to 2005; 2- 1999 to 2007; 3– information from regional technical institutions.
2. Results and discussion
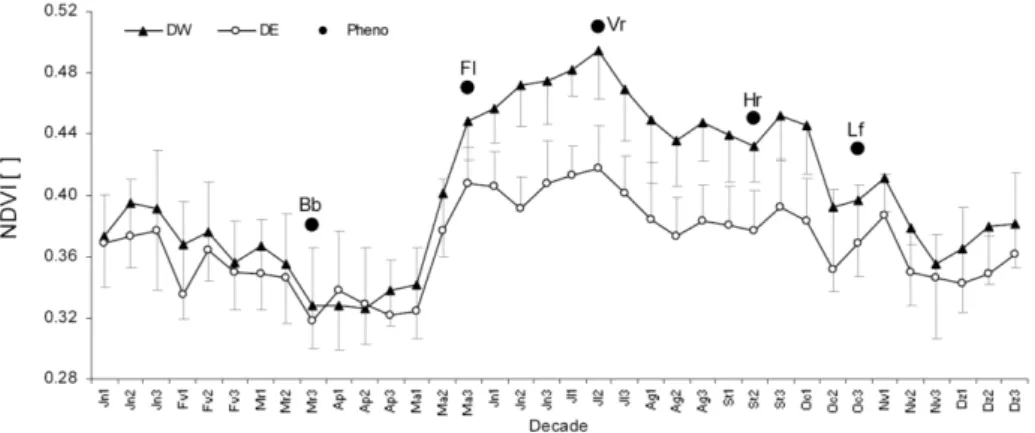
The average temporal NDVI profiles recorded for each decade (10 days) over the period 1999 to 2007 were computed for each test site (figure 2). The NDVI time series show a similar pattern for the two test sites (R2=0.89, n=36, p<0.000). However, DWR shows consistently higher NDVI during the active part of grape vegetative cycle, but the NDVI values outside this period are not very different (figure 2). Since the vineyard varieties and trellis systems are homogeneous between the two test sites, the NDVI differences can be related with the amount of rainfall in each test site: 942 mm (DWR) against 579 mm (DER).
The general shape of the Douro region NDVI temporal profiles is very much what could be expected for a vineyard phenology and canopy development (figure 2).
Grapevine budbreak occurs in March, followed by a period of intensive growth during which the shoots elongate and produces leaves very rapidly [2]. The rate of NDVI increment is very high during a period of 4 weeks after the budbreak, stage and then steadily decreases till the veraison. The period where the rate of NDVI start decreases occur coincides with the average date of flowering stage. During the budbreak period, important variations in the temporal NDVI profiles over the years
(figure 2), could be related with the high transparency of the grapevine canopy and the soil cover differences among years.
The NDVI temporal profile reaches a peak around the grapevine veraison stage, decreasing during the rest of the summer (figure 2). With the senescence and the yellowing of leaves, the photosynthetically inactive elements in the canopy intercept but do not absorve the radiation for photosynthesis [23]. Then the NDVI decreases. After the harvest period, with the rainy autumn the NDVI increases during a short period and then decreases due to the canopy transparency after the leaf-fall.
The parameters and statistics of logistic model adequacy are summarized in table 2. The coefficient of determination (R2) of the logistic function fit (table 2) was always greater than 0.94 (p<0.000).
Table 2. Descriptive statistics of parameters values from fits of logistic model to temporal behaviour of NDVI of grapevines in DRW test site.
R2 NDVIBb K c IPL NDVILf d IPR
Statistics
[ ] [ ] [ ] day-1 DOY [ ] day-1 DOY
Average 0.96 0.365 0.181 0.88 143.2 0.320 0.83 253.1
Maximum 0.99 0.453 0.338 1.13 149.2 0.407 3.37 299.8
Minimum 0.94 0.267 0.097 0.47 131.9 0.249 0.07 205.4
Cv (%) 2.3 15.7 42.8 24.3 3.7 18.3 139.6 10.9
R2- Coefficient of determination
A number of different NDVI metrics were obtained for each year through the transitions dates correspond to the times at which the rate of change in curvature of the logistic model (eq. 2) exhibit local minima or maxima. Then the first (δ1(t)) and second (δ2(t)) derivatives of the smoothed NDVI curve (eq. 2) are calculated, which represent the change and the rate of change in curvature of the logistic model respectively (figure 3). Vineyard “canopy green-up” (Gu) was considered when a maximum change rate (δ2 maximum) and a positive change (δ1>0) occur. The “full canopy” (Fc) was considered when a negative change rate (δ2<0) and a turning point from a positive change to a Figure 2. Average NDVI temporal plots (median 1999-2007) for the 2 regional test sites and ground based phenological stages (pheno): Bb– Budbreak, Fl– Flowering, Vr– Veraison, Hv– Harvest and Lf- Leaf fall. Vertical bar are the half part of the 95% interval confidence for the mean.
negative [(δ1(t) × (δ1(t+1)]<0 occurs (figure 3). The parameters of logistic model for the year 2000 (figure 3) are: NDVIBb=0.255; K=0.274; c=0.274; IPL=155.6; NDVILf=0.357; d=0.360; IPR=288.6; coefficient of determination (R2)=0.97. The values of NDVI metrics obtained by this procedure are summarized in table 3.
IPL Gu IPR Dm Fc Lf Hr Fl Bb Vr 0.25 0.30 0.35 0.40 0.45 0.50 0.55 Mr 2 Mr 3 Ap 1 Ap 2 Ap 3 My 1 My 2 My 3 Jn -1 Jn -2 Jn -3 Jl1 Jl 2 Jl 3 Ag 1 Ag 2 Ag 3 St 1 St 2 St 3
Oc1 Oc2 Oc3 Nv1 Nv2 Nv3 Dc1 Dc2 Dc3 Decade NDV I [ ] -0.02 -0.015 -0.01 -0.005 0 0.005 0.01 0.015 0.02 0.025 0.03 0.035 0.04 0.045 0.05 D eri va tive s [ ] Logistic SGfilter VGT d1(t) d2(t) d(t)=0 NDVI Metrics Pheno
Figure 3. Original (VGT) and smoothed temporal NDVI profiles by the Savitzky-Golay (SG filter) filter and logistic models (Logistic) and rate of changes (δ2(t)) and changes ((δ1(t)) in curvature of the logistic model
and respective NDVI metrics: Gu- Green-up; IPL and IPR- “left” and “right” inflexion point; Fc- Full canopy;
Dm- Dormancy. Groun based phenological stages (Pheno): Bb– Budbreak, Fl– Flowering, Vr– Veraison, Hv– Harvest and Lf- Leaf fall. All the satellite and phenological data refers to the year 2000.
The significant negative correlation between NDVIBb and budbreak date (r=-0.88; n=7; p<0.001) could be interpreted as a response of NDVI to inter-row cover crop vigour. High NDVIBb before the budbreak period, generally characterised by vigorous vegetation on the inter-row spacing, could be related with high soil moisture at this period and/or high temperatures. Since, soil water content is high at budbreak due to heavy winter rainfall, it does not restrict vegetation growth early in the season, thus it is reasonable to suppose that temperature increase during this period could induce drought and advance budbreak. There is ample evidence that budbreak date in Mediterranean climate hastened by higher temperature during the latter part of winter [2, 23].
Table 3. Statistics of NDVI metrics extracted from logistic function
Statistics Green-up Full Canopy Dormancy
DOY Average 128.1 218.1 259.9 Coef. variation (%) 5.8 4.4 9.7 NDVI Average 0.360 0.470 0.428 Coef. variation (%) 8.7 5.1 9.7
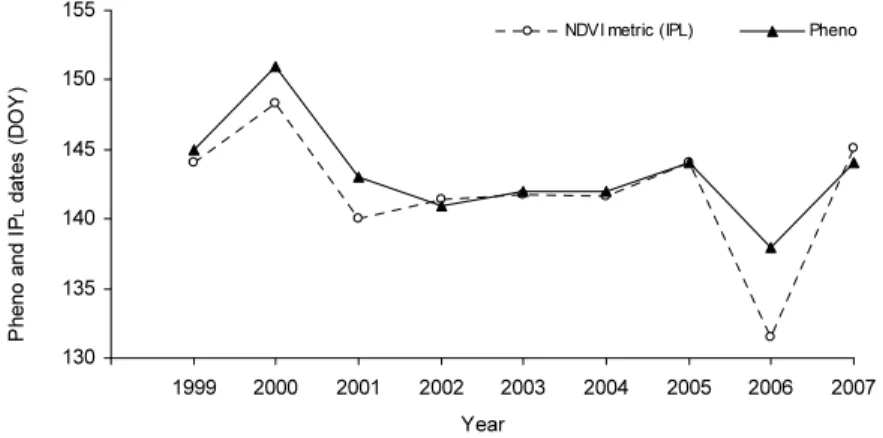
The flowering date was 143 DOY and ranged from 138 to 151 DOY. The relationship between the left inflexion date extracted from the logistic model and flowering date over the studied years are presenting in figure 3. The satellite derived IPL NDVI metrics was found to be significantly correlated with grapevine flowering date (r=0.81; n=9; p<0.001). For the period 1999 to 2007, with 9 annual data records,
descriptive statistics show that 89% of the cases had differences between ground-based vineyard phenology and satellite-derived flowering (IPL) below 3 days and the largest deviation was 6.5 days (figure 4). The field measurements is always later than the flowering satellite based.
130 135 140 145 150 155 1999 2000 2001 2002 2003 2004 2005 2006 2007 Year P h eno and IPL d a te s (DO Y )
NDVI metric (IPL) Pheno
Figure 4. Relationship between ground based vineyard flowering date (“Pheno”) and left inflexion date (IPL) extracted from the logistic model over the studied years.
The flowering date marks the transition from the vegetative to the reproductive grape physiological process and also the star of fruit set period, a crucial stage for grape modelling and vineyard operations [23]. On the other hand, this date is of particular interest since it determines any advance or delay in the grape vine cycle. For example, the date of flowering is important to determine the date of harvest, because there is a constant number of temperature units (mean temperature >10ºC) accumulated during the days between flowering and harvest [2, 23].
The satellite derived full canopy date (Fc) was found to be significantly correlated to the veraison date (r=0.87; n=7; p<0.02). At veraison stage grapevine canopy is fully developed and berry ripening processes occur. While berries ripen, the shoot stems lignify and becomes canes, the buds become dormant, and some basal leaves abscise [2, 23].
The right inflexion date (IPR) extracted from the logistic model and the dormancy (Dm) NDVI metrics, seem to occur in the similar date of harvest and leaf fall. However, currently no annual phenological information is available to supports this relationship.
3. Conclusion
Ten-day VEGETATION images from 1999 to 2007 were used to examine spatial patterns in the NDVI and their relationship with ground based observation of grapevine phenology.
Despiste challenges posed by the discontinuous nature of vineyard canopies, according to results obtained in the Douro region, the phenology based on EOS images would be a valuable tool for vineyard monitoring. The VEGETATION sensor has proven very useful for vineyard monitoring despite the low spatial resolution of the
images. Preliminary results suggest a great sensibility of satellite derived phenological metrics to detect flowering and veraison, that are crucial phenological phases, respectively for the grapevine reproductive and maturity process.
The NDVI profile is appropriated for describing general characteristics of the vineyard phenology and canopy development. Refinements to the model can allow capturing variations within the growing season due to infestation of insects, and exceptional drought or temperature which can cause diminished photosynthetic activity, leaf discoloration. However, much more field work in different regions and vineyard characteristics (mostly the inter-row space), is need before conclusions can be drawn.
Satellite data provides an efficient procedure to assess at grape phenology since it is less time consuming and leads to fewer errors than the traditional phenological observations actually used in viticulture. An operational phenological tool based on remote sensing data can be implemented for decision support in vineyard management.
Acknowledgements
The authors wish to thanks the VEGETATION programme for providing the satellite data. We acknowledge the contribution of João Pedro Pereira SUBVIDOURO, Qta Valmor, Folgosa do Douro for the phenology data. Fundação para a Ciência e Tecnologia FCT (project - PTDC/AGR-AAM/67182/2006) for the financial support.
References
[1] Chuine, I., Yiou, P., Viovy, N., Seguin, B., Daux, V. &Ladurie, E. L. (2004). Historical phenology: Grape ripening as a past climate indicator. Nature 432(7015): 289-290.
[2] Boulton, R. B., Singleton, V. L., Bisson, L. F. &Kunkee, R. E. (1996). Principles and Practices of Winemaking. Springer.
[3] Jones, G. &Davis, R. (2000). Using a synoptic climatological approach to understand climate-viticulture relationships. International Journal of Climatology 20(8): 813-837.
[4] Hall, A., Lamb, D. W., Holzapfel, B. &Louis, J. (2002). Optical remote sensing applications in viticulture - a review. Australian Journal of Grape and Wine Research 8(1): 36-47.
[5] Dobrowski, S. Z., Ustin, S. L. &Wolpert, J. A. (2003). Grapevine dormant pruning weight prediction using remotely sensed data. Australian Journal of Grape and Wine Research 9(3): 177-182.
[6] Johnson, L. F., Roczen, D. E., Youkhana, S. K., Nemani, R. R. &Bosch, D. F. (2003). Mapping vineyard leaf area with multispectral satellite imagery. Computers and Electronics in Agriculture 38(1): 33-44. [7] Zarco-Tejada, P. J., Berjón, A., López-Lozano, R., Miller, J. R., Martín, P., Cachorro, V., González, M.
R. &de Frutos, A. (2005). Assessing vineyard condition with hyperspectral indices: Leaf and canopy reflectance simulation in a row-structured discontinuous canopy. Remote Sensing of Environment 99(3): 271-287.
[8] Hall, A., Louis, J. P. &Lamb, D. W. (2008). Low-resolution remotely sensed images of winegrape vineyards map spatial variability in planimetric canopy area instead of leaf area index. Australian Journal of Grape and Wine Research 14(1): 9-17.
[9] Lamb, D. W., Weedon, M. M. &Bramley, R. G. V. (2004). Using remote sensing to predict grape phenolics and colour at harvest in a Cabernet Sauvignon vineyard: Timing observations against vine phenology and optimising image resolution. Australian Journal of Grape and Wine Research 10(1): 46-54.
[10] Cunha, M., Marçal, A. &Silva, L. (2009). Very early prediction of wine yield based on satellite data from VEGETATION. International Journal of Remote Sensing (in press).
[11] Reed, B. C., White, M. &Brown, J. F. (2003). Remote sensing phenology. Phenology: An Integrative Environmental Science 39: 365-381.
[12] Jonsson, P.&Eklundh, L. (2004). TIMESAT - a program for analyzing time-series of satellite sensor data. Computers & Geosciences 30(8): 833-845.
[13] Tao, F., Yokozawa, M., Zhang, Z., Hayashi, Y. &Ishigooka, Y. (2008). Land surface phenology dynamics and climate variations in the North East China Transect (NECT), 1982-2000. International Journal of Remote Sensing 29(19): 5461-5478.
[14] Hird, J. N. &McDermid, G. J. (2009). Noise reduction of NDVI time series: An empirical comparison of selected techniques. Remote Sensing of Environment 113(1): 248-258.
[15] Fischer, A. (1994). A model for the seasonal variations of vegetation indices in coarse resolution data and its inversion to extract crop parameters. Remote Sensing of Environment 48(2): 220-230.
[16] Zhang, X., Friedl, M. A., Schaaf, C. B., Strahler, A. H., Hodges, J. C. F., Gao, F., Reed, B. C. &Huete, A. (2003). Monitoring vegetation phenology using MODIS. Remote Sensing of Environment 84(3): 471-475.A.N. Author, Book Title, Publisher Name, Publisher Location, 1995.
[17] IVDP (2009). Instituto dos Vinhos do Douro e Porto,. Available online at http://www.ivv.min-agricultura.pt/estatistica, assessed 9 July 2009).
[18] VITO 2008, free VEGETATION Products. Available online at http://free.vgt.vito.be/ assessed 1 April 2008).
[19] Rouse, J. W., Haas, R. H., Schell, J. A. &Deering, D. W. (1973).Monitoring vegetation systems in the great plains with ERST. In Proceedings of the third ERST Symposium, NASA SP-351 1 309-317: U.S. Government Printing Office, Washington DC.
[20] Chen, J., Jonsson, P., Tamura, M., Gu, Z. H., Matsushita, B. &Eklundh, L. (2004). A simple method for reconstructing a high-quality NDVI time-series data set based on the Savitzky-Golay filter. Remote Sensing of Environment 91(3-4): 332-344.
[21] Beck, P. S. A., Atzberger, C., Høgda, K. A., Johansen, B. &Skidmore, A. K. (2006). Improved monitoring of vegetation dynamics at very high latitudes: A new method using MODIS NDVI. Remote Sensing of Environment 100(3): 321-334.
[22] Montgomery, D., Peck, A. &Vining, G. (2006). Introduction to linear regression analysis. New York: John Wiley-Interscience.