Recebido para publicação em 4/3/2008 Aceito para publicação em 26/6/2009 (002706)
1 Programa de Pós-Graduação em Engenharia Química – PEQ, Universidade Estadual de Maringá – UEM, Av. Colombo, 5790, Bloco E46-Sala 09, CEP 87020-900, Maringá – PR, Brasil, E-mail: lmmj@deq.uem.br
2 Departamento de Engenharia de Alimentos, Universidade Estadual do Centro-Oeste – UNICENTRO, Rua Simeão Camargo Varela de Sá, 03, CEP 85040-080, Guarapuava – PR, E-mail: mcoutinho@unicentro.br
3 Departamento de Engenharia de Alimentos, Universidade Tecnológica Federal do Paraná – UTFPR, Campus Campo Mourão, BR 369-Km 0,5, CP 271, CEP 87301-006, E-mail: wagner@deq.uem.br
4 Departamento de Engenharia Química, Universidade Federal do Paraná – UFPR, Centro Politécnico, Jardim das América, CP 19011, CEP 81531-990, Curitiba – PR, Brasil, E-mail: rjorge@ufpr.br
5 Faculdade de Engenharia Química, Universidade Estadual de Campinas – UNICAMP, Cidade Universitária Zeferino Vaz, CP 6066, CEP 13081-970, Campinas – SP, Brasil, E-mail: maciel@feq.unicamp.br
*A quem a correspondência deve ser enviada
Application of the Hsu model to soybean grain hydration
Aplicação do modelo de Hsu à hidratação de grãos de soja
Mônica Ronobo COUTINHO1,2, Wagner André dos Santos CONCEIÇÃO1,3,
Paulo Roberto PARAÍSO1, Cid Marcos Gonçalves ANDRADE1, Edilson Sadayuki OMOTO1, Regina Maria Matos JORGE1,4, Rubens MACIEL FILHO5, Luiz Mario de Matos JORGE1*
1 Introduction
The soaking process is an important step in the production of traditional soybean-derived foods such as soymilk (NELSON; STEINBERG; WEI, 1976) and tofu (CIABOTTI et al., 2007). Water absorption modifies the grain texture, which affects subsequent grinding, soymilk production or protein extraction steps (LO et al., 1968; PAN; TANGRATANAVALEE, 2003). Soaking is also important during the processing of other
foods, as in rice parboiling (ENGELS et al., 1986; AHROMRIT; LEDWARD; NIRANJAN, 2006), in sorghum flour preparation (ADEYEMI, 1983), and in the production of canned grains such as corn and peas. Moreover, grain hydration reduces cooking time, minimizes losses, and improves the quality of the obtained products (WANG et al., 1979). Humidification is also present in bench-scale cereal drying (CALADO, 1993; BARROZO;
Resumo
Desenvolveu-se uma análise comparativa do estudo teórico-experimental efetuado por Hsu sobre a hidratação de grãos de soja Amsoy 71 a partir da execução de diversos ensaios de hidratação de soja CD 202 nas temperaturas de 10, 20, 30, 40 e 50 °C, medindo-se a umidade ao longo do tempo. Os resultados revelam que o valor da umidade de equilíbrio, Xeq, da soja CD 202 independe da temperatura e é 21% superior àquele encontrado por Hsu, sugerindo que a variedade de soja exerce grande influência sobre Xeq. O modelo de Hsu foi resolvido numericamente e teve seus parâmetros ajustados pelo método dos mínimos quadrados, apresentando desvios máximos de +/-10% em relação aos valores experimentais. A etapa limitante do processo de transferência de massa na hidratação corresponde à difusão de água no interior do grão, conduzindo ao surgimento de gradientes radiais de umidade que diminuem com o aumento da temperatura e do tempo. Independentemente da variedade de soja utilizada, a difusividade aumenta com a elevação da temperatura e do teor de umidade, porém os valores desta propriedade de transporte para soja Amsoy 71 foram superiores aos da CD 202, sendo muito próximos no início da hidratação a 20 °C e quase três vezes maior ao final da hidratação a 50 °C.
Palavras-chave: hidratação; modelagem matemática; parâmetros distribuídos; difusividade mássica; umidade de equilíbrio.
Abstract
A comparative analysis of the theoretical-experimental study, developed by Hsu on the hydration of Amsoy 71 soybean grain, was performed through several soaking experiments using CD 202 soybean at 10, 20, 30, 40, and 50 °C, measuring moisture content over time. The results showed that CD 202 soybean equilibrium moisture content, Xeq, does not depend on temperature and is 21% higher than that found by Hsu, suggesting that soybean cultivar exerts great influence on Xeq. The Hsu model was numerically solved and its parameters were adjusted by the least squares method, with maximum deviations of +/– 10% relative to the experimental values. The limiting step in the mass transfer process during hydration corresponds to water diffusion inside the grain, leading to radial moisture gradients that decrease over time and with an increase in temperature. Regardless of the soybean cultivar, diffusivity increases as temperature or moisture content increases. However, the values of this transport property for Amsoy 71 were superior to those of CD 202, very close at the beginning of hydration at 20 °C and almost three times higher at the end of hydration at 50 °C.
2 Materials and methods
2.1 Equipment and experimental procedure
The equipment used in this work consisted of a thermostatic bath that is represented in Figure 1. Inside the bath, a rectangular aluminum tray containing soybean and water (26.5 cm long, 18 cm wide, 5 cm deep) was placed. The soybean cultivar used in the experiments, CD 202, was donated by Maringá Agriculture Cooperative (COCAMAR) and presented a mean diameter of 6.17 mm and a moisture content of 10.3% (d.b.).
Experiments were performed according to the sequence detailed below:
1) Soybean was exposed to ultraviolet light for 30 minutes; 2) One liter of sodium benzoate diluted aqueous solution
(0.1% in mass) was added to the aluminum tray, and the set was placed in the thermostatic bath at a fixed temperature: 10, 20, 30, 40 or 50 °C;
3) As soon as the set reached the bath temperature, 300 ± 0.01 g of soybean were added and the soaking time counting was started;
4) Soybean hydration was followed by removing the small soybean samples in predetermined time intervals: 0, 1, 5, 10, 15, 20, 30, 40, 60, 80, 100, 130, 160, 190, 220, 250, 420, 540, 720, and after that at every 240 minutes up to the end of the test (72 to 84 hours);
5) Each collected sample was rapidly placed on kitchen paper to remove excess superficial water, then moved to a previously weighed Petri dish and taken to the oven for moisture content determination by the classic drying method at 105 °C for 24 hours (INSTITUTO ADOLFO LUTZ, 1985).
CALADO; CALÇADA, 1991) and studies of cereal germinative capacity as a function of initial moisture content (BECKERT; MIGUEL; MARCOS FILHO, 2000).
Water absorption by soybean grain during soaking depends mainly on the time-temperature binomial. The amount of absorbed water increases as soaking time and temperature increase (WANG et al., 1979; SOPADE; OBEKPA, 1990; CHOPRA; PRASAD, 1994; PAN; TANGRATANAVALEE, 2003).
Models that represent the hydration of grains have been developed to predict the necessary time to obtain the desired moisture content at a certain temperature, representing the dynamic behavior of the soaking process. These models may basically be empirical or phenomenological.
Empirical models are generally obtained from simple mathematical correlation of experimental data. Singh and Kulshrestha (1987), Peleg (1988), Sopade and Obekpa (1990), and Pan and Tangratanavalee (2003), for example, used empirical models.
On the other hand, phenomenological models consider the elementary steps of diffusion and/or convection mass transfer, they may be of lumped or distributed parameters, and generally present the main process tendencies, even in conditions other than those in which they were validated. Lumped parameter models are often represented by ordinary differential equations and do not consider possible moisture variations inside the grain, whereas distributed parameter models are formed by partial differential equations and are capable of representing the variations in moisture profiles inside the particle over time.
Among the studies on phenomenological models, those of Coutinho et al. (2005, 2007), with the lumped parameter approach, and those of Hsu (1983a,b), using the distributed parameter approach, are remarkable.
Hsu (1983a) developed a phenomenological model that was fitted to the experimental data of Amsoy 71 soybean soaking at a single temperature (30 °C) for only 10 hours and considered that after this period the moisture content of the grain had reached equilibrium. Hsu (1983b) applied the same model to study the Amsoy 71 soybean soaking at different temperatures: 20, 30, 40, and 50 °C. However, he only published a research note with the model parameters adjusted to experimental data, presenting neither the analysis of concentration profiles over time and along the radius, generated by the simulations, nor the experimental data used in the fitting or the equilibrium conditions.
In this context, the main objectives of this work were: 1) To apply the Hsu (1983a) model to represent the hydration profiles of CD 202 cultivar soybean grain over time and along the radius, validating it with experimental data obtained at several temperatures; 2)To compare the results presented by Hsu (1983a,b) with those obtained in this work, developing a joint analysis; 3) To analyze the influence of temperature, initial moisture content and soaking time on the moisture profiles inside the grain; 4)To estimate and to evaluate the behavior of water diffusivity in the soybean grain as a function
S = 0 for every r* and t* = 0 (8)
* *
S
0 for r = 0 r
∂ =
∂ (9)
( )
–Bt* 2K 1-e
* 0
1 R
S = e -1 for r* = 1, with B =
K D
β
(10)
2.3 Numerical solution for the model
In this work the adimensional form of Hsu’s model was numerically solved through the discretization of the radial S derivatives by finite differences (CRANK, 1975) and numerical integration of the resulting system of ordinary differential equations, as described below.
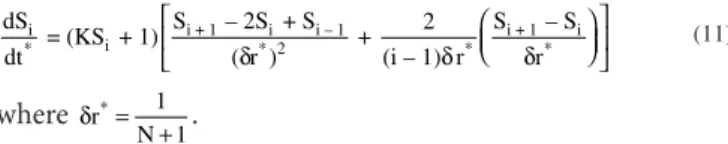
Discretization of the radial derivatives of Equation 7 by finite differences yields Equation 11, which is valid for the internal points (i = 2 to i = N + 1), illustrated in Figure 2.
δ δ δ
i i + 1 i i – 1 i + 1 i
i
* * 2 * *
dS S – 2S + S 2 S – S = (KS + 1) +
dt ( r ) (i – 1) r r (11)
where re r* 1
N 1
δ = + .
For i = 1 (r* = 0) one considers S1 = S2, obeying the symmetry condition (Equation 10) discretized by forward finite differences.
For i = N + 2 (r* = 1) the second boundary condition (Equation 10) was used in its derivative form for r* = 1, according to Equation 12. The derivative form of this boundary condition was adopted just for numerical convenience.
* -Bt
K(1 - e ) *
[e –Bt ] N + 2
*
dS = Be
dt (12)
By doing so, N + 1 ordinary differential equations resulted. These were simultaneously integrated over soaking time by using the ode45 routine in the MATLAB® software.
2.4 Individual model fitting
Parameters k1, β, and D0 were evaluated by fitting the model to experimental data using fmins routine in MATLAB®
to minimize the objective function 2 2
calc exp
(x x )
φ = ∑ − , which represents the sum of quadratic deviations.
For each instant of time the model simulation yields N + 2 values for X, each one corresponding to a radial position. To compare these values to the experimental data that represent 2.2 Mathematical modeling
The Hsu (1983a) model, which was used in this work, was developed from a mass balance in a differential volume element, Equation 1, considering soybean grain to be spherical with constant volume and radial diffusivity (D) as exponentially varying with grain moisture content, as in Equation 2. D0 is a pre-exponential factor that represents the value for water diffusivity in the grain when moisture content (X) equals zero; k1 is an exponential factor.
∂ ∂ ∂
∂ 2∂ 2 ∂
X 1 X
= r D
t r r r (1)
D = D0eK1X (2)
The model solution represents the variation of moisture content (X) as a function of radial position (r) and time (t) until the equilibrium value (Xeq) is reached. It was numerically obtained considering one initial condition and two boundary conditions. As initial condition, at the initial time (t = 0) the grain moisture content (X0) is considered as known and independent of radial position (Equation 3). The boundary conditions establish the grain central symmetry (in r = 0) in any instant of time (t) (Equation 4) and the moisture content variation at the solid-fluid interface (r = R), represented by Equation 5.
X = X0 for any r in t = 0 (3)
∂ ∂
X
= 0 for = 0 and t > 0
r (4)
(
– t)
– teq 0
X = 1 – eβ X + X eβ for r = R and t > 0 (5)
Equation 5 defines the behavior of the moisture content (X) at the surface of the grain with radius (R) over time as a first order process with constant saturation rate (β). A similar condition was successfully used by Long and Richman (1960) to describe organic vapors diffusion in glassy polymers.
With the objective of simplifying the numerical solution of his model, Hsu (1983a) introduced four adimensional variables:
the variable S, defined by Equation 6, the radial position r =* r
R,
the time * *0 2
tD t =
R , and the moisture content
* 0
eq 0
X – X X =
X – X .
(
)
(
)
∫
* * X * KX 1 1 0 1 1S = D dX = e – 1 = D – 1
K K (6)
In these equations * k X1 0
0 0
D = D e , K=k X1
(
eq−X0)
, and1 * 0 D D D = .
This way, the adimensional form of the model (Equation 7) was obtained. Its initial and boundary conditions are represented by Equations 8, 9, and 10.
∂ ∂ ∂ ∂ ∂ ∂ 2 1
* *2 * *
S S 2 S
= D +
t r r r (7) Figure 2. Schematic representation of the discretization points.
i 0
1
1
2 3 . . . N N + 1 N + 2
Thus, it is likely that the 21% difference between the Xeq value obtained in this work and that reported by Hsu (1983a) is mainly due to using distinct soybean cultivars, with a minor influence of the soaking time.
3.2 Analysis and determination of N value
The right choice of the number of internal points (N) is fundamental for an adequate representation of the numerical solution of the model. While an excessively small number of points may lead to non-realistic numerical solutions and fitted parameters, an excessively high number can make impracticable the numerical solution due to a processing time that is far too long. The best procedure is to determine the smallest number of discretization points that could preserve the representability of the mathematical model’s numerical solution.
the mean value of the grain moisture content in each instant of time, the grain average moisture content (Xcalc) was determined from Equation 13, which had its integrals numerically solved by the trapezoidal method using the “trapz” command in MATLAB®.
∫
∫
R 2 0 calc r 2
0
X.(r )dr X =
r dr
(13)
3 Results and discussion
3.1 Experimental data quality evaluation
In Figure 3 one can make a comparative analysis between the experimental soybean (CD 202 cultivar) moisture measurements over time at 30 °C, performed in this work, and those accomplished by Hsu (1983a,b) with Amsoy71 cultivar. Concerning the experimental conditions, some differences can be highlighted.
Hsu performed soybean soaking tests for only 10 hours. However, it was verified in the present work that this period was not long enough for the soybean-water system to reach equilibrium condition. Nonetheless, for longer soaking periods, CD-202 soybean fermented, making the tests unfeasible. This problem was bypassed by applying a pretreatment with ultraviolet light, to reduce the soybean microorganism contents, followed by the addition of a small amount of sodium benzoate (1 g.L–1 H
2O) to inhibit fermentation, thus rendering possible
the tests for a much longer period (72 to 84 hours).
Hsu essays were performed with soybean grain that had initial moisture content of 0.55 kgH2O/kgDS. Furthermore, he took the soybean moisture content after 10 hours (36000 seconds) as the equilibrium moisture content (Xeq = 1.452 kgH2O/kgDS), which is questionable, considering the behavior observed in Figure 3, with the results tending to equilibrium but without a well-defined value.
However in this work, using a different soybean cultivar (CD 202), with much lower initial moisture content (Xo = 0.103 kgH2O/kgDS), enabled exploring a wider range of moisture contents with a better-defined tendency to equilibrium at the end of the essays.
Admitting equilibrium conditions at the end of both tests, presented in Figure 3, the value obtained for CD 202 soybean (Xeq = 1.758 kgH2O/kgDS) was 21% higher than that found by Hsu (1983a) using 10h-hydrated Amsoy 71 soybean.
A question arose: whether this higher Xeq value for CD 202 was a consequence of the applied soaking technique with the addition of a small amount of sodium benzoate, of using a different soybean cultivar, or of using a longer soaking time.
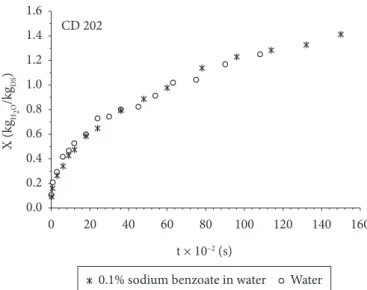
Figure 4 shows the results of two soybean soaking essays at 30 oC, one using pure water and the other using a diluted
aqueous solution of sodium benzoate (0.1% in mass), suggesting that the addition of a small amount of sodium benzoate to the water did not significantly influence the soaking process.
Figure 3. Moisture content profiles for soybean soaking at 30 °C. 0.0
0.2 0.4 0.6 0.8 1.0 1.2 1.4 1.6 1.8 2.0
0 50 100 150 200 250 300
t × 10–3 (s)
X (kg
H2O
/kg
DS
)
CD 202 Amsoy 71 (HSU, 1983a)
Figure 4. Influence of sodium benzoate addition to soaking water (0.1%) at 30 °C.
0.0 0.2 0.4 0.6 0.8 1.0 1.2 1.4 1.6
0 20 40 60 80 100 120 140 160
t × 10–2 (s)
X (kg
H2O
/kg
DS
)
probably be due to the much higher soybean initial moisture content he used, in order to compare the soybean used in the present work.
The velocity of grain hydration at a given temperature is known to be directly proportional to the difference between its water concentration at equilibrium conditions and at a given instant of time (Xeq – X). This difference is sometimes called the driving force of the mass transfer process between solid and fluid. Therefore, the greater this difference, the more distant the soybean is from the equilibrium conditions and the faster the hydration will occur. This is why hydration is fast at the beginning, with the maximum value of driving force (Xeq – Xo) occurring at t = 0s (Figure 3), and with large radial variations of X (Figure 5), which decrease over time until the equilibrium condition is reached (Xeq), when the grain moisture content remains constant and the driving force becomes null.
The greatest challenges for obtaining a representative numerical solution with only 19 points are at the initial instants (0 to 20 minutes), as seen in Figure 5, since hydration velocity is high at the beginning of the process, leading to sudden variations in the radial moisture content profiles, thus requiring a greater number of internal discretization points for an adequate representation.
One can determine from Figure 3 that at the beginning of the soaking process, with Xo = 0.55 kgH2O/kgDS, the driving force (Xeq – Xo) is 0.902 kgH2O/kgDS for the Hsu test at 30 °C, whereas for the conditions of this work (Xo = 0.103 kgH2O/kgDS and Xeq = 1.758 kgH2O/kgDS) the driving force is almost two times higher (Xeq – Xo = 1.655 kgH2O/kgDS).
These results make evident that the driving force, at the beginning of soaking under the experimental conditions of this work, was much higher than that found by Hsu (1983a), providing larger water transfer rates to the interior of the soybean grain and, therefore, more intense radial moisture Figure 5 shows the simulated moisture content values as
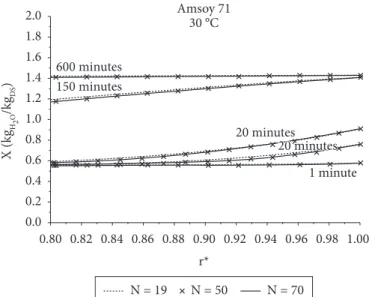
a function of adimensional radius (r*) obtained with three N values for several instants of time using the parameters presented in Table 1, relative to CD 202 soybean at the temperature of 30 °C and Xo = 0.103 kgH2O/kgDS. One can observe that there is no significant variation between 50 and 70 internal discretization points, but computational processing time demand increases significantly for 70 points. Therefore, N = 50 was chosen, for combining a fine grid and a feasible computational processing time.
The greatest radial moisture content variations in the soybean particle occur near the grain surface (0.80 ≤ r* ≤ 1) in the first soaking instants (0 ≤ t ≤ 20 minutes), when the numerical solution with 19 internal points keeps away from that obtained with N = 50 (Figure 5). However, it is clear that the longer the soaking time, the smaller the radial moisture content variations and the number of internal discretization points that are necessary to represent the numerical solution of the model. In the first minute 19 internal points are not enough, with a large distance from the numerical solution with 50 points, while this distance becomes smaller over time due to the smoothing of the radial moisture content profiles. After 150 minutes this distance is very small.
It is interesting to notice that the number of internal discretization points used by Hsu (1983a) (N = 19) is much smaller than that used in this work (N = 50), suggesting a more in-depth examination of his numerical solution quality. Therefore, Figure 6 presents the simulation results from the Hsu model using his parameters (Table 1) and his experimental conditions: soybean soaking with initial moisture content of 0.55 kgH2O/kgDS at a temperature of 30 °C for 10 hours.
By analyzing Figure 6, one can conclude that in the Hsu (1983a,b) experimental conditions the use of 19 internal points led to an adequate numerical solution. This result is
Figure 5. Effect of N on the simulations in the explored experimental conditions.
0.0 0.2 0.4 0.6 0.8 1.0 1.2 1.4 1.6 1.8 2.0
r*
X (kg
H2O
/kg
DS
)
0.80 0.82 0.84 0.86 0.88 0.90 0.92 0.94 0.96 0.98 1.00 CD 202
30 °C
N = 19 N = 50 N = 70
600 minutes
150 minutes
20 minutes
10 minutes 15 minutes
5 minutes
1 minute
Figure 6. Effect of N on the simulations in the Hsu experimental conditions (1983a,b).
0.0 0.2 0.4 0.6 0.8 1.0 1.2 1.4 1.6 1.8 2.0
r*
X (kg
H2O
/kg
DS
)
0.80 0.82 0.84 0.86 0.88 0.90 0.92 0.94 0.96 0.98 1.00
N = 19 N = 50 N = 70
Amsoy 71 30 °C
600 minutes 150 minutes
20 minutes 20 minutes
content variations, which required more internal discretization points, as verified by analyzing the simulations using the conditions of this work (Figure 5) and those of Hsu (Figure 6) for several N values.
The behavior of the radial moisture content profiles near the grain wall (r* ≈ 1) at the first instants of soaking determines the value of N. In these conditions the largest radial moisture content variations appear, requiring more discretization points for a satisfactory numerical representation.
As previously discussed, the initial grain moisture content (Xo) has great influence on the radial moisture gradients and, therefore, on the value of N. Besides Xo, temperature also exerts some influence on the necessary number of discretization points. According to the behavior displayed in Figures 7 and 18, a decrease in soaking temperature leads to increase in radial moisture gradients, enlarging the difference between the numerical solutions obtained with 19 and 50 points and evidencing that the lower the temperature, the larger the necessary N value for the model numerical solution.
In spite of the temperature influence on N, the value chosen for N (50) was suitable for the whole explored temperature range (10-50 °C), since in all of it the numerical representation of the model with 50 internal points was equivalent to that with 70 points.
3.3 Parametric sensitivity study
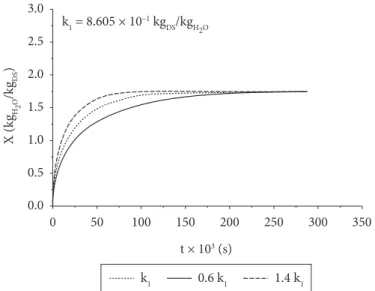
The effect of k1, D0, and β parameters on model predictions is presented in Figures 8, 9, and 10, respectively, using as reference the values obtained with the fitting at 10 °C shown in Table 1.
Variations of +/– 40% in k1 or D0 parameters led to significant modifications of the model predictions, as observed in Figures 8 and 9. However, the effect of β was very small, as displayed in Figure 10, showing that the model is much less sensitive to β than to k1 and D0 parameters.
Figure 7. Temperature influence on N. 0.0
0.1 0.2 0.3 0.4 0.5 0.6 0.7 0.8 0.9 1.0
r*
X (kg
H2O
/kg
DS
)
0.80 0.82 0.84 0.86 0.88 0.90 0.92 0.94 0.96 0.98 1.00
N = 19 N = 50 N = 70
CD 202
1 minute
50 °C
10 °C
Figure 8. Effect of k1 on the model predictions. 0.0
0.5 1.0 1.5 2.0 2.5 3.0
0 50 100 150 200 250 300 350
t × 103 (s)
X (kg
H2O
/kg
DS
)
k1 = 8.605 × 10⁻¹ kg
DS/kgH2O
k1 0.6 k1 1.4 k1
Figure 9. Effect of D0 on the model predictions. 0.0
0.5 1.0 1.5 2.0 2.5 3.0
0 50 100 150 200 250 300 350
t × 103 (s)
X (kg
H2O
/kg
DS
)
D0 = 7.947 × 10⁻¹² m2.s–1
D0 0.6 D0 1.4 D0
Figure 10. Effect of β on the model predictions. 0.0
0.5 1.0 1.5 2.0 2.5 3.0
0 50 100 150 200 250 300 350
t × 103 (s)
X (kg
H2O
/kg
DS
)
k1 0.6 k1 1.4 k1
β = 5.078 × 10⁻³ s–1
temperature increases gradually as the temperature increases, reaching the maximum value at 50 °C, whereas in this work the β parameter obtained is 11.2 times greater than that reported by Hsu (1983b).
As shown in Figure 12, k1 values obtained in this work agree with those obtained by Hsu (Table 1). Both present the same 3.4 Conjoint analysis of model parameters
Despite the parametric sensitivity study having revealed a much lower influence of β than k1 and D0, an option was made for the simultaneous estimation of all three parameters according to Hsu’s approach (1983a). The obtained values are listed in Table 1, along with those presented by Hsu (1983b).
Among the three parameters, the values obtained in this work for k1 were the closest to those presented by Hsu (1983b), whereas the values obtained for β were the most distant ones, 10 to 15 times greater, as observed in Table 1. This distance means very little, due to the very low sensitivity of the model to this parameter, which may be considered just a fitting parameter without any physical meaning. As for the values of D0 and k1, they were respectively 50 and 12%, on average, lower than those obtained by Hsu (1983b), and do have physical meaning, since they represent the constants in Equation 2, which defines the water diffusion coefficient inside soybean grains.
The differences among the parameter values presented by Hsu (1983a,b) and those obtained in this work may be ascribed to several factors:
1) The soybean cultivar used by Hsu (1983a) was Amsoy 71, whereas in the present work CD 202 cultivar was used. This can affect soaking time and soybean properties, as already verified by Klamczynska, Czuchajowska and Baik (2001) while studying the soaking of different pea cultivars; 2) Hsu performed tests using soybean grain that had
initial moisture content of 0.55 kgH2O/kgDS, whereas in this work the starting material had moisture content of 0.103 kgH2O/kgDS, enabling to explore a wider hydration range. However, a considerable expanded hydration range may also imply extensive modification of the grain’s structural properties, which can exert some influence on the adjusted parameters; and
3) The soaking time used in the present work (84 hours or 302400 seconds) was 8.4 times greater than that applied by Hsu (10 hours or 36000 seconds), making it possible to obtain a substantially greater number of experimental measurements and to reach better-defined equilibrium conditions at the end of the test.
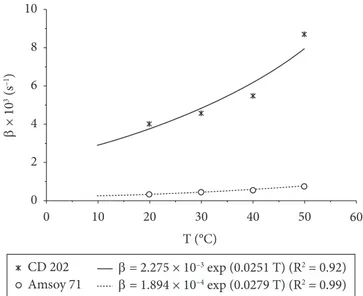
Hsu (1983b) states that β shows an exponential behavior regarding temperature. One can see in Figure 11 that β values presented by Hsu, as well as those obtained in this work (Table 1) were well correlated by exponential regression as functions of temperature (T) in the range explored by Hsu (20 to 50 °C). However, the difference between these two β values for the same
Table 1. Parameters estimated in the present work and by Hsu (1983a,b).
Present work CD 202 cultivar
Hsu (1983a,b) Amsoy 71 cultivar
T (ºC) k1 × 10 (kg/kg) β × 103 (s–1) D0 × 1012 (m2/s) k1 × 10 (kg/kg) β × 104 (s–1) D0 × 1011 (m2/s)
10 8.605 5.078 7.947 – – –
20 3.927 4.026 25.880 6.990 3.358 2.825
30 5.155 4.602 31.230 6.470 4.342 5.941
40 4.470 5.535 55.410 5.040 5.594 10.820
50 3.617 8.732 76.010 3.680 7.814 21.080
Figure 11. Temperature influence on β. 0
2 4 6 8 10
0 10 20 30 40 50 60
T (°C)
β
× 10
3 (s –1)
CD 202 β = 2.275 × 10⁻³ exp (0.0251 T) (R2 = 0.92) β = 1.894 × 10⁻⁴ exp (0.0279 T) (R2 = 0.99) Amsoy 71
Figure 12. Temperature influence on k1. 0.0
0.2 0.4 0.6 0.8 1.0
0 10 20 30 40 50 60
T (°C)
CD 202 k1 = –0.0125 T + 0.954 (R2 = 0.96) k1 = –0.0114 T + 0.952 (R2 = 0.97) Amsoy 71
X (kg
H2O
/kg
DS
CD 202 diffusivities remains virtually constant, with the value of 2.78 at the beginning of soaking and 2.80 at the end.
Assuming the estimation of k1 and D0 parameters presented by Hsu (1983b) was adequate, one can focus on the physical meaning of the diffusion coefficient (D) to propose an explanation for the differences between the diffusivities estimated from Hsu parameters and those obtained in the present work.
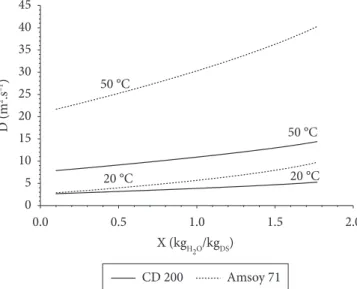
The diffusion coefficient of water in the grain is a complex physical property as it depends on the grain structure, which is directly related to soybean cultivar, and on the behavior of that structure during hydration. Revisiting Figure 14, one can notice that diffusivity increases with increasing soybean moisture content, regardless of the soybean cultivar or soaking temperature. As the diffusivity is a transport property, defined analogously to Fick’s law, it is evident that its inverse is proportional to the resistance to mass transfer inside the grain during hydration.
Therefore, the higher the diffusivity, the smaller the mass transfer resistance imposed by the grain structure to water penetration. Thus, it seems clear that both temperature and grain moisture content affect soybean structural characteristics during hydration, though differently, depending on the cultivar used. The structural characteristics of the soybean used by Hsu (Amsoy 71), reflected on diffusivity, were influenced by grain moisture content much more strongly than those of the soybean used in this work (CD 202), suggesting that, in the latter case, the grain structure is less permeable to water.
3.6 Fitting of mathematical model
Figure 15 shows the model simulation results, along with the experimental values for the temperatures of 10, 30, and 50 °C, and Figure 16 shows the deviations of model predictions from soybean moisture content measurements for all tests (10, 20, 30, 40 and 50 °C). It is interesting to observe in Figure 15 that the tendency of linear decrease with increasing temperature, with
a discrete growth of the difference between the values obtained in both studies.
As well as those presented by Hsu (1983b), the pre-exponential coefficients (D0) obtained in the present work (Figure 13) show a tendency of exponential increase with increasing temperature, though less pronounced. At 10 oC D
0
values estimated by the exponential regressions are almost the same, but the difference between them grows rapidly as the temperature is raised, reaching its maximum at 50 oC, whereas
the value obtained by Hsu for D0 is almost three times higher than that obtained in the present work.
3.5 Analysis of diffusivity behavior during soaking
Knowing the water diffusivity behavior inside soybean grain (D) is particularly important for the design, optimization, simulation and analysis of any process involving hydration of this legume and, therefore, deserves credit. For that purpose, diffusion coefficient values were estimated in the temperature range from 20 to 50 °C by means of Equation 2, using k1 and D0 values presented in Table 1.
Regardless of the temperature, the diffusivities predicted from k1 and D0 parameters and presented by Hsu for Amsoy 71 soybean (Table 1), as well as those obtained by the current parameters for CD202 soybean, tend to increase with increasing soybean moisture content, as seen in Figure 14. The differences between the diffusivities of Amsoy 71 and CD202 cultivars are negligible at the beginning of soaking at 20 °C (X = 0.103 kgH2O/kgDS), but they increase gradually during hydration, until their maximum value is reached at hydration completion (X = 1.741 kgH2O/kgDS), when D value estimated from Hsu parameters for Amsoy 71 cultivar is 1.86 times greater than that obtained in this work for CD 202 cultivar. This proportion increases as the temperature is raised, reaching its maximum at 50 °C. At this temperature the ratio between Amsoy 71 and
Figure 13. Temperature influence on D0. 0
5 10 15 20 25
0 10 20 30 40 50 60
T (°C)
CD 202 D0 = 0.699 exp (0.0500 T) (R2 = 0.96) D0 = 0.773 exp (0.0663 T) (R2 = 0.97) Amsoy 71
D0
(m
2.s –1)
Figure 14. Diffusion coefficient behavior during hydration. 0
45 40 35 30 25 20 15 10 5
0.0 0.5 1.0 1.5 2.0
D (m
2.s –1)
20 °C 20 °C
50 °C 50 °C
CD 200 Amsoy 71
equilibrium moisture content (1.758 kgH2O/kgDS) is temperature independent. However, increasing the temperature substantially increases hydration velocity. By the conjoint analysis of Figures 15 and 16, one can also observe that the Hsu model adequately represented the CD 202 soybean soaking process with ±10% deviation from the experimental measurements.
3.7 Analysis of grain moisture profiles during soaking
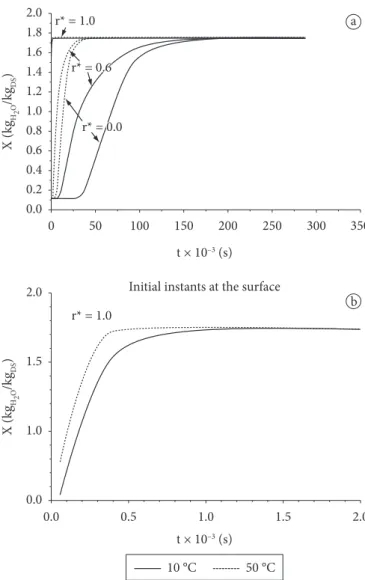
Temperature exerts a major influence on hydration velocity, as shown in Figures 17 and 18. Initially, CD 202 soybean grain presents a uniform moisture content along the radius (0.103 kgH2O/kgDS) and as soon as it is put in contact with water at 10 or 50 °C the soaking process begins, developing different radial profiles until final equilibrium conditions are reached, where moisture remains uniform along the grain radius. The grain surface (r* = 1) reaches equilibrium first, whereas the center (r* = 0) reaches it last, although at different instants of time, depending on soaking temperature, as shown in Figure 18.
Figure 15. Model predictions and experimental data. 0.0
0.2 0.4 0.6 0.8 1.0 1.2 1.4 1.6 1.8 2.0
t × 10–3 (s)
X (kg
H2O
/kg
DS
)
CD 202
0 50 100 150 200 250 300 350
10 °C 80 °C 50 °C
Experimental Model
Figure 16. Deviation of model predictions for all temperatures. 0.0
0.2 0.4 0.6 0.8 1.0 1.2 1.4 1.6 1.8 2.0
Xca
lc.
(kg
H2O
/kg
DS
)
Xexp. (kgH2O/kgDS)
0.0 0.2 0.4 0.6 0.8 1.0 1.2 1.4 1.6 1.8 2.0 +10%
–10% CD 202
Figure 18. Influence of temperature and time on moisture content profiles in three radial positions.
0 50 100 150 200 250 300 350
t × 10–3 (s)
X (kg
H2O
/kg
DS
)
10 °C 50 °C
0.0 0.2 0.4 0.6 0.8 1.0 1.2 1.4 1.6 1.8 2.0
r* = 1.0
r* = 1.0 r* = 0.6
r* = 0.0
a
t × 10–3 (s)
X (kg
H2O
/kg
DS
)
0.0 2.0
1.5
1.0
b
0.0 0.5 1.0 1.5 2.0
Initial instants at the surface
Figure 17. Influence of temperature and time on radial moisture content profiles.
0.0 0.2 0.4 0.6 0.8 1.0 1.2 1.4 1.6 1.8 2.0
X
(kg
H2O
/kg
DS
)
r*
0.0 0.1 0.2 0.3 0.4 0.5 0.6 0.7 0.8 0.9 1.0
10 °C 50 °C
160200 s
18000 s
3600 s
adopted in this work (N = 50) was attributed mainly to the initial moisture content, which was much higher in the soybean used by Hsu (0.55 kgH2O/kgDS) than in the soybean used in this work (0.103 kgH2O/kgDS). This higher value led to smaller radial moisture gradients that may be numerically represented with a smaller value of N;
• The parametric sensitivity study revealed that parameter
β does not exert significant influence on the Hsu model predictions, contrary to k1 and D0;
• k1 parameter decreases when temperature is raised,
whereas β and D0 parameters increase;
• Soybean cultivar exerts less influence on k1 variation as a
function of temperature than on D0 variation;
• The necessary time for the CD 202 soybean grain to reach
equilibrium (teq) is influenced by temperature, but the equilibrium moisture content (Xeq = 1.758 kgH2O/kgDS) does not depend on temperature, in the explored range of experimental conditions;
• At 10 °C the surface of CD 202 soybean grain reaches
99% of Xeq in 1.7 × 10³ seconds, while it takes 270 × 103
seconds for the center to reach the same value. At 50 °C, both surface and center reach 99% of Xeq in much shorter times: 0.7 × 10³ and 45 × 103 seconds, respectively, showing
that the five-fold increase in temperature induced a 58.8% decrease in the necessary time for the surface to reach 99% of Xeq and an 83.3% time decrease for the grain center to reach the same value;
• The mass transfer limiting step during hydration is the
diffusion inside the soybean grain. This phenomenon becomes less apparent as temperature increases, leading to a decrease in radial moisture gradients inside CD 202 soybean grain;
• Regardless of the soybean cultivar, the water diffusion
coefficient inside the grain (D) increases with increasing temperature or moisture content. However, at a high temperature (50 °C) the diffusivity increasing behavior during hydration is much more pronounced than at a low temperature (20 °C);
• The differences between the diffusivities of Amsoy 71
and CD202 cultivars are negligible at the beginning of soaking at 20 °C, but they increase gradually as hydration continues, until their maximum value is reached at hydration completion, when D value for Amsoy 71 cultivar is 1.86 times greater than that obtained in this work for CD 202 cultivar. This proportion increases as temperature is raised, reaching its maximum at 50 °C. At this temperature the ratio between Amsoy 71 and CD 202 diffusivities remains virtually constant, with the value of 2.78 at the beginning of soaking and 2.80 at the end; and
• Structural characteristics of Amsoy 71 soybean were
influenced by temperature and grain moisture content during hydration much more strongly than those of CD 202 soybean, suggesting that, in the latter case, the grain structure is less permeable to water.
At 10 oC the grain surface reaches 99% of the equilibrium
concentration (Xeq = 1.758 kgH2O/kgDS) in 1.7 × 10³ seconds,
whereas the center (r* = 0) will reach this value only after 270 × 103 seconds. Comparing these results with the hydration
profiles at 50 °C, one can observe that both the grain center (Figure 18a) and the surface (Figure 18b) reach equilibrium conditions in much shorter times at 50 °C: 45 × 103 seconds and
0.7 × 10³ seconds respectively, showing that the five-fold increase
in temperature, from 10 to 50 °C, induced a 58.8% decrease in the necessary time for the surface to reach equilibrium and an 83.3% decrease for the center.
One can also observe in Figure 18 that on the one hand, the higher the temperature, the stronger the moisture variations over time, regardless of radial position. On the other hand, a decrease in temperature increases radial moisture gradients, independently of time, as can be seen analyzing Figures 17 and 18. Therefore, the lower the temperature, the larger the necessary number of radial discretization points to represent the radial derivative of the mathematical model.
Except for the initial and final instants of the soaking process, in which moisture profiles are uniform along the grain radius (Xo and Xeq, respectively), significant radial moisture variations are observed over time in Figure 17, regardless of temperature, indicating water diffusion inside soybean grain as the mass transfer limiting step.
4 Conclusions
• The value obtained in the present work for the CD 202
soybean equilibrium moisture content (1.758 kgH2O/kgDS) is 21% higher than that found by Hsu (1983a) for the Amsoy 71 cultivar at the temperature of 30 °C;
• The addition of a small amount of sodium benzoate to the
water (0.1%) did not significantly influence the soybean soaking process;
• The Hsu model adequately represents the CD 202 soybean
soaking process, simulating water distribution inside the grain during hydration, with ±10% deviation from experimental values of average grain moisture content;
• The discretization of radial derivatives by finite differences
followed by integration of the resulting system of ordinary differential equations was adequate for the numerical solution of the Hsu model;
• The grain initial moisture content (Xo) has great influence
on the radial moisture gradients inside the grain and on the number of internal radial discretization points (N);
• Besides Xo, temperature also exerts some influence on the
radial moisture gradients and on the value of N;
• The number of internal radial discretization points (N)
necessary for the numerical solution of the Hsu model increases when the soybean initial moisture content or the soaking temperature decreases;
• The difference between the number of internal
HSU, K. H. A diffusion model with a concentration-dependent diffusion coefficient for describing water movement in legumes during soaking. Journal of Food Science, v. 48, n. 2, p. 618-622 and 645, 1983a.
HSU, K. H. Effect of temperature on water diffusion in soybean. Journal of Food Science, v. 48, n. 4, p. 1364-1365, 1983b.
INSTITUTO ADOLFO LUTZ - IAL. Normas analíticas do Instituto Adolfo Lutz. 3 ed. São Paulo, 1985. (v. 1)
KLAMCZYNSKA, B.; CZUCHAJOWSKA, Z.; BAIK, B. Composition, soaking, cooking properties and thermal characteristics of starch of chickpeas, wrinkled peas and smooth peas. International Journal of Food Science and Technology, v. 36, n. 5, p. 563-572, 2001. LO, W. Y. L. et al. Soaking soybeans before extraction as it affects
chemical composition and yield of soymilk. Food Technology, v. 22, n. 9, p. 1188-1190, 1968.
LONG, F. A.; RICHMAN, D. Concentration gradients for diffusion of vapor in glassy polymers and their relation to time dependent diffusion phenomena. Journal of the American Chemical Society, v. 82, n. 3, p. 513-519, 1960.
NELSON, A. I.; STEINBERG, M. P.; WEI, L. S. Illinois process for preparation of soymilk. Journal of Food Science, v. 41, n. 1, p. 57-61, 1976.
PAN, Z.; TANGRATANAVALEE, W. Characteristics of soybeans as affected by soaking conditions. Lebensmittel-Wissenschaft und-Technologie, v. 36, n. 1, p. 143-151, 2003.
PELEG, M. An empirical model for the description of moisture sorption curves. Journal of Food Science, v. 53, n. 4, p. 1216-1219, 1988. SINGH, B. P. N.; KULSHRESTHA, S. P. Kinetics of water sorption by
soybean and pigeonpea grains. Journal of Food Science, v. 52, n. 6, p. 1538-1544, 1987.
SOPADE, P. A.; OBEKPA, J. A. Modelling water absorption in soybean, cowpea and peanuts at three temperatures using Peleg’s equation.
Journal of Food Science, v. 55, n. 4, p. 1084-1087, 1990.
WANG, H. L. et al. Hydration of whole soybeans affects solids losses and cooking quality. Journal of Food Science, v. 44, n. 5, p. 1510-1513, 1979.
References
ADEYEMI, I. A. Dry-milling of sorghum for ogi manufacture. Journal of Cereal Science, v. 1, n. 3, p. 221-227, 1983.
AHROMRIT, A.; LEDWARD, D. A.; NIRANJAN, K. High pressure induced water uptake characteristics of Thai glutinous rice. Journal of Food Engineering, v. 72, n. 3, p. 225-233, 2006.
BARROZO, M. A. S.; CALADO, V. M. A.; CALÇADA, L. A. Secagem de soja em leito deslizante e recirculação pneumática: influência da umidificação artificial. In: ENCONTRO SOBRE ESCOAMENTO EM MEIOS POROSOS, 1991, Campinas. Anais... São Paulo: UNICAMP, 1991. p. 327-337. (v. 1)
BECKERT, O. P.; MIGUEL, M. H.; MARCOS FILHO, J. Absorção de água e potencial fisiológico em sementes de soja de diferentes tamanhos. Scientia Agrícola, v. 57, n. 4, p. 671-675, 2000. CALADO, V. M. A. Modelagem e simulação de secadores em leitos
fixo e Deslizante. 1993. Tese (Doutorado em Engenharia Química) - Universidade Federal doRio de Janeiro – UFRJ, Rio de Janeiro. CHOPRA, R.; PRASAD, D. N. Standardization of soaking conditions
for soybean seeds/cotyledons for improved quality of soymilk.
Indian Journal of Animal Sciences, v. 64, n. 4, p. 405-410, 1994. CIABOTTI, S. et al. Características sensoriais e físicas de extratos
e tofus de soja comum processada termicamente e livre de lipoxigenase. Ciência e Tecnologia de Alimentos, v. 27, n. 3, p. 643-648, 2007.
COUTINHO, M. R. et al. Modelagem e validação da hidratação de grãos de soja. Ciência e Tecnologia de Alimentos, v. 25, n. 3, p. 603-610, 2005.
COUTINHO, M. R. et al. Novo modelo de parâmetros concentrados aplicado à hidratação de grãos. Ciência e Tecnologia de Alimentos, v. 27, n. 3, p. 451-455, 2007.
CRANK, J. The mathematics of diffusion. 2 ed. London: Oxford University Press, 1975.