ORIGINAL
Resumo
Abstract
Há pouca consistência na literatura sobre o efeito sazonal nos níveis de atividade física (NAF) na população. Realizou-se um estudo longitudinal para avaliar o efeito da sazonali-dade nos NAFs em 120 adultos de uma região temperada do Sul do Brasil. A ativisazonali-dade física (AF) foi avaliada em dois períodos (verão e inverno) de 2007, com base na seção de AF no tempo de lazer e como forma de deslocamento do International Physical Activity
Question-naire (IPAQ). As medianas dos NAFs foram comparadas entre as duas estações usando Sign
Test. Para comparar a proporção de ativos e inativos no verão e no inverno utilizou-se o McNemar Test. A mediana do NAF Total no tempo de lazer foi maior no verão do que no in-verno (383,75 vs. 210 MET-min/sem) (p=0,02). A porcentagem de pessoas inativas no verão e no inverno foi, respectivamente, 37,5% e 49,2% (p=0,04). As pessoas com 9 a 11 anos de escolaridade e pertencentes à classe B foram as que sofreram maiores reduções nos NAFs do verão para o inverno. Nossos resultados apontam para a necessidade de planejamento e estratégias para promover AF regular, especialmente no inverno.
Palavras-chave: Atividade física, Efeito sazonal, IPAQ.
There are no consistent findings about the seasonal effects on the physical activity levels (PAL) of the population. We conducted a study aimed at evaluating seasonal effects on physical activity levels among adults living in a temperate region of Brazil. A longitudinal study was carried out in a sample of 120 adults living in Southern Brazil. Physical activity was evaluated using the leisure-time and transport-related physical activity sections of the International Physical Activity Questionnaire (IPAQ) in two periods (summer and winter) of the year 2007. Median values of PAL (MET-min/week) were compared between the two seasons using Sign Test. McNemar Test was used for physical activity as dichotomous. Total Leisure-Time median values were higher in summer compared to winter (383.75 vs. 210 MET-min/wk, respectively; p=0.02). Overall, 37.5% of the subjects were classified as inactive during Summer compared to 49.2% during Winter (p=0.04). Subjects with 9 to 11 years of education, belonging to socioeconomic status B were more likely to decrease PAL in Winter compared to Summer. There must be planning and strategies to promote regular PA, particularly in winter.
Keywords: Physical activity, Seasonal effects, IPAQ.
Seasonal effects on physical activity levels in
adults living in Southern Brazil
Ana Weigert Bressan1
Maria Teresa Anselmo Olinto1
Ruth Liane Henn1
Marlos Rodrigues Domingues2
Sinara Laurini Rossato1
Luiz Antonio dos Anjos3
1 Programa de Pós-graduação em Saúde
Coletiva. Universidade do Vale do Rio dos Sinos - Unisinos, RS
2Universidade Federal de Pelotas, RS 3Laboratório de Avaliação Nutricional e
Funcional (LANUFF)/Departamento de Nutrição Social. Universidade Federal Fluminense - UFF, RJ
Endereço para Correspondência Maria Teresa Anselmo Olinto Av. Unisinos 950
93022-000 São Leopoldo/RS, Brasil e-mail: [email protected] Fone: (51) 35908752 • Recebido: 21/5/2010 • Re-submissão: 17/07/2010 06/08/2010 • Aceito: 11/8/2010
INTRODUCTION
Factors such as physical inactivity, cigarette smoking, unhealthy diet, alcohol, sun exposure and stress contribute to an unhealthy lifestyle1. Physical inactivity increases all-cause
mortality rate, doubles the risk of cardiovascular disease, type II diabetes, and obesity. It also increases the risk of colon and breast cancer, high blood pressure, lipid disorders, osteopo-rosis, depression and anxiety. Approximately 2 million deaths every year are attributable to physical inactivity2. On the other
hand, moderate-to-vigorous activities may contribute to lon-gevity by increasing lifespan in up to 1.5 years3.
There is some evidence of a seasonal influence over phy-sical activity patterns4,5. There has been an increasing interest
to study how seasons can influence physical activity levels in the population. In an American study, the prevalence of phy-sically active adults was 48.4% during summer and 44.6% in winter4. A study in Michigan, USA, with data obtained from
the 1996 Michigan Behavioral Risk Factor Survey (n=2,843), concluded that people were 15 to 20% more active during time in summer and spring. Average weekly leisure--time energy expenditure was significantly greater (p < 0.001) during summer (17.5 +/- 0.7 kcal.kg-1.wk-1) compared to winter
(14.8 +/- 0.7 kcal.kg-1.wk-1)6.
A longitudinal study in Massachusetts, USA, with 593 par-ticipants aged between 20 and 70 years found that total physical activity in MET-hours/day was higher in summer than in winter (30.5 vs. 29.9, respectively, p = 0.03)7. In another cohort study,
also conducted in Massachusetts (Seasonal Variation of Blood Cholesterol Study, 1994–1998), with healthy adults (n=580), the total physical activity increased by 1.4 MET-hours/day in men and 1.0 MET-hours/day in women during the summer in com-parison to winter8. In the Framingham Offspring Study
(1979-1983) with 1,598 men and 1,762 women aged 20 to 69, both sexes expended more energy in physical activities in summer than in winter9.
Data from a representative sample of Canadians free--living (n=20,197) showed that 64% of adults were inactive in their leisure-time during the winter compared to 49% during the summer.Total average daily energy expenditure was 31% higher in summer than winter10. In Scotland, data for 7,202
male and 9,284 female showed that during the summer peak phase, in July, 32% of the respondents reported exercising for at least 20 min three or more times during the previous week, in the winter period this decreased to 23%11.
In two multiethnic suburbs of Oslo, Norway, physical ac-tivity data for 2,274 men and women aged 31-67 years were obtained using the IPAQ. The authors found that energy ex-penditure increased by 18% from winter to summer12. A study
with twenty-five healthy Dutch young adults showed that PAL = TEE/SMR (Physical Activity Level = total energy expenditure/ sleeping metabolic rate) was higher in summer than in winter (1.87-0.22 vs. 1.76-0.18, p = 0.001)5.
In Brazil, widespread high levels of physical inactivity are observed. In the Southeast and Northeast regions no more than 20% of subjects are actives, considering physical acti-vity in leisure-time13. In the Amazon, hot and humid area in
Northern region, the prevalence of subjects is 37.8%, and in Southern Brazil, temperate-weather area with extreme tem-perature differences comparing summer to winter time, it is 30.4%14.
Based on the studies reviewed, there appears to be a ne-gative effect of some seasons in the physical activity levels. Despite the existence of four clearly defined seasons during the year in the Southern Brazil, there is no information on the
influence of climate on physical activity behaviors. Thus, this study was conducted to evaluate the seasonal effects on phy-sical activity levels among adults living in Porto Alegre and metropolitan region, located in Southern Brazil.
METHODS
The study design was longitudinal with a volunteer’s sample of 120 adults, men and women, aged 20 to 69 living in Porto Alegre and metropolitan region, Southern Brazil. This area is characterized as temperate-climate with two distinct seasons and extreme temperature differences between sum-mer and winter time; maximum and minimum reported tem-perature during last five years were 39.2ºC and 0.4ºC15,
respec-tively. The mean temperature was 26.3ºC on January-March, 15.8ºC on July-September and 17.9ºC on October15. Autumn
and spring present mild and similar temperatures and were not considered in the present study.
This investigation is part of a larger project aimed at constructing and validating a food frequency questionnaire (FFQ). The sample size was estimated for the original valida-tion study, considering seasonal effects. Subjects were recrui-ted by announcements in local newspapers of wide coverage in the cities where data were collected (Porto Alegre and São Leopoldo), and booklet distributions. The potential partici-pants phoned to sites for data collection and answered some questions to verify if met the eligibility criteria. Inclusion crite-ria were age between 20 and 69 years and live in the metro-politan region of Porto Alegre. Those reporting any cardiovas-cular disease, diabetes mellitus, hypertension, obesity or any pathology that could influence eating habits or limited their physical activity were not included in the study. In addition, subjects on restrictive diets or pregnant women were not in-cluded. Data collection was conducted in two periods of the year: during summer (January to March, 2007) and winter (July to October, 2007). Two visits in each period were carried out, summing up four interviews for each participant. On the first visit, participants answered the physical activity questionnaire and anthropometric measurements were performed. During the second visit, subjects completed the socioeconomic and demographic questionnaire. The baseline wave enrolled 164 subjects, and this analysis included 120 subjects that comple-ted all interviews. These losses were caused by the refusal to participate in the FFQ follow-up.
Physical activity was evaluated using the leisure-time and transport-related physical activity sections of the long version16, previous seven-day recall, Portuguese version of
the International Physical Activity Questionnaire (IPAQ). The instrument was previously validated in Brazil and correlation coefficients ranged from 0.24 to 0.49, depending on the gold standard used17. The IPAQ considers activities performed for
at least 10 consecutive minutes, and the intensity is based on self-report; activities that moderately alter breathing and require some physical effort are defined as moderate, where-as those producing strong increwhere-ases in these parameters are classified as vigorous.
The continuous variable, labeled as PAL (Physical Activity Level), were measured in MET-minutes per week (MET-min/ wk). PAL were calculated for four types of activities: 1) Total--PAL during Transport; 2) TotalTotal--PAL during Walking; 3) Total Leisure-Time PAL; 4) Total PAL - (Table 1). PAL scores were ca-tegorized based on the Guidelines for Data Processing and Analysis of the IPAQ18. According to this procedure, Moderate
physical activity (PA) and Walking are different with respect to MET values, i.e. Moderate PA equals 4.0 METs while walking
equals 3.3 METs. Previous studies19,20 have considered walking
as a moderate physical activity, hence, a mean value of 3.5 METs was used for both activities.
Physical activity as a dichotomous variable classified the subjects into two categories: active and inactive. Active sub-jects were those performing ≥ 150 Min/wk of moderate-inten-sity PA; ≥ 60 Min/wk of vigorous-intenmoderate-inten-sity PA; or a combina-tion of walking and moderate or vigorous physical activities attaining ≥ 150 Min/wk, according to the Guidelines for Data Processing and Analysis of the IPAQ18. Inactive subjects were
those performing activities below the levels described above. Socioeconomic and demographic characteristics were obtained by standardized questionnaires. Socioeconomic and demographic explanatory variables were categorized using conventional cutoff points and/or based on the distribution of responses, as follows: gender (female / male); age (20-40 / 41-69 years); education (0-8 / 9-11 / ≥ 12 years of schooling); and social status from low to high class (E+D, C, B, A) according to the Criteria of the Brazilian Economic Classification21.
Weight and height were measured with a Fantasy Sunri-se scale (100-gr accuracy), and a SECA Bodymeter 208 stadio-meter (1-mm accuracy), respectively. Body mass index (BMI) in kg/m2 was calculated and used to assess the nutritional status
of the subjects as normal (BMI between 18.5 and 24.9 kg/m2)
and overweight (BMI between 25.0 and 29.9 kg/m2).
Supervisors and interviewers were trained according to all standard procedures of the instruments. Quality control was carried out by periodic training sessions, fieldwork su-pervision and weekly meetings with the interviewers. A pilot study was carried out from August to November 2006, among the target population of the study.
Data were double entered on Epi Info 6.0 software and statistical analyses were carried out in SPSS 13.0. Data were checked for normality using best-fitting normal curves over
histograms. Due to data asymmetry, Sign test was used to compare PAL (MET-min/wk) median values in winter and sum-mer, and for each stratum of gender, age, education, social status, and BMI. McNemar nonparametric test was used for comparison between PA, as a dichotomous variable, in sum-mer and winter. Significance level was set to 5% (p < 0.05).
The study was approved by the Institutional Review Bo-ard of the University of Vale do Rio dos Sinos. Written infor-med consent was obtained from all participants prior to par-ticipation.
RESULTS
A total of 120 subjects were interviewed, 71% were wo-men. Most people (59%) were in the 20-40 year age group and mean age (±SD) of the sample was 38 years (±12.7), 61% had more than 12 years of education (13±3.8 years) and belonged to A and B classes (83%). Almost 29% of the participants were overweight. The normal weight/overweight ratio was 2.5.
The comparison between PAL in summer and winter is shown in Figure 1. A winter reduction tendency is observed for the four types of activities: Total PAL during transport, Total PAL during walking, Total leisure-time PAL and Total PAL. Ho-wever, a statistically significant association was observed only for leisure-time PAL (383.75 MET-min/wk in summer vs. 210 MET-min/wk in winter).
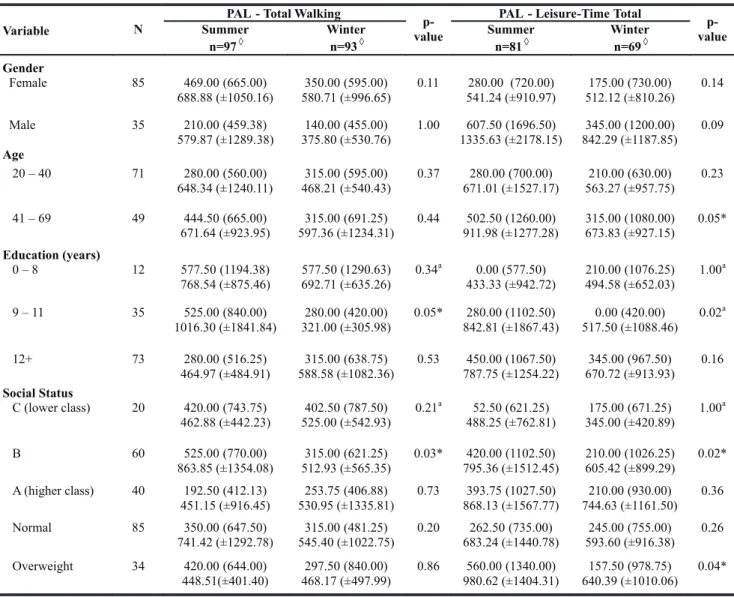
Tables 2 and 3 present the PAL distribution according to the sample characteristics. Total PAL during transport me-dian values for the comparisons within each stratum were not statistically significant, they are not presented. Social econo-mic status (SES) and education differences were observed. Subjects with 9 to 11 years of education were more likely to decrease PAL in winter compared to summer for the three types of PAL; and those belonging to B SES were more active
Table 1 Formula to estimate Physical Activity Levels in MET-min/wk.*
Table 2 Median (inter-quartile range) and mean (± standard deviation) of Total Walking, and Total Leisure-Time Physical Activity Level (PAL) in MET-min/wk, according to socioeconomic, and demographic variables, and body mass index (BMI) in 120 subjects from Southern Brazil, 2007.
in summer compared to winter in Total PAL during walking and Total leisure-time PAL. Men, older and overweight sub-jects were always less active during winter on all three types of PAL. Highest MET reduction values from summer to winter were observed among men and older subjects (41 to 69 years) for Total PAL and among overweight subjects for Total leisure--time PAL (371.5, 480 and 402.5 MET-min/wk, respectively). In general, lower PAL median values were observed in Total lei-sure-time PAL during winter. However, the lowest values were observed among subjects from lower education and SES, i.e., it was zero and 52.5 MET-min/wk during the summer for Total leisure-time PAL.
When PA was considered as a dichotomous variable, 37.5% of the subjects were classified as inactive during sum-mer compared to 49.2% during winter (p = 0.04) (data are not shown).
DISCUSSION
We conducted an exploratory study to investigate the seasonal effect on PAL among healthy adults. The results
re-vealed higher median PA estimates in summer than in winter, specially, among older subjects, subjects in mid-class cate-gories of education and SES, and overweight subjects. These findings are consistent with The Seasonal Variation of Blood Cholesterol Study8,22. The results of that study also showed
that Total PA was higher, on average, in summer compared to winter8. Other studies also found more Total PA in summer
than in winter 7,12,5. In the Framingham Offspring Study both
sexes expended more energy in physical activities in summer than in winter9. In Canada, total average daily energy
expen-diture was 31% higher in summer in comparison to winter10.
In the present study the prevalence of physically active in-dividuals was 62.5% in summer and 50.8% in winter (p = 0.04). The Behavioral Risk Factor Surveillance System showed that the percentage of adult participants meeting the recommen-dations for physical activity varied significantly across seasons (48.4% in summer and 44.6% in winter; p = 0,0001)4.
Although the results had no statistical significance, our findings showed that the difference between summer and winter in Total PAL was higher for men than women (371.5
vs. 154 MET-min/wk). Matthews et al. (2001)8 and Plasqui &
Westerterp (2004)5 found difference higher for men than for
women in PAL Total.
Among the studies that have investigated the relation between PA and climate conditions, most have shown diffe-rences in leisure-time PA6,9,10. It is reasonable to assume that
occupational activities take place regardless of weather and are performed constantly throughout the year, in contrast to leisure activities, that may be encouraged by nice weather conditions. Substantial seasonal variation has been detected for the most common activities: gardening, carpentry, lawn mowing, golf, and running in American men; and gardening, swimming, health club exercise, dancing, and bicycling in American women in the Framingham Offspring Study9.
In our study the subjects reported performing more To-tal leisure-time PAL in summer (383.75 MET-min/wk) than in
winter (210 MET-min/wk). In Canada the inactivity prevalen-ce in the leisure-time was 64% in winter compared to 49% in the summer and leisure-time physical activity was 86% more likely in the summer than winter10. In Scotland, researchers
showed that during the summer peak phase, in July, 32% of the respondents reported exercising for at least 20 min three or more times during the previous week, in the winter period this decreased to 23%11. Pivarnik et al. (2003)6 observed that
leisure-time PA was significantly affected by the season: 17% versus 33% subjects presented no leisure-time PA in summer and winter, respectively. This study concluded that people are 15 to 20% more active during leisure-time in summer and spring. Average weekly leisure-time energy expenditure was significantly greater during summer compared with winter.
There is some evidence that environmental factors in-fluence physical activity. However, seasonal variation is not a
Table 3 Median (inter-quartile range) and mean (± standard deviation) of Total Physical Activity Level (PAL) in MET-min/wk, according to socioeconomic, and demographic variables, and body mass index (BMI) in 120 subjects from Southern Brazil, 2007.
fixed attribute of the environmental, but a number of featu-res - daylight hours, temperature, humidity, precipitation, and wind – that may influence physical activity23. In United States
a study with 2,912 women established that 10.4% of sample perceived bad weather as barrier to physical activity24.
Physi-cal activity is more likely if the weather is dry and moderate4.
It was observed that the seasonal effects on PAL also de-pend on the sample characteristics. After a literature review, no study was identified considering the epidemiologic profile of the sample. Such lack of information impairs the evaluation of consistency of the present data. The findings showed that subjects from the lowest education level presented the lowest median of Total leisure-time PAL (0 MET-min/wk) in summer. In addition, they showed high median Total PAL (840 MET-min/ wk) during the same season. In the study of Graff-Iversen et al. (2007)12 men of lower educated levels presented higher
to-tal energy expenditure than those with higher education and this difference was due to a higher volume of Total moderate PAL influenced by commuting (transport) activities.
The present study excluded hypertensive, diabetic, obe-se and people preobe-senting any pathology that could influence their physical activities. This strategy reduced the chance of confounding. The Seasonal Variation of Blood Cholesterol Stu-dy8 used a similar approach but in contrast to the present
stu-dy, obese subjects were included, corresponding to nearly 1/3 of the sample. Plasqui & Westerterp (2004)5 studied healthy
volunteers aged 20 to 30 years, but selection criteria were not fully explained in the methods section of the study.
There are two potential limitations of the present sam-ple. First, although there was follow-up loss, it happened evenly among gender, age, education, social status and BMI categories. Indeed, the small sample size did not allow multi-variate analysis and control for confounding factors. We could only experiment restrictions (e.g. excluding morbidities) and stratification of sample as a control for those factors.
The other limitation is the use of a convenience sample, which does not allow generalizations. The present sample included mainly subjects from a middle-to-high social status (i.e. people from the very low classes – D and E were not pre-sent in the sample). Therefore, it is not clear whether the sea-sonal-related PA change observed in the present study would occur among lower educated and poorer people. However, there was consistency in seasonal effect on PA between the findings and other studies with wealthier and more educated samples22,12.
Although this study can be characterized as an explora-tory investigation, it was possible to identify a specific profile of “summer-only participants”. Even though the results were not significant, they are pointing out to a delicate situation, since people more in need for regular PA and at higher risk for cardiovascular disease (older than 40, overweight, men)25,26
are the ones presenting elevated decreases from summer to winter. Remarkably, overweight subjects reduced their Total leisure-time PAL in 402.5 MET-min/wk during winter. Contro-versially, this specific group, more in need for regular PA, is giving up exercise from summer to winter more than others.
In conclusion, a tendency to higher levels of PA during summer was observed in the present sample of adults living in Southern Brazil. There must be planning and public strate-gies to promote regular PA, regardless of weather conditions, particularly in winter.
Acknowledgements
Financial support for this study was provided by CAPES
(Brazilian Federal Agency for Support and Evaluation of Gra-duate Education) processes PROCAD 01/2005, nº 0257052 and PROSUP n.097/2007. The authors are partially supported by Brazilian National Council for Science and Technological Development (CNPq) scholarship processes 308833/2006-6 (MTAO) and 311801/2006-4 (LAA).
Authors’ contributions
All authors contributed to this manuscript. MTAO and LAA designed, obtained funds, and supervised data collec-tion throughout the study. RLH, AWB e SLR collected the data. AWB, MTAO and MRD conducted the statistical analysis and drafted the manuscript which was reviewed and approved by all authors.
REFERENCES
1. Paffenbarger JrRS, Wing AL, Hyde RT, Jung DL. Physicalactivity and incidence
of hypertension in college alumni. AmJ Epidemiol 1983; 117:245-57.
2.
http://www.who.int/world-health-day/previous/2002/files/whd02_factshe-et4_en.pdf/. Accessibility verified May, 2007
3. Lee I, Paffenbarger JrRS. Associations of light, moderate, and vigorous
intensi-ty physical activiintensi-ty with longeviintensi-ty. Am J Epidemiol 2000; 152(3):293-9.
4. Merrill RM, Shields EC, White GL, Druce D. Climate conditions and physical
activity in the United States. Am J Health Behav 2005 Jul-Aug; 29(4):371-81.
5. Plasqui G, Westerterp KR. Seasonal variation in total energy expenditure and
physical activity in Dutch young adults. Obes Res 2004 Apr; 12(4):688-94.
6. Pivarnik JM, Reeves MJ, Rafferty AP. Seasonal variation in adult leisure-time
physical activity. Med Sci Sports Exerc 2003 Jun; 35(6):1004-8.
7. Ma Y, Olendzki BC, Li W et al. Seasonal variation in food intake, physical
acti-vity, and body weight in a predominantly overweight population. Eur J Clin Nutr 2006; 60(4):519-28.
8. Matthews CE, Freedson OS, Hebert JR et al. Seasonal variation in household,
occupational, and leisure time physical activity: Longitudinal Analyses from the Seasonal Variation of Blood Cholesterol Study. Am J Epidemiol 2001a; 153(2):172:83.
9. Dannenberg AL, Keller JB, Wilson PW, Castelli WP. Leisure time physical activity
in the Framingham Offspring Study. Description, seasonal variation, and risk factor correlates. Am J Epidemiol 1989 Jan; 129(1):76-88.
10. Merchant AT, Dehghan M, Akhtar-Danesh N. Seasonal variation in Leisure time physical activity among canadians. Can J Public Health 2007 May-Jun; 98(3):203-8.
11. Uitenbroek DG. Seasonal variation in leisure time physical activity. Med. Sci. Sports Exerc 1993; 25(6):755-60.
12. Graff-Iversen S, Anderssen SA, Holme IM, Jenum AK, Raastad T. An adapted version of the long International Physical Activity Questionnaire (IPAQ-L): construct validity in a low-income, multiethnic population study from Oslo, Norway. Int J Behav Nutr Phys Act 2007; 4:13.
13. Hallal PC, Anjos LA. Epidemiologia da Atividade Física. In: Gigante D, Kac G & Sichieri R, ed. Epidemiologia Nutricional. 1 ed. São Paulo, Brasil: Atheneu; 2008. 14. http://www.inca.gov.br/. Accessibility verified October, 2007.
15. 8o Distrito de Meteorologia. Porto Alegre, RS.
16. Hallal PC, Gomez LF, Parra DC et al. Lessons learned after 10 years of IPAQ use in Brazil and Colombia. J Phys Act Health 2010; 7(2):259-64.
17. Pardini R, Matsudo S, Araújo T et al. Validação do questionário internacional de nível de atividade física (IPAQ - versão 6): estudo piloto em adultos jovens brasileiros. Rev Bras Cien e Mov 2001; 9(3):45-51.
18. http:// www.ipaq.ki.se/scoring/htm/. Accessibility verified May, 2007 19. Reichert FF, Barros AJD, Domingues MR, Hallal PC. The Role of Perceived
Per-sonal Barriers to Engagement in Leisure-Time Physical Activity. A J Public Health 2007 Mar; 97(3):515-19.
20. Azevedo MR, Araújo CL, Silva MCda, Hallal PC. Tracking of physical activity from adolescence to adulthood: a population-based study. Rev Saude Publica 2007; 41(1):69-75.
21. http://www.anep.org.br/. Accessibility verified February, 2007
22. Matthews CE, Freedson OS, Hebert JR et al. Sources of Variance in Daily Physi-cal Activity Levels in the Seasonal Variation of Blood Cholesterol Study. Am J Epidemiol 2001b; 153(10):987-95.
23. Humpel N, Owen N, Leslie E. Environmental factors associated with adults’ par-ticipation PA: a review. Am J Prev Med 2002; 22(3):188-99.
24. King AC, Castro C, Wilcox S et al. Personal and environmental factors asso-ciated with physical inactivity among different racial-ethnic groups of U.S. middle-aged and older-aged women. Health Psychology 2000; 19(4):354-64.
25. Pilote L, Dasgupta K, Guru V et al. A comprehensive view of sex-specific issues related to cardiovascular disease. CMAJ 2007 Mar; 176(6):1-44.
26. Di Pietro L, Dziura J, Blair SN. Estimated change in physical activity level (PAL) and prediction of 5-year weight change in men: the Aerobics Center Longitu-dinal Study. Int J Obes Relat Metab Disord 2004 Dec; 28(12):1541-7.