Adsorption equilibrium and fixed-bed adsorption of
phenolic acids onto polymeric adsorbent
Sílvia Vanessa dos Santos Barbosa
Dissertation for the Degree
Master in Environmental Engineering
Supervisor: Professor Alírio Rodrigues Co-Supervisor: Dr. Paula Pinto
Developed at:
Laboratory of Separation and Reaction Engineering
INTEGRATED MASTER ENVIRONMENTAL ENGINEERING
2014/2015
Acknowledgments
I would like start to thank my supervisors Professor Alírio Rodrigues and Dr. Paula Pinto for giving all necessary instructions and for having continuously monitored the progress of my work. I am very grateful for all the availability, patience and motivation, especially in times of increased anxiety and workload.
I would like to make a very special thanks to Inês Mota for being such a helpful co-worker. Despite all the setbacks and adversities that happened throughout this work, she never failed in giving me all the necessary help and cooperation. I am also very grateful for all the transmitted knowledge, friendliness, optimism and enthusiasm that allowed me to do this dissertation in a truly enviable working environment.
I also have to make a sincere thanks to all of my laboratory partners (Fatiha, Cátia, Elson and Carina), that dealt directly with me, for always being so helpful in any situation and for the fantastic mood that permitted an excellent working environment.
I want thanking to all my friends (Ana, Francisca, Marta, Inês, Nuno, Filipe, João Vaz e João Martins) for the good moments spent and for always having been a source of happiness and encouragement. Especially for Rita, to be present at all times and always be ready to listen to me and to give a friend advice.
At last, a special thanks to my boyfriend Carlos Sousa, my mother Lúcia Santos, and my best friend Cristiana Reis, for being there in all moments and who supported me all the way through and helped me believe I could finish the project.
I declare, under oath, that this work is original and that all non-original contributions
were properly referenced with their source correctly identified.
Sílvia Vanessa Santos Barbosa
Porto, 29 de Junho de 2015
Abstract
Phenolic acids such as vanillic acid (VA) and syringic acid (SA) result from lignin oxidation with O2 in alkaline medium, a process focused mainly for vanillin (VL) and syringaldehyde (SY) production. Studies of separation and recovery of VA and SA are scarce. However, these two phenolic acids have many applications on pharmaceutical industry and their possible recovery from lignin oxidation mixture needs to be investigated. The main purpose of this thesis was to study the adsorption of VA and SA in a non-polar resin, Sepabeads SP700, aiming their separation from the other products and recovery.
Batch equilibrium adsorption experiments were carried out at three different temperatures (288, 298 and 333 K) for aqueous solutions of VA and SA and experimental results were fitted by Langmuir and Freundlich adsorption equilibrium isotherms.
The maximum adsorption capacity obtained with the Langmuir model was 0.475 g/g to VA and 0.391 g/g to SA. With the Freundlich model, it was obtained a 1/n of 0.383 and 0.396 for VA and SA, respectively. This model predicted better the qe values for VA and SA than
Langmuir model.
The change of energy involved in sorption process were negative for VA and SA (-34.2 and -13.1 kJ/mol, respectively), indicating that the adsorption was exothermic. The phenolic acids had a similar behaviour as the aldehydes studied by some authors.
Fixed-bed experiments of VA and SA adsorption onto the Sepabeads SP700 were also performed, obtaining the respective breakthroughs. For the VA the essays comprised a feed concentration (Cf) of 1.40 g/L at 288 K and at 313 K and, two Cf of 0.67 g/L and 1.22 g/L at
298 K. For SA the essays comprised a Cf of 0.71 g/L at 288 K and at 313 K and, two Cf of 0.16
g/L and 0.67 g/L at 298 K.
The equilibrium data obtained with the fixed bed studies matched the Freundlich model found with batch adsorption study.
Elution studies with ethanol/water (90/10, v/v) were performed and practically all adsorbed solute was recovered in each essay (adsorption and desorption capacities were similar). Additionally, more than 90 % of adsorbed VA and SA was recovered with five bed volumes of ethanol/water (90/10, v/v), with the exception of VA essay at 288 K, were a recovery of 85 % was achieved.
K
EYWORDS: Vanillic acid, syringic acid, batch adsorption, fixed bed, adsorption, capacity ofResumo
Os ácidos fenólicos como o ácido vanílico (VA) e seríngico (SA) resultam da oxidação da lenhina com O2 em meio alcalino, um processo focado principalmente para a produção de vanilina (VL) e seringaldeído (SY). Estudos de separação e recuperação de VA e SA são escassos. No entanto, esses dois ácidos fenólicos têm muitas aplicações na indústria farmacêutica e por isso é importante investigar a sua possível recuperação da mistura oxidante de lenhina. Esta tese teve assim como propósito principal, estudar a adsorção de VA e SA numa resina não-iónica, Sepabeads SP700, visando a sua separação dos outros produtos e recuperação.
Foram realizadas experiências em batch de adsorção de equilíbrio a três temperaturas diferentes (288, 298 e 333 K) para soluções aquosas de VA e SA e os resultados experimentais foram ajustados às isotérmicas de equilíbrio de adsorção dos modelos de Langmuir e Freundlich. Através da aplicação do modelo de Langmuir obteve-se uma capacidade máxima de adsorção de 0.475 g/g para o VA e 0.391 g/g para o SA. Para o modelo de Freundlich obteve-se um 1/n de 0.383 e 0.396 para o VA e o SA, respetivamente, o que indicou que a adsorção foi favorável. Este modelo previu melhor os valores de capacidade de adsorção em equilíbrio obtidos para o VA e o SA.
Os valores de energia envolvida no processo de sorção obtidos para os dois compostos foram negativos (-34.2 e -13.1 kJ/mol), indicando que a adsorção teve um comportamento exotérmico. Os ácidos fenólicos tiveram um comportamento semelhante aos aldeídos estudados por alguns autores.
Foram também realizadas experiências em leito fixo para o VA e o SA com a resina Sepabeads SP700 e foram obtidas as respetivas curvas de rutura. Para os ensaios com VA foi utilizada uma concentração de alimentação (Cf) de 1.40 g/L a 288 K e outra a 313 K e duas Cf
de 0.67 g/L e 1.22 g/L a 298 K. Para os ensaios com SA utilizou-se uma Cf de 0.71 g/L para
288 K e outra igual para 313 K e duas Cf de 0.16 g/L e 0.67 g/L para 298 K.
No leito fixo os valores de qe ajustaram-se ao modelo de Freundlich obtido pelos estudos de
adsorção em batch.
Foram realizados estudos de dessorção com etanol/água (90/10, v/v) e praticamente todo o soluto adsorvido foi recuperado em cada experiencia (as capacidades de adsorção e dessorção foram semelhantes). Adicionalmente, foi possível recuperar mais de 90 % de VA e SA adsorvido em 5 volumes de leito de etanol/água (90/10, v/v) com exceção para o VA a 288 K que teve uma recuperação de 85 %.
Palavras-chave: Ácido vanílico, ácido seríngico, adsorção em batch, leito fixo, capacidade de adsorção, modelo de Langmuir, modelo Freundlich.
Adsorption equilibrium and fixed-bed adsorption of phenolic acids onto polymeric adsorbent
List of Figures
Figure 1. The precursors of p-hydroxyphenyl, guaiacyl and syringyl moieties of the lignin structure[2] .2
Figure 2. A structural model of a technical lignin fragment (kraft lignin)[8] ...2
Figure 3. Mixture of phenolic compounds obtained by oxidation of lignin. (source: Internal Document LA LSRE-LCM courtesy of Paula Pinto, 2015) ...3
Figure 4. Molecular structure of a) vanillic acid (VA) and b) syringic acid (SA) ...3
Figure 5. Simplified flow sheet of the integrated process for production of value-added functionalized monomers from lignin-and polymers from lignin (source: Internal Document LA LSRE-LCM courtesy Paula Pinto, 2015) ...5
Figure 6. Adsorption equilibrium isotherms which follow a behaviour of Langmuir or Freundlich models ... 16
Figure 7. Variation of concentration in solution with the time for batch adsorption ... 19
Figure 8. Concentration profile at different time in the fixed bed [45] ... 19
Figure 9. Concentration at column outlet [45] ... 19
Figure 10. Experimental adsorption equilibrium (symbols), qe versus Ce, and fittings to the Langmuir model (lines) at different temperatures (288 K, 298 K and 313 K) for the adsorption of VA onto Sepabeads SP700. ... 32
Figure 11. Experimental adsorption equilibrium (symbols), qe versus Ce, and fittings to the Langmuir model (lines) at different temperatures (283, 298 and 313 K) for the adsorption of SA onto Sepabeads SP700. ... 32
Figure 12. Experimental adsorption equilibrium (symbols), qe versus Ce, and fittings to the Freundlich model (lines) at different temperatures (288 K, 298 K and 313 K) for the adsorption of VA onto Sepabeads SP700 ... 34
Figure 13. Experimental adsorption equilibrium (symbols), qe versus Ce, and fittings to the Freundlich model (lines) at different temperatures (288 K, 298 K and 313 K) for adsorption of SA onto Sepabeads SP700 ... 35
Figure 14. Experimental adsorption equilibrium (symbols), qe versus Ce, and fittings to the Langmuir and Freundlich models (lines) at different temperatures (288 K, 298 K and 313 K) for the adsorption of VA onto Sepabeads SP700 ... 35
Figure 15. Experimental adsorption equilibrium (symbols), qe versus Ce, and fittings to the Langmuir and Freundlich models (lines) at different temperatures (288 K, 298 K and 313 K) for the adsorption of SA onto Sepabeads SP700 ... 36
concentrations of 1.40, 1.22 and 1.39 g/L at 288, 298 and 313 K, respectively, with flow-rate 5.2 mL/min were tested ... 39
Figure 17. Effect of Cf on the fixed bed adsorption of VA onto Sepabeads SP700. The solution was
tested for two feed concentrations (0.67 g/L and 1.22 g/L) at 298 K with a flow-rate of 5.2 mL/min 39
Figure 18. Effect of temperature on the fixed bed adsorption of SA onto Sepabeads SP700. Feed
concentrations 0.71, 0.67 and 0.71 g/L at 288, 298 and 313 K, respectively with flow-rate 5.2 mL/min were tested ... 40
Figure 19. Effect of Cf on the fixed bed adsorption of SA onto Sepabeads SP700. The solution was
tested to two initial concentrations (0.16 g/L and 0.67 g/L) at 298 K with a flow-rate of 5.2 mL/min 41
Figure 20. Experimental adsorption equilibrium (symbols), qe versus Ce, and fittings to the Langmuir
model (lines) at different temperatures (288 K, 298 K and 313 K) for the adsorption of VA onto Sepabeads SP700. Fixed bed points resulting from feed concentration of 1.40 g/L (313 K), 1.22 g/L (298 K), 0.67 g/L (298 K) and 1.39 g/L (288 K) at flow-rate of 5.2 mL/min, are also shown ... 43
Figure 21. Experimental adsorption equilibrium (symbols), qe versus Ce, and fittings to the Freundlich
model (lines) at different temperatures (288 K, 298 K and 313 K) for the adsorption of VA onto Sepabeads SP700. Fixed bed points resulting from feed concentration of 1.40 g/L (313 K), 1.22 g/L (298 K), 0.67 g/L (298 K) and 1.39 g/L (288 K) at flow-rate of 5.2 mL/min, are also shown ... 44
Figure 22. Experimental adsorption equilibrium (symbols), qe versus Ce, and fittings to the Langmuir
model (lines) at different temperatures (288 K, 298 K and 313 K) for the adsorption of SA onto Sepabeads SP700. Fixed bed points resulting from feed concentration of 0.71 g/L (313 K), 0.67 g/L (298 K), 0.16 g/L (298 K) and 0.71 g/L (288 K) at flow-rate of 5.2 mL/min, are also shown ... 45
Figure 23. Experimental adsorption equilibrium (symbols), qe versus Ce, and fittings to Freundlich
model (lines) at different temperatures (288 K, 298 K and 313 K) for the adsorption of SA onto Sepabeads SP700. Fixed bed points resulting from feed concentration of 0.71 g/L (313 K), 0.67 g/L (298 K), 0.16 g/L (298 K) and 0.71 g/L (288 K) at flow-rate of 5.2 mL/min, are also shown ... 46
Figure 24. The outlet concentrations at different temperatures (288 K, 298 K and 313 K) of VA
desorption onto Sepabeads SP700 at flow-rate of 5.2 mL/min ... 47
Figure 25. The outlet concentrations at different temperatures (288 K, 298 K and 313 K) of SA
desorption onto Sepabeads SP700 at flow-rate of 5.2 mL/min ... 48
Figure 26. The outlet concentrations on desorption of VA onto Sepabeads SP700 at flow-rate of 5.2
mL/min for two feed concentrations of adsorption (1.22 g/L and 0.67 g/L) ... 48
Adsorption equilibrium and fixed-bed adsorption of phenolic acids onto polymeric adsorbent
Figure 30. Variation of VA concentration with the time during the batch adsorption at 298 K ... 66
Figure 31. Variation of VA concentration with the time during the batch adsorption at 313 K ... 67
Figure 32.Variation of SA concentration with the time during the batch adsorption at 288 K ... 68
Figure 33. Variation of SA concentration with the time during the batch adsorption at 298 K ... 68
Figure 34. Variation of SA concentration with the time during the batch adsorption at 313 K ... 69
Adsorption equilibrium and fixed-bed adsorption of phenolic acids onto polymeric adsorbent
List of Tables
Table 1. Properties of VA and SA in literature ...9
Table 2. Studies to recovery VA and SA by adsorption in aqueous solution ... 10
Table 3. Examples of SP700 resin applications for recovery of phenolic compounds extracted from natural sources ... 12
Table 4. Main properties of the resin SP700 ... 23
Table 5. C0 and resin weight used in batch adsorption for VA ... 25
Table 6. C0 and resin weight used in batch adsorption for SA ... 26
Table 7. Cf of VA and SA used in fixed-bed ... 27
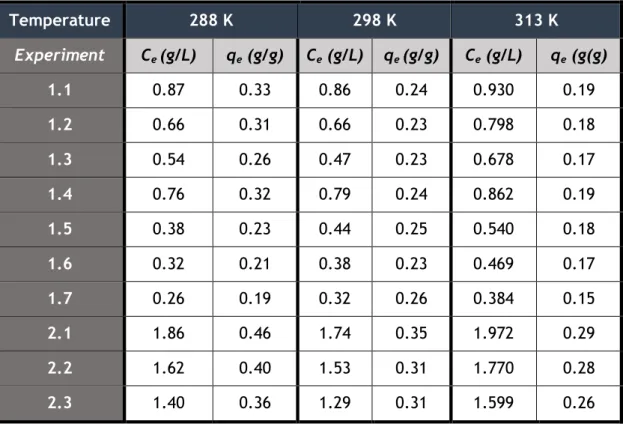
Table 8. Values of Ce and qe obtained for VA at 288, 298 and 313 K in batch adsorption ... 30
Table 9. Values of Ce and qe obtained for SA at 288, 298 and 313 K in batch adsorption... 30
Table 10. Values of qmax, KL,K0 andΔH obtained by fitting to the Langmuir model ... 31
Table 11. Values of 1/n, KF,K0 andΔH obtained by fitting to the Freundlich model ... 33
Table 12. Adsorption capacity and theoretical stoichiometric time for VA applying the Langmuir and Freundlich models ... 38
Table 13. Adsorption capacity and theoretical stoichiometric time for SA applying the Langmuir and Freundlich models ... 38
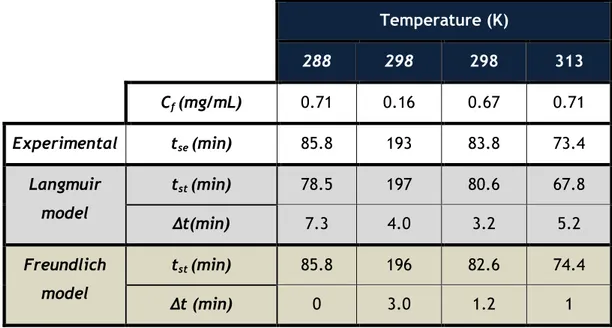
Table 14. Theoretical and experimental stoichiometric time applying the Langmuir and Freundlich models for VA ... 41
Table 15. Theoretical and experimental stoichiometric time applying the Langmuir and Freundlich models for SA ... 42
Table 16. Cf and qf values of VA and SA at 288, 298 and 313 K on fixed bed adsorption ... 43
Table 17. Experimental and theoretical qf values with ERRQS for Langmuir and Freundlich models for VA ... 45
Table 18. Experimental and theoretical qf values with ERRQS for Langmuir and Freundlich models for SA ... 46
Table 19. Desorption capacity of VA and SA in fixed bed ... 50
Table 20. Recovery percentage of VA and SA in the desorption ... 50
Table 21. Solubility for different temperatures for VA ... 60
Table 22. Solubility for different temperatures for SA ... 60
Table 23. Ratio of VA weight and resin weight for isotherm determination at 288 K ... 61
Table 26. Ratio of SA weight and resin weight for isotherm determination at 288 K. ... 63
Table 27. Ratio of SA weight and resin weight for isotherm determination at 298 K. ... 63
Table 28. Ratio of SA weight and resin weight for isotherm determination at 313 K. ... 63
Table 29. ERRSQ values of fitting qe to Langmuir model for VA ... 64
Table 30. ERRSQ values of fitting qe to Freundlich model for VA ... 64
Table 31. ERRSQ values of fitting qe to Langmuir model for SA ... 65
Table 32. ERRSQ values of fitting qe to Freundlich model for SA ... 65
Adsorption equilibrium and fixed-bed adsorption of phenolic acids onto polymeric adsorbent
List of Equations
adsorbent 0 e 0 e w V ) C (C q Equation 1 ... 13 e L e L e C K 1 C K q q m Equation 2 ... 15 e L e e C q 1 K q 1 q C m m Equation 3 m q 1 e C 1 L K m q 1 e q 1 Equation 4 ... 15 n 1 e F e K (C ) q Equation 5 ... 16)
(
n
1
)
(
)
(
q
eLn
K
FLn
C
eLn
Equation 6 ... 16 2 i ) means , e q p 1 i (qe,calc ERRSQ Equation 7 ... 17 ΔH/RTe
K
K
0
Equation 8 ... 18 A Q u0 Equation 9 ... 20 2 4 dC A
Equation 10 ... 20 c u i u 0 Equation 11 ... 20
f f c c i c stC
q
u
L
t
1
1
Equation 12 ... 20dt
C
C
t
f st
0 exp ,1
Equation 13 ... 21
1
(
1
)
1
(
1
)
exp ,fh
C
fh
V
t
C
Q
q
p C f C p C st f ads
Equation 14 ... 21
1
(1 ) (1 ) (1 ) 0 fh C fh V Q Cdt q p c f C p C t des
Equation 15 ... 21Adsorption equilibrium and fixed-bed adsorption of phenolic acids onto polymeric adsorbent
List of Contents
1 Introduction ... 1
1.1 Background and motivation ... 1
1.1.1 Research area ‘Lignin Valorisation’... 4
1.2 Objectives of the work ... 5
1.3 Research unit presentation ... 5
1.3.1 Brief description ... 5
1.3.2 Research lines and groups ... 6
1.4 Outline of the work ... 7
2 State of the art ... 9
2.1 Phenolic acids ... 9
2.2 Phenolic aldehydes ... 11
2.3 Resin Sepabeads SP700 ... 12
3 Theoretical concepts ... 13
3.1 Adsorption and adsorption capacity ... 13
3.2 Selection of adsorbent ... 14
3.3 Adsorption equilibrium ... 14
3.3.1 Adsorption equilibrium Isotherms ... 14
3.3.2 Determination of adsorption equilibrium isotherms ... 17
3.4 Kinetics and thermodynamics of adsorption processes ... 17
3.5 Techniques of adsorption ... 18
4 Technical description and procedures ... 23
4.1 Chemicals and adsorbent ... 23
4.2 Equipment ... 24
4.3 Calibration Curves for HPLC ... 24
4.4 Solubility and stability tests ... 24
4.5.2 Syringic acid (SA) ... 26
4.6 Fixed-bed adsorption method ... 26
5 Results and discussion ... 29
5.1 Batch adsorption experiments using the bottle point method ... 29
5.1.1 Time to equilibrium and solute adsorbed per weight unit of adsorbent at equilibrium (qe) ... 29
5.1.2 Adsorption equilibrium isotherms ... 31
5.2 Fixed-bed adsorption ... 37
5.3 Fixed-bed Desorption ... 47
6 Conclusions ... 51
7 Limitations and future work ... 53
8 References ... 55 9 Appendix ... 59 9.1 Appendix A... 59 9.2 Appendix B ... 60 9.3 Appendix C ... 61 9.4 Appendix D... 63 9.5 Appendix E ... 64 9.6 Appendix F ... 66 9.7 Appendix G ... 68 9.8 Appendix H ... 70
Adsorption equilibrium and fixed-bed adsorption of phenolic acids onto polymeric adsorbent
Nomenclature
A Cross sectional area of the column cm2
C0 Initial concentration of adsorbate in solution g/L
Ce Concentration of the sorbate in the liquid phase at
equilibrium g/L
Cf Feed concentration in fixed bed experiments g/L
dc Diameter of column cm
εc Porosity of column -
fh Humidity factor of resin -
ΔH Change in enthalpy kJ/mol
i Number of experiments of 1 to p. -
KF Constant related to the free energy of adsorption for
Freundlich (g/g) / (L/g)
1/n
KL Constant related to the free energy of adsorption for
Langmuir L/g
K Isotherm constant related to the free energy of adsorption
*for Langmuir or Freundlich models *L/g or (g/g)/(L/g)
1/n
K0 Equilibrium constant
*for Langmuir or Freundlich models *L/g or (g/g)/(L/g)
1/n
Lc Column length cm
n Heterogeneity Factor -
p Total number of experimental points -
ρapp Apparent density of resin g wet resin /L resin
qmax Maximum adsorption capacity g adsorbate /g dry adsorbent
qe Amount of solute adsorbed per weight unit of
adsorbent at equilibrium g adsorbate /g dry adsorbent qe,calc Theoretical adsorbed concentration in solid phase at
equilibrium g adsorbate /g dry adsorbent
qe,means Experimental adsorbed concentration in solid phase at
equilibrium g adsorbate /g dry adsorbent
des adsorbate dry adsorbent
Q Flow rate L/min
R Universal gas constant (8.314×10⁻³) kJ/molK
T Absolute temperature K
tst Theoretical stoichiometric time min
tst,exp Experimental stoichiometric time min 0
u Superficial velocity cm/min
i
u Interstitial velocity cm/min
V0 Volume of solution L
V Column volume L
wadsorbent weight of adsorbent g
Abbreviations
ERRSQ Sum of square of the errors SA Syringic acid
SY Syringaldehyde VA Vanillic acid VL Vanillin
Adsorption equilibrium and fixed-bed adsorption of phenolics acids onto polymeric adsorbent
1 Introduction
1.1
Background and motivation
Portugal has one of the most important pulp and paper industries being the 4th largest European producer of pulp and the 3rd of chemical pulps in 2012.[1] Kraft pulping is one of the processes involved in the pulp and paper production. In this process the delignification of the wood matrix promote the liberation cellulose and a fraction of the original hemicellulose and promoting the lignin dissolution in pulping liquor, resulting in an effluent called black liquor.[2]
Kraft pulping is the main process used in the world for production of pulp for paper. The production of 500 thousand tons of kraft pulp (typical for an average-size mill) corresponds to about 290 thousandtons of the black liquor with a solids content of 15%. About one half of these solids is lignin.[2] Pulping liquor is the main source of lignin easily accessible on large scale and comes from wood delignification in pulp and paper industries. The most part of lignin produced in pulp and paper industries, is mainly used for energy recovery at the pulp mills, and only a small fraction is used for commercial applications, mostly in lignosulfonate form.[3] The separation of lignin from black liquor and the conversion of lignin into high-value products have becoming noticeable in the recent years.[4,5]
In lignocellulosic biorefinaries, cellulose is the main target of the biomass delignification with the goal of producing bioethanol. There are only a few biorefineries which use the lignin to convert into high-value products. Borregaard is one of the most advanced biorefineries. This company is a supplier of lignosulfonate and vanillin (VL) produced from lignin, which is separated during the production of cellulose. In pulp and paper industries, lignin is a by-product exceeding 50 million tons per year.[6]
Lignin is a three-dimensional phenolic macromolecule composed by distinct aromatic nuclei: p-hydroxyphenyl (H), guaiacyl (G), and syringyl nuclei (S). Softwood lignins are G:H type and hardwood lignin are S:G:H type. Thus, kraft operations are highly integrated and depend on black liquor for pulping chemicals recovery and as fuel.
The typical hardwood lignin is a copolymer of coniferyl and sinapyl alcohols (Figure 1) being usually indicated as "guaiacyl-syringyl lignin".[2]
Figure 1. The precursors of p-hydroxyphenyl, guaiacyl and syringyl moieties of the lignin structure[2] According to the plant material there are different proportions of these monomers. These monomers can establish different linkages leading to a complex molecule.[7]
A representation of a molecular fraction of kraft lignin is shown in figure 2.
Figure 2. A structural model of a technical lignin fragment (kraft lignin)[8]
The source of biomass in pulp and paper industry and the delignification process have significant interference on the structure of the lignin (linkages and functional groups).[3]
Eucalyptus species represents the main raw-material for the pulp industry in South America, Portugal and Spain. In Portugal, approximately 7 million m3 of debarked Eucalyptus
globulus wood per year is used in pulp production for high performance paper.[3]
The oxidation of lignin at specific and controlled conditions produces a complex mixture of phenolic compounds, namely syringaldehyde (SY), vanillin acid (VL), vanillic acid (VA) and syringic acid (SA), as depicted in Figure 3.[2]
Adsorption equilibrium and fixed-bed adsorption of phenolic acids onto polymeric adsorbent
Figure 4. Molecular structure of a) vanillic acid (VA) and b) syringic acid (SA)
Figure 3. Mixture of phenolic compounds obtained by oxidation of lignin. (source: Internal Document LA LSRE-LCM courtesy of Paula Pinto, 2015)
The lignin-rich side streams currently produced in pulp and paper industries and in biorefinaries are mainly derived from hardwoods and annual/perennial plants. As such, besides VL and VA, also syringil-derived compounds (SY, SA, acetosyringone) are produced in the oxidation process of lignin, increasing the complexity of the mixture obtained. Therefore, it is important the study of processes aiming the separation of these final products.
The VA and SA have not been studied as compounds produced from lignin. However, these two phenolic acids compounds have many applications on pharmaceutical industry[9,10] and their possible valorisation needs to be investigated.
Recently, the phenolic acids, such as SA and VA, has had good results in studies of treatments against aging and for a wide variety of diseases, including cancer, Parkinson´s, and chronic inflammatory diseases. This is the reason why the interest on these compounds is increasing.[9, 10] The molecular structure of these two acids is shown in figure 4.
When compared to other processes such liquid-liquid extraction, crystallization, distillation, adsorption can be a more suitable process to recover phenolic compounds due to
Lignin, represented by a fragment
1 2 4 5 6 7 3 1. Vanillic acid 2. Syringic acid 3. p-hydroxybenzaldehyde 4. Vanillin 5. Syringaldehyde 6. Acetovanillone 7. Acetosyringone Oxidation O2/OH -Oxidation products
Lignin as source of syringaldehyde and vanillin
22 Porto, October 28-30 2014
Production of syringaldehyde and vanillin from different lignins – comparative study
a) b)
is ease to regenerate and usually has low cost.[11]
1.1.1 Research area ‘Lignin Valorisation’
The research area in ‘Lignin Valorisation’ is included in the topic ‘New High Value-Added Products from Agro-Food Resources’ within the RG2.
Valorisation of lignin has been one of the key research topics at LSRE. Since 90’s a consistent program of reaction and separation processes have been developed for oxidative depolymerisation of lignin, subsequent recovery of high-added value chemicals, and polymers synthesis. This subject has been intensively studied under the leadership of Professor Alírio Rodrigues. The research program started with the process development of VL production from softwood lignin in batch reactor. Later on a structured packed bubble column reactor for continuous production was designed and built leading to the Ph.D Thesis ‘Production of VL from Lignin Present in the Kraft Black Liquor of the Pulp and Paper Industry’ (2008, José Daniel Pacheco Araújo). Concerning separation, LSRE team studied ultrafiltration and adsorption processes demonstrating its application in the recovery of VL from lignin solutions. In another perspective, although complementary to the first one, the team also developed the production of lignin-based polymers, such as polyurethanes, in collaboration with EFPG, Grenoble.
Recently, the research team has been working on different types of lignin, finding additional high added-value compounds, in the perspective of valorising the side streams from new processes (and raw materials) in biorefineries. Two Ph.D thesis are currently ongoing: ‘VL and SY from Side Streams of Pulp & Paper Industries and Biorefineries’ (Carina Costa) and ‘Fractionation and Purification of SY and VL from Oxidation of Lignin’ (Inês Mota). Moreover, the team is also working on two industry-driven projects in the lignin valorisation topic.
The team has been working on adsorption and desorption of VL and SY onto two different macroporous resins. The integrated process is present in figure 5. However, the adsorption and desorption behaviour of VA and SA, two important products resulting from lignin oxidation, was never studied in one of the most promising resins previously found for VL and SY. Therefore, the main contribution of this work is to study the adsorption and desorption of VA and SA from aqueous solutions using the nonpolar resin SP700.
Adsorption equilibrium and fixed-bed adsorption of phenolic acids onto polymeric adsorbent
Figure 5. Simplified flow sheet of the integrated process for production of value-added functionalized monomers
from lignin-and polymers from lignin (source: Internal Document LA LSRE-LCM courtesy Paula Pinto, 2015)
1.2 Objectives of the work
This dissertation aimed to contribute to the study of VA and SA recovery from the mixture resulting from lignin oxidation as part of a broader project for lignin valorisation in lignocelullosic biorefineries and pulp and paper industries. The main objectives of this work are:
1. To perform equilibrium batch adsorption studies of VA and SA in mono-component aqueous solution onto Sepabeads SP700 for different temperatures;
2. To apply adsorption equilibrium isotherms to describe the adsorption behaviour at different temperatures, evaluating the fitting and resulting parameters, such as adsorbent capacity;
3. To understand the influence of temperature on the adsorption of these phenolic compounds;
4. To perform fixed bed studies at different feed concentrations and temperatures and comparing the results with the data from batch experiments;
5. To perform desorption studies employing 90:10 % V/V ethanol:water solution.
1.3 Research unit presentation
1.3.1 Brief description
The R&D Associate Laboratory LSRE-LCM, a partnership between LSRE (Laboratory of Separation and Reaction Engineering) and LCM (Laboratory of Catalysis and Materials), is a
of the University of Porto, with two external Poles at Instituto Politécnico de Bragança and Institution Politécnico de Leiria. At present, LSRE-LCM integrates a total of 117 researchers, 69 holding a PhD degree and 27 PhD students. There internationally recognized scientific activity is well expressed by over 920 articles published in the 2005-2013. The mission of the LA is to contribute to the scientific and technological development at National and EU levels in the areas of Separation and Reaction Processes in Chemical Engineering. R&D activities are focused on areas such as: Separation Processes; Reaction Engineering; Process Modelling, Simulation and Control; Environmental Engineering; Heterogeneous Catalysis; and Carbon Materials. A wide range of know-how levels is covered by the LA activities, from fundamental research to the development of industrial products and processes. Training of high-competence researchers and technicians through post-graduate and post-doctoral programmes is a major part of the mission of the LA.
1.3.2 Research lines and groups
The LA is scientifically organized in two thematic Research Lines and four Research Groups (Cyclic Separation/Reaction Processes; Product Engineering; Thermodynamics & Environment; Catalysis and Carbon Materials):
Research Line 1 - New Technologies Of Cyclic Separations/Reactions
The vast experiment of LSRE in separation and reaction processes is the main drive for the various research projects in this area, which are complemented by the know-how of LCM in the field of preparation and development of catalysts and adsorbents. This Research Line comprises the Research Groups: RG1. Cyclic Adsorption/Reaction Processes; RG3. Thermodynamics & Environmental Science and Engineering;
Research Line 2 - Synthesis And Formulation of High-Added Value Products
The combined experiments of LSRE and LCM in this area include various projects for conception and production of high-efficiency catalysts and nanostructured materials, the development of innovative processes and the formulation of high-added value products. This Research Line comprises two Research Groups: RG2. Product Engineering; RG4. Catalysis and Materials.
Adsorption equilibrium and fixed-bed adsorption of phenolic acids onto polymeric adsorbent
1.4 Outline of the work
Chapter 1 - Introduction
A brief introduction to the topic of VA and SA was made. The importance of finding sustainable solutions for the recovery of these compounds was contextualized. The objectives and contributions of this work were presented as well as the Research Unit where this project was developed.
Chapter 2 - State of the art
In this chapter is made a data collection of the studies from literature applying the adsorption of VA and SA. The principal results and conditions of the studies were described.
Chapter 3 – Adsorption
The description of the compounds was made. The involved mechanisms in adsorption were explained. The adsorption equilibrium isotherms, the selection of the best adsorbent and the kinetics and thermodynamic aspects of adsorption were discussed. Finally, the techniques of adsorption and the equations for calculation of the amount of each compound adsorbed onto the adsorbent (qf) and desorbed from the adsorbent (qdes) were present.
Chapter 4 – Technical description and procedures
The methodology applied to obtain the calibration curve of VA and SA, solubility and stability tests for the two compounds in water and the procedure for adsorption in batch and in fixed bed were explained.
Chapter 5 – Results and discussion
The results obtained in this study were presented and discussed on this chapter, namely the adsorption equilibrium isotherms, and the comparison between the Langmuir and Freundlich models to describe the behaviour of adsorption of the phenolic acids in batch and fixed bed experiments. The effect of temperature on the adsorption capacity was evaluated.
Chapter 6 – Conclusions
The main conclusions of this work were presented in this chapter.
Chapter 7 – Limitations and future work
The limitations that occurred during the experiments and the work that needs to be done in the future to improve the results were presented.
Adsorption equilibrium and fixed-bed adsorption of phenolic acids onto polymeric adsorbent
2 State of the art
2.1 Phenolic acids
Phenolic acids differ by the number and position of the hydroxyl groups on the aromatic ring. These compounds may be divided into two groups: hydroxybenzoic acid derivatives, which include p-hydroxybenzoic, protocatechuic, gallic acids, VA and SA and hydroxycinnamic acid derivatives, which include p-coumaric, caffeic and ferulic acid.
Through oxidation of the lignin present in black liquor, VA and SA are produced among other low molecular weight compounds.[3] In table 1, the properties of VA and SA are summarized.
Table 1. Properties of VA and SA in literature
The separation and purification of phenolic compounds can be achieved by different technologies, adsorption is the most studied.
Studies on adsorption of VA and SA are scarce and limited to the adsorption onto activated carbon.[20, 21-23]
The activated carbon is the most used adsorbent due the great adsorption capacity for organic compounds in industrial applications (purification and recovery in chemical and pharmaceutical processing and environmental remediation). Nevertheless, this adsorbent has high cost, mainly due to an usually expensive regeneration system which make it less economically viable.[24]
The adsorption of the phenolic acids of interest with activated carbon has been studied as well as the influence of some variables such pH and temperature. The main published results are summarized in table 2.
Compound M (g.mol-1) Tmelt (ºC) Tboil (ºC) d
(g.cm-3) pKa (298 K) water (g.LSolubility in -1)
VA 168.15 [12,13] 207-211.5 [12, 14, 15] (101.3KPa)353.4 [15] 1.351 [16] Water: pKa1 4.42, pKa2 9.39 [17] 1.53 (298 K)[18] SA 198.2 [13] 205 – 209 [16] 192-193 (6.7 KPa) [14, 15] 363 (101.3 KPa) [19] 1.335 [19] Water: pKa1 4.34, pKa2 9.49 [17] 5.8 (298 K)[15]
Table 2. Studies to recovery VA and SA by adsorption in aqueous solution
(C)AC - (commercial) Activated carbon *pH correct with NaOH and H2SO4
The equilibrium adsorption isotherms of SA, from aqueous solutions at 293 K, 303 K and 313 K on a bituminous coal based activated carbon using the batch bottle point method were investigated by Garcia et al.[21] The adsorption isotherms on activated carbon were obtained from the mass balance of dissolved SA. Within the range of temperatures studied (between 293 and 313 K) the temperature did not have a noteworthy influence for equilibrium concentrations until 0.4 g/L: only a slight increase of the adsorption capacity was observed with the temperature rise and thus, results suggested a somewhat endothermic adsorption process. The maximum adsorptive capacity was found for pH range 3-4. For higher pH values there was an important decrease of the adsorption capacity, which was due to the increase of the proportion of the SA ionized form, thus increasing the polarity, resulting in a lower adsorption onto activated carbon.
The adsorption of a mixture of polyphenols (consisting of caffeic acid, VL, VA, p-hydroxybenzoic acid and gallic acid) at two temperatures (298 K and 313 K) for different types of activated carbon was studied by Michailof et al.[22] The adsorption isotherms at equilibrium were determined using the batch bottle point method. The adsorption capacity for each compound followed the same trend for the two temperatures: caffeic acid, VL, VA, p-hydroxybenzoic acid and gallic acid. The authors have compared the solubility in water of each compound with the adsorption capacity: the lower the solubility, the higher was the
Adsorbate
Adsorbent Characteristics
T (K) pH
qmax
(mg/g) Ref.
Adsorbent Surface area (m2/g)
VA AC 1370 293 8* ≈240 [23] AC - olive husk derived ≈1000 298 318 3.2-3.5 148.23 171.46 [22] CAC ≈1000 56.31 85.10 SA AC – bituminous coal 967 293 303 313 3.4-3.7 ≈260-320 [21]
Adsorption equilibrium and fixed-bed adsorption of phenolic acids onto polymeric adsorbent
authors of this study have stated that the low positive values of ΔH0, below 20 kJ/mol, indicated physisorption and an endothermic process.
The adsorption of polyfunctional phenols (tyrosol, catechol, veratric acid, VA and caffeic acid) from olive oil mill waste waters on active charcoal at 293 K was studied by Richard et al.[23] The batch bottle point method was one more time applied to obtain the adsorption isotherms. The authors have tried to correlate the adsorption parameters with the structure of the adsorbates but they were not successful. Nevertheless, adsorption capacity for the acidic phenols was much lower than for the other compounds. The Freundlich equation was found to provide the best fit for all the compounds except for the catechol. The main results and conditions are summarized in table 2.
2.2 Phenolic aldehydes
The adsorption and recovery of phenolic aldehydes, such as VL and SY have been more extensively investigated than it was for VA and SA. There are some studies of adsorption with polymeric adsorbents.
Synthetic polymeric adsorbents, such as resins, are durable, chemically inert and stable, and possess high adsorption capacity, efficiency, selectivity and ease of regeneration, with relatively low cost. However, the effective surface areas are smaller than in the case of activated carbon.[11]
Wang et al. investigated the separation of VL and SY from oxygen delignification spent liquor using a non-polar macroporous resin.[25] The authors used the batch bottle point method, studying the effects of pH (4.0 to 6.5), the amount of adsorbent (7.4 to 22.2 g) and the temperature (290 to 330 K). The Langmuir model could describe the isotherm to pH equal to 4.5 and the results demonstrated that the adsorption equilibrium constant decreased with the increasing of pH, which could be explained by the acid dissociation of the compound, whose ionic products are not adsorbed by the resin. The increase of temperature led to a decrease on the adsorption equilibrium capacity, thus, it was concluded that the adsorption process was exothermic, a fact confirmed by the ΔH obtained (-17.68 kJ/mol) for the range of the studied temperatures.
The recovery of dissolved VL from aqueous solutions by adsorption onto three macroporous resins (NKA-2, S-8 and H103) applying the batch bottle point method was studied.[26] The authors have tested the influence of pH and salt concentration on the adsorption capacity for the resin H103. The results demonstrated that the amount of solute adsorbed per weight unit of dy resin at equilibrium (qe) of the three resins obtained
decreased in the following the order: H103, S-8 and NKA-2, what makes sense because the H103 has higher nonpolar surface area. The best q was obtained in acid conditions, when the
qe increase. After that, the authors have performed a fixed-bed study, at room temperature with a solution at pH 6.0. The results revealed that the saturated adsorption capacity of VL on H103 resin was 416 mg/g. In desorption studies, the authors obtained more than 96% of the adsorbed VL using five bed volumes of ethanol.
The adsorption of synthetic VL onto non-polar polymeric resin, Sepabeads SP206, using the batch bottle point and the fixed-bed methods was studied by Zabková et al.[27] In batch studies, the results revealed that the increased of temperature between 293 and 333 K have a negative impact on qe. The adsorption equilibrium isotherms were described by the Langmuir model. The fixed bed adsorption revealed that the increasing of the temperature led to an early saturation of the bed for both feed concentration of VL (3.30×10⁻³ mol/L and 6.60×10⁻⁴ mol/L). The same trend was observed with the increase of the flow-rate. The increase of pH in solution led to decrease of the adsorbed VL.
2.3 Resin Sepabeads SP700
The Sepabeads SP700 is an aromatic, non-polar macroporous resin with great adsorption capacity for organic compounds, in particular for polyphenols. There are some studies about the recovery of phenolic compounds by natural sources with very good results of adsorption capacity using the SP700 resin.[28-30] Some examples are depicted in Table 3. The good performance of this resin prompts us to select this as adsorbent for phenolic acids VA and SA.
Table 3. Examples of SP700 resin applications for recovery of phenolic compounds extracted from natural sources
Solution (target phenolic compounds) Ref.
Grape and wine by-products (phenolics) [30]
Distilled grape pomace aqueous extracts (phenolics) [29]
Solvent extracts from auto hydrolysis liquors of grape pomace (phenolics) [28]
Applications for this resin normally encompass the extraction of antibiotics from fermentation liquors, refinement of pharmaceutical products, polypeptides, proteins, natural extracts (polyphenols) and chromatographic separations of fine chemicals. The application of this resin for the adsorption of derivatives from lignin oxidation, in particular VA and SY is reported in this work for the first time.
Adsorption equilibrium and fixed-bed adsorption of phenolic acids onto polymeric adsorbent
3 Theoretical concepts
3.1 Adsorption and adsorption capacity
The adsorption is a process that occurs when a liquid solute (adsorbate) adheres to a surface (adsorbent).
The sorption is the basis of separation of solutes from a mixture due the different proneness to adhere on the sorbent and can be separated in two stages: the adsorption step, where a selective concentration of one or more components is retained on the surface of adsorbent, and the desorption/regenerated step, where the compounds are recovered and the initial adsorbent capacity is restored.
The nature of the bonding between the adsorbate and the adsorbent depends of the species involved and the adsorption phenomenon can be distinguished in physisorption and chemisorption.
The adsorption which results from the influence of van der Waals forces is essentially physical and can be easily reversed. In chemical adsorption there are additional forces that involve the exchange or sharing of electrons, establishing chemical bonds such as hydrogen bonds, π-bonds, acid-base interactions. In this case the process is not so easily reversed, and the regeneration phase could be a problem.[31]
The adsorption capacity of the adsorbent for a specific compound corresponds to the adsorbed amount when concentration reaches a constant value, which corresponds to the equilibrium concentration. Thus, in batch systems the adsorbed amount is given by the difference between the initial concentration and the equilibrium concentration.
The adsorption capacity at adsorption equilibrium, 𝑞𝑒 (mg/g of resin), can be
calculated by a mass balance given by equation 1.[32]
adsorbent 0 e 0 e w V ) C (C q Equation 1 Where, 0
C - Initial concentration of solute in solution (g/L);
e
C - Equilibrium concentration of solute in solution (g/L);
0
V - Volume of solution (L);
adsorbent
w - Weight of adsorbent (g).
There are many factors influencing the adsorption capacity such as the nature of the adsorbent and the adsorbate and the solution conditions.
3.2 Selection of adsorbent
The adsorbents have a natural origin or result of an industrial production and/or activation process. Typical natural adsorbents are clay minerals, natural, zeolites, oxides or biopolymers. The adsorbents can be classified into carbonaceous adsorbents, polymeric adsorbent and zeolite molecular sieves. The activated carbon produced from carbonaceous material is the most widely applied adsorbent. Polymeric adsorbents produced by copolymerization of non-polar or weakly polar monomers demonstrate adsorption properties comparable to activated carbon.[33]
The surface area is a key quality parameter of the adsorbents. Engineered adsorbents are typically highly porous materials with surface areas in range between 102 and 103 m2/g. The porosity does part of internal surface constituted by the pores walls.[33]
The adsorbent characteristics, such as the surface area, functionality, porosity, broad distribution of particle size, impurities and internal porous structure influence the adsorption’s performance.[33]
Non-polar macroporous resins in food and pharmaceutical sectors are very viable since the regeneration of these adsorbents does not required high temperatures and they have low cost and limited existent toxicity.[34]
The Sepabeads SP700 is an aromatic, non-polar macroporous resin with great adsorption capacity for organic compounds, in particular for polyphenols.[11]
3.3 Adsorption equilibrium
To analyse the adsorption separation process is fundamental the study of the most appropriate adsorption equilibrium correlation, which allows a better understanding of the adsorption process.[35]
The adsorption equilibrium correlations allow to predict the adsorption parameters and the quantitative comparison of adsorbent behaviour for varied experimental conditions.[35]
The adsorption equilibrium is established when the adsorbate has been in contact with the adsorbent for a sufficient period of time at a constant temperature and pH. In this moment, the concentration of the adsorbate in the bulk solution creates a dynamic balance with the interface concentration.[35]
3.3.1 Adsorption equilibrium Isotherms
Adsorption equilibrium and fixed-bed adsorption of phenolic acids onto polymeric adsorbent
The different models to describe adsorption equilibrium isotherms have been formulated based in terms of kinetic and thermodynamics considerations.
Several adsorption equilibrium isotherms are presented in literature, such as, linear, Redlich-Peterson, Myers, Nitta, and BET isotherms, but the Langmuir Isotherm and Freundlich ones are the most commonly adsorption equilibrium isotherms used to describe the adsorption equilibrium for phenolic compounds.[37]
3.3.1.1 Langmuir isotherm
The Langmuir isotherm is based on reversible monolayer adsorption onto homogeneous surface, without interactions between adjacent adsorbed molecules.[38]
The maximum of adsorption occurs when the monolayer of surface adsorbent is saturated of molecules adsorbed and graphically it corresponds to a plateau where the concentration of solute in solution is constant with the time.[38]
Considering a liquid-solid adsorption, Langmuir model can be represented by the equation 2.[38] e L e L e C K 1 C K q q m Equation 2 Where, e
q – Amount of solute adsorbed per unit weight of adsorbent at equilibrium (g/g
adsorbent);
L
K - Langmuir constant, parameter which relates to the adsorption energy (L/g).
This equation can be rearranged in linear expressions, such as, for example, equations 3 and 4. e L e e C q 1 K q 1 q C m m Equation 3 m q 1 e C 1 L K m q 1 e q 1 Equation 4
The simple procedure to verify if the fit of Langmuir equation can be applied in experimental data consists plotting
e e q C versus C or e e q 1 versus e C 1 . A linear relation is
achieved and for example, it is possible to determine the m
q1 and qm KL 1
by the slope and the interception, respectively, considering for equation 3.[32]
3.3.1.2 Freundlich isotherm
The Freundlich model describes a reversible adsorption in an heterogeneous system, characterized by the heterogeneous factor (n). This model considers the formation of
equation 5.[32, 39] n 1 e F e K (C ) q Equation 5 Where, F
K - Freundlich constant, parameter which relates to the adsorption energy (g/g)/(L/g)1/n;
n
1 - Freundlich factor (dimensionless).
The
n
1 indicates if the adsorption is favourable and ranges from 0 and 1.[32, 39]
The Freundlich equation predicts a gradually increase of the amount of adsorbed solute per unit of adsorbent weight.
Rearranging the equation for its logarithmic form, the following equation is obtained.
)
(
n
1
)
(
)
(
q
eLn
K
FLn
C
eLn
Equation 6Plotting Ln(qe) versus
Ln
(
C
e)
, enables to be determine 𝐾𝐹 and 1 through the ninterception and the slope values, respectively.[32]
In figure 6, is possible analyse the behaviour difference between the Freundlich model and the Langmuir model.
Langmuir Isotherm Freundlich Isotherm
qe (g/g)
qe,o
Adsorption equilibrium and fixed-bed adsorption of phenolic acids onto polymeric adsorbent
3.3.2 Determination of adsorption equilibrium isotherms
The most commonly approach to determine the adsorption equilibrium isotherm parameters is the linear regression of adsorption equilibrium isotherms.
However, the linear method does not solve the errors in adsorption equilibrium isotherm parameters but it only solves linear forms of equation which measures the difference between experimental data and theoretical data in linear plots, and thus, it has the disadvantage of not providing the best isotherm constants to explain the experimental data obtained. Many studies conclude that the non-linear regression method is the best approach to obtain the isotherm parameters and also to select the best isotherm.[40]
The most common non-linear method is using the error function: the sum of the square of the errors (ERRSQ). This error function gives a best fit with the increasing of the errors, thus higher equilibrium concentrations studied have major contribution for parameters estimation.[36] 2 i ) means , e q p 1 i (qe,calc ERRSQ Equation 7 Where, calc , e
q – Theoretical adsorbed concentration in solid phase at equilibrium (g compound/g adsorbent);
means , e
q – Experimentally adsorbed concentration in solid phase at equilibrium (g compound/g adsorbent);
i – Number of experiments of 1 to p.
3.4 Kinetics and thermodynamics of adsorption processes
Adsorption kinetics adsorption describes the time-dependent evolution of the adsorption process until the equilibrium is reached.[32, 41]
The transport in adsorption process can be separated in mass transport and heat transport. The mass transport is divided in 4 stages:
1. Transport of the adsorptive from the fluid phase to the subsurface (built up around the adsorbent);
2. Transport through the subsurface (film diffusion);
3. Simultaneous transport into the pores of the adsorbent through diffusion along the inner surface (surface diffusion);
4. Interaction with the active sites of the adsorbent.
The heat transport is divided into energy transfer inside the adsorbent material and energy through the subsurface surrounding the resin particles.
of adsorption of the components in study. Change in Gibbs free energy, enthalpy and entropy are some of the important thermodynamic parameters that are usually calculated.[32, 41]
Arrhenius relationship can be used to determine the change of enthalpy (ΔH), Equation 8.[42] ΔH/RT
e
K
K
0
Equation 8 Where, 0K – Equilibrium constant (L/mg to calculate KL or (g/g)/(L/g)1/n to calculate KF);
R – Universal gas constant (8.314×10⁻³ kJ/mol.K);
T– Absolute temperature (K).
This parameter indicates that the adsorption has an exothermic (negative value) or endothermic nature (positive value). It can also differentiate between physical and chemical adsorption process. In a more detailed way, the type of interactions and the approximate values of energy associated are: van der Waals interactions (4–8 kJ/mol), hydrophobic interactions (4 kJ/mol), direct and induced ion–dipole and dipole–dipole interactions (2–29 kJ/mol), hydrogen bonding (2–40 kJ/mol), charge transfer, ligand-exchange and ion bonding (40 kJ/mol), and chemisorption (covalent bond) (60–80 kJ/mol). The physical sorption processes involve van der waals interactions, interactions between dipole (permanent or induced) moments of sorbate and sorbent molecules and hydrophobic interactions. Chemical interactions involve covalent bond and hydrogen bond.[43]
3.5 Techniques of adsorption
The applications of adsorbent technology and the industrial equipment are highly variable. The most used process and simple technology for adsorption is the batch and the fixed bed processes.[44]
In batch adsorption, a fixed amount of adsorbent is contacted with a defined volume of solution, with agitation, until the adsorption equilibrium. The concentration in solution will decrease with the time until the equilibrium, as described in figure 7.[32]
Adsorption equilibrium and fixed-bed adsorption of phenolic acids onto polymeric adsorbent
In fixed bed process, the adsorbent bed receives a feed of constant concentration. At beginning, the first layer of the bed, close to the feed, adsorbs the solute present in solution until equilibrium is reached with the incoming fluid. The outlet concentration increases until the equilibrium is reached in the overall bed. This is illustrated in figure 8, where it is represented the increasing of concentration with the time along the column.[45]
The plot of the effluent concentration in the bed with time corresponds to the breakthrough curve as depicted in figure 9.[45]
Figure 9. Concentration at column outlet [45]
Figure 8. Concentration profile at different time in the fixed bed [45]
Figure 7. Variation of concentration in solution with the time for batch adsorption
Concent ra ti on at o ut let ( g/ L) Time (min)
concentration of the solute at the outlet is equal or near to zero (C0, t0). After that time, the
outlet concentration starts growing, until equals the feed concentration (C, t). At this moment, the bed is saturated and can no longer adsorb solute.[45]
The principles and data obtained in batch systems can be used in modelling and designing continuous flow in fixed bed systems.[32]
The superficial velocity, u0 (m/s) can be calculated by the equation 9, which only
considers the flow rate and the column dimensions.[37]
A Q
u0 Equation 9
Where,
Q – Flow rate (mL/min);
A – Cross sectional area of the column (cm2).
The area is calculated by the form of the column in fixed bed, the most used is a cylinder area, equation 10.
2 4 dC
A
Equation 10 Where,dc - Diameter of fixed bed (cm).
Since the stream of mobile phase flows through of the spaces we can calculate the interstitial velocity, 𝑢𝑖 (mL/min), equation 11.[37]
c u i u 0 Equation 11 Where, c - Porosity of column.
The theoretical stoichiometric time, tst (min), can be obtained by the equation 12,
considering the interstitial velocity.[45]
f f c c i c stC
q
u
L
t
1
1
Equation 12Adsorption equilibrium and fixed-bed adsorption of phenolic acids onto polymeric adsorbent
f
q
– adsorption capacity of Cf (g/g dry adsorbent);The experimental stoichiometric time, tst,exp (min),during adsorption experiments can
be determined by the expression 13.[46]
dt
C
C
t
f st
0 exp ,1
Equation 13 Where,C – Concentration of solution in outline for time t (g/L).
The integral of the last equation is estimated applying the trapezium area for the plot 1-C/C0 vs time.
The experimental stoichiometric time is used to calculate the amount of compound adsorbed by the equations 14 and 15.[46]
- Adsorbed amount:
1
(
1
)
1
(
1
)
exp ,fh
C
fh
V
t
C
Q
q
p C f C p C st f ads
Equation 14 - Desorbed amount:
1
(1 ) (1 ) (1 ) 0 fh C fh V Q Cdt q p c f C p C t des
Equation 15 Where, p
- Apparent density of adsorbent (g wet adsorbent /L adsorbent);fh- Humidity factor of the adsorbent (water/wet adsorbent weight ratio);
V
- Column volume (mL).The theoretical values obtained by the adsorption equilibrium isotherm selected must to be close to the experimental values.
Adsorption equilibrium and fixed-bed adsorption of phenolic acids onto polymeric adsorbent
4 Technical description and procedures
4.1 Chemicals and adsorbent
The VA (97%) and SA (98%) were purchased from Aldrich Chemical Company, Inc.
The resin used as sorbent was Sepabeads SP700 (Mitsubishi Chemical Corporation). The main properties provided by the supplier and obtained by characterization at LSRE (Inês Mota) are summarized in Table 4.
Table 4. Main properties of the resin SP700
Supplier
information Experimental values*
Matrix Styrene-DVB
Solid Density - 1.294 (±0.001) g dry adsorbent/mLdry
adsorbent Apparent density 1.01 g/mL 0.3519 gdry /mLdry 0.3237 gdry/mLwet 1.012 gwet/mLwet Moisture content 60-70 % 68.2 %
Pore volume 2.3 mL/g 2.07 mL pores dry adsorbent/g dry adsorbent
2.25 mL pores wet adsorbent/gdry adsorbent
Particle size 450 m 483 m
Porosity 0.81 (average) 0.728
Specific surface area 1200 m2/g -
Average pore radius 90 Å -
![Figure 8. Concentration profile at different time in the fixed bed [45]](https://thumb-eu.123doks.com/thumbv2/123dok_br/18903977.935633/41.892.232.692.535.745/figure-concentration-profile-different-time-fixed-bed.webp)


![Adsorption in a Fixed-Bed Column and Stability of the Antibiotic Oxytetracycline Supported on Zn(II)-[2-Methylimidazolate] Frameworks in Aqueous Media.](data:image/gif;base64,R0lGODlhAQABAIAAAP///wAAACH5BAEAAAAALAAAAAABAAEAAAICRAEAOw==)