Braganc;:a, 2012 16-19 Setembro
Chemical characterization and bioactivity of the most widely appreciated
cultivated mushrooms: studies in fruiting bodies and mycelia
Filipa S. Reisa,b, Lillian Barrosa,b, Anabela Martinsb, Isabel C.F.R. Ferreiraa,b*
a
CIMO-ESA, Instituto Politécnico de Bragança, Bragança, Portugal
b
Escola Superior Agrária, Instituto Politécnico de Bragança, Bragança, Portugal
Keywords: cultivated mushrooms; nutritional value; mycelium; bioactive properties
ABSTRACT
Mushrooms are part of the human diet for thousands of years, and their consumption increased greatly in recent times. One of the main reasons for this increase is the combination of their nutritional value as well as for their medicinal and nutraceutical properties. The present work reports a comparative study of highly consumed fresh cultivated mushroom
species worldwide: Agaricus bisporus (white and brown), Pleurotus ostreatus (oyster
mushroom), Pleurotus eryngii (king oyster mushroom) and Lentinula edodes (shiitake). It was
assessed the nutritional value and chemical composition of the mushrooms, and their mycelia
were produced by in vitro culture to make a comparative analysis of the antioxidant activity
and phenolic profile of fruiting bodies and the corresponding mycelium. L. edodes (shiitake)
revealed the highest levels of macronutrients, unless proteins, as also the highest sugars, tocopherols and polyunsaturated fatty acids (PUFA) levels, and the lowest saturated fatty
acids (SFA) content. Although phenolic compounds and derivatives investigated have been
found in both fruiting bodies and mycelia, generally the species in vivo showed a higher
antioxidant potential than the mycelium obtained by in vitro culture.
1. INTRODUCTION
Mushrooms are widely consumed for their great nutritional value [1,2] being also known for their nutraceutical and medicinal properties [3,4]. Thus, they might be used directly in human diet and promote health, taking advantage of the additive and synergistic effects of all the bioactive compounds present [3], including compounds reported as enhancers of their medicinal properties, such as phenolic compounds [3,4]. The production and consumption of mushrooms continuously increases over the time, being China the biggest producer [5]. The
most cultivated mushroom worldwide is Agaricus bisporus, followed by Lentinula edodes,
2. MATERIALS E METHODS
2.1. Samples
The mushroom samples were obtained in local supermarkets (Bragança, Northeastern Portugal) in March and April 2011. From each package, 2-3 samples of mushrooms were
selected for in vitro culture. All the samples (fruiting bodies and mycelia) were lyophilized,
reduced to a fine powder (20 mesh) and mixed to obtain homogenate samples for further analysis [6,7].
2.2. Nutritional value
The samples were analysed for chemical composition (moisture, proteins, fat, carbohydrates and ash) using official procedures.
2.3. Sugars, fatty acids and tocopherols composition
Free sugars were determined by HPLC coupled to a refraction index detector (RI). Fatty acids were determined after a transesterification process and the profile was analyzed by gas-liquid chromatography with flame ionization detection (GC-FID). Tocopherols composition was determined by HPLC-fluorescence [6].
2.4. Antioxidant activity
The samples (1.5 g for mushrooms and 0.5 g for mycelia) were dissolved in methanol (final concentration 20 mg/mL). Successive dilutions were made from the stock solution to realize
the assays. The results were expressed in EC50 values (the sample concentrations providing
50% of antioxidant activity or 0.5 of absorbance for the Ferricyanide/Prussian blue assay). Trolox was used as standard [7].
The reducing power of the samples was evaluated by Folin-Ciocalteu assay (mg of gallic acid
equivalents (GAE) per g of extract) and Ferricyanide/Prussian blue assay. The radical scavenging activity was determined through the DPPH radical-scavenging activity assay and the lipid peroxidation inhibition was determined by the β-carotene/linoleate assay [7].
2.5. Phenolic acids composition
The phenolics acids were determined by ultra fast liquid cromatography (UFLC), and the results were expressed in µg per g of dry weight (dw) [7].
2.6. Statistical analysis
For each one of the mushroom species (fruiting bodies and mycelia) three samples were used and all the assays were carried out in triplicate. The results were expressed as mean values and standard deviation (SD). The results were analyzed using one-way analysis of variance
(ANOVA) followed by Tukey’s HSD Test with α = 0.05. This analysis was carried out using
3. RESULTS AND DISCUSSION
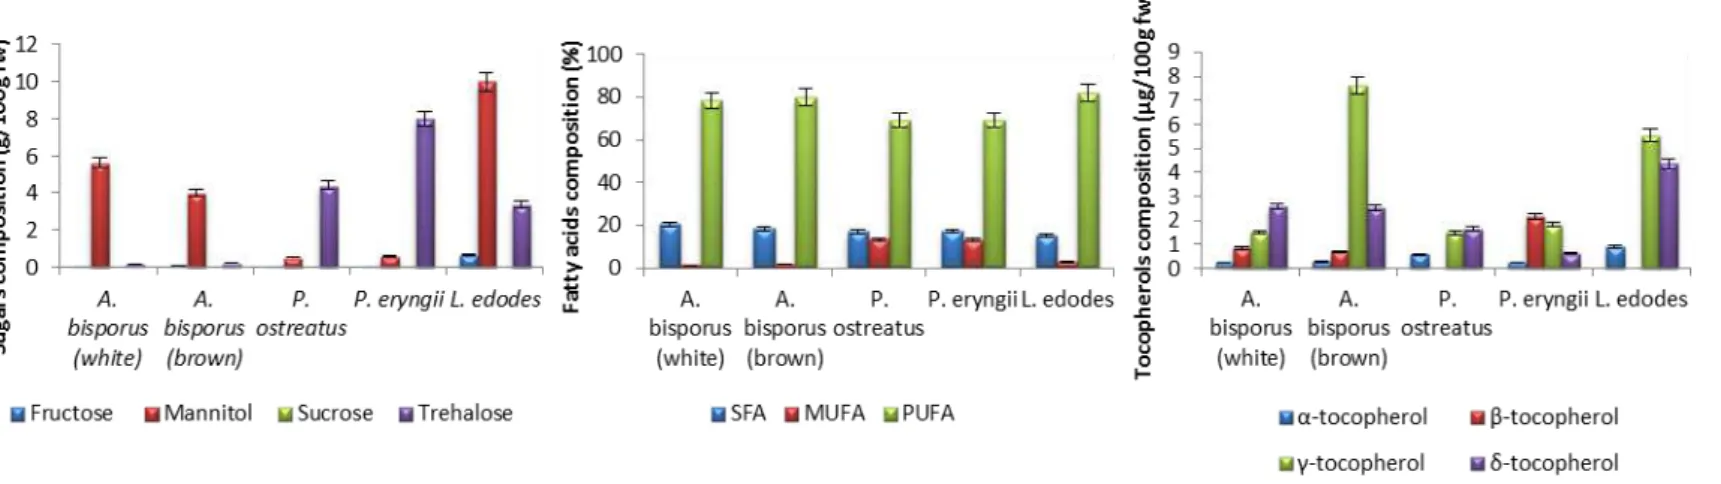
Lentinula edodes (shiitake) revealed the highest levels of macronutrients, unless proteins (Table 1), as also the highest sugars, tocopherols and polyunsaturated fatty acids (PUFA) levels, and the lowest saturated fatty acids (SFA) (Figure 1).
Table 1. Nutritional value of the studied edible mushrooms (mean ± SD). In each row, different letters mean significant differences between species (p<0.05).
fw – fresh weight
Figure 1. Sugars, fatty acids and tocopherols composition of the studied edible mushrooms (mean ± SD).
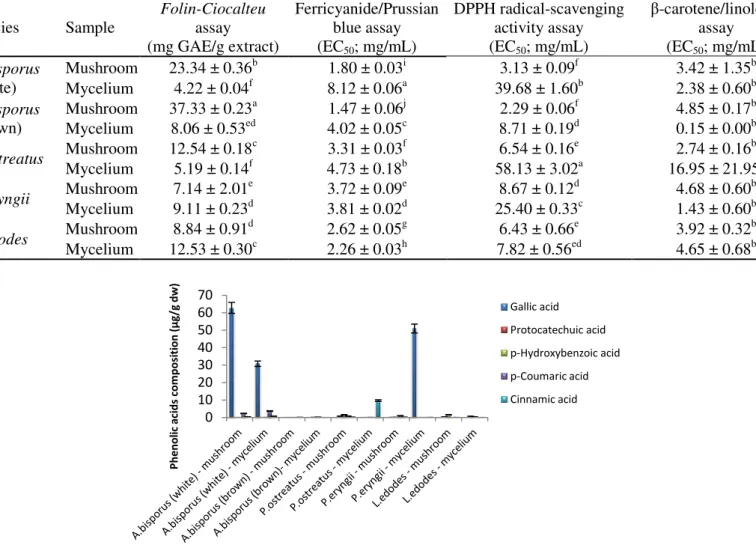
Comparing the commercial mushrooms with the mycelia obtained by in vitro culture (Table
2), we verify that, generally, the latter revealed lower antioxidant potential (higher EC50
values). The species that demonstrate the highest content in phenolic acids and related
compounds was A. bisporus (white) (Figure 2).
A. bisporus (white)
A. bisporus
(brown) P. ostreatus P. eryngii L. edodes
Moisture (g/100 g fw) 91.27± 0.45ba 91.64 ± 0.99a 89.17 ± 2.12ba 89.00 ± 1.39ba 79.78 ± 1.31c
Ash (g/100 g fw) 0.85 ± 0.17cb 0.95 ± 0.02b 0.62 ± 0.08d 0.68 ± 0.06dc 1.36 ± 0.05a
Proteins (g/100 g fw) 1.06 ± 0.02a 1.10 ± 0.03a 0.65 ± 0.05b 1.04 ± 0.02a 0.76 ± 0.08b
Fat (g/100 g fw) 0.19 ± 0.03cb 0.14 ± 0.02d 0.15 ± 0.02dc 0.16 ± 0.03dcb 0.35 ± 0.02a
0 10 20 30 40 50 60 70 P h e n o li c a ci d s co m p o si ti o n (µ g /g d w) Gallic acid Protocatechuic acid p-Hydroxybenzoic acid p-Coumaric acid Cinnamic acid
Table 2. Antioxidant activity of the studied edible mushrooms (mean ± SD). In each row, different letters mean significant differences between species (p<0.05).
Figure 2. Phenolic acids composition and related compounds of the studied edible mushrooms (mean
± SD).
Acknowledgements
FCT and COMPETE/QREN/EU for project PTDC/AGR-ALI/110062/2009, strategic project to CIMO (PEst-OE/AGR/UI0690/2011) and BPD/4609/2008 grant to L. Barros.
References
[1] SA Heleno, L Barros, MJ Sousa, A Martins, ICFR Ferreira, Food Chem, 2010, 119, 1443-1450. [2] P Mattila, K Könkö, M Eurola, JM Pihlava, J Astola, L Vahteristo, V Hietaniemi, J. Kumpulainen, M Valtonen, V Piironen, J Agric Food Chem, 49, 2343-2348.
[3] ICFR Ferreira, L Barros, RMV Abreu, Cur Med Chem, 2009, 16, 1543-1560.
[4] JA Vaz, L Barros, A Martins, JS Morais, MH Vasconcelos, ICFR Ferreira, LWT-Food Sci Technol, 2011, 44, 343-346.
[5] FMNA Aida, M Shuhaimi, M Yazid, AG Maaruf, Trends Food Sci Tech, 2009, 20, 567-575. [6] FS Reis, L Barros, A Martins, ICFR Ferreira, Food and Chem Toxicol, 2012, 50, 191-197. [7] FS Reis, A Martins, L Barros, ICFR Ferreira, Food and Chem Toxicol, 2012, 50, 1201-1207.
Species Sample
Folin-Ciocalteu assay (mg GAE/g extract)
Ferricyanide/Prussian blue assay (EC50; mg/mL)
DPPH radical-scavenging activity assay (EC50; mg/mL)
β-carotene/linoleate assay (EC50; mg/mL)
A.bisporus (white)
Mushroom 23.34 ± 0.36b 1.80 ± 0.03i 3.13 ± 0.09f 3.42 ± 1.35b
Mycelium 4.22 ± 0.04f 8.12 ± 0.06a 39.68 ± 1.60b 2.38 ± 0.60b
A.bisporus (brown)
Mushroom 37.33 ± 0.23a 1.47 ± 0.06j 2.29 ± 0.06f 4.85 ± 0.17b
Mycelium 8.06 ± 0.53ed 4.02 ± 0.05c 8.71 ± 0.19d 0.15 ± 0.00b
P.ostreatus Mushroom 12.54 ± 0.18
c
3.31 ± 0.03f 6.54 ± 0.16e 2.74 ± 0.16b
Mycelium 5.19 ± 0.14f 4.73 ± 0.18b 58.13 ± 3.02a 16.95 ± 21.95a
P.eryngii Mushroom 7.14 ± 2.01
e
3.72 ± 0.09e 8.67 ± 0.12d 4.68 ± 0.60b
Mycelium 9.11 ± 0.23d 3.81 ± 0.02d 25.40 ± 0.33c 1.43 ± 0.60b
L.edodes Mushroom 8.84 ± 0.91
d
2.62 ± 0.05g 6.43 ± 0.66e 3.92 ± 0.32b