Contents lists available atScienceDirect
Global Food Security
journal homepage:www.elsevier.com/locate/gfs
Measures to increase the nitrogen use efficiency of European agricultural
production
Nicholas J. Hutchings
a, Peter Sørensen
a, Cláudia M.d.S. Cordovil
c, Adrian Leip
d,
Barbara Amon
b,e,∗aDept. of Agroecology, Aarhus University, Blichers Allé 20, DK-8830 Tjele, Denmark
bLeibniz Institute for Agricultural Engineering and Bioeconomy (ATB), Max-Eyth-Allee 100, 14469 Potsdam, Germany cUniversity of Lisbon, School of Agriculture, Forest Research Centre CEF, Tapada da Ajuda, 1349-017 Lisbon, Portugal dEuropean Commission, Joint Research Centre (JRC), Ispra, Italy
eUniversity of Zielona Góra, Faculty of Civil Engineering, Architecture and Environmental Engineering, Licealna 9/9, 65-417 Zielona Góra, Poland
A R T I C L E I N F O Keywords:
Nitrogen use efficiency Fertilization Arable agriculture Cattle production systems Pig production systems
A B S T R A C T
Inputs of nitrogen to agricultural production systems are necessary to produce food, feed and fibre, but nitrogen (N) losses from those systems represent a waste of a resource and a threat to both the environment and human health. The nitrogen use efficiency (NUE) of an agricultural production system can be seen as an indicator of the balance between benefits and costs of primary food, feed and fibre production. Here, we used modelling to follow the fate of the virgin N input to different production systems (ruminant and granivore meat, dairy, arable), and to estimate their NUE at the system scale. We defined two ruminant meat production systems, depending on whether the land places constraints on farming practices. The other production systems were dairy, granivore and arable production on land without constraints. Two geographic regions were considered: Northern and Southern Europe. Measures to improve NUE were identified and allocated to Low, Medium and High ambition groups, with Low equating to the current situation in Europe for production systems that are broadly following good agricultural practice.
The NUE of the production systems was similar to or higher in Southern than Northern Europe, with the maximum technical NUEs if all available measures are implemented were for North and South Europe, re-spectively, 82% and 92% for arable systems, 71% and 80% for granivores, 50% and 36% for ruminant meat production on constrained land, 53% and 55% for dairy production on unconstrained land and 46% and 62% for ruminant meat production on unconstrained land. The values for NUE found here tend to be higher than re-ported elsewhere, possibly due to the accounting for long-term residual effects of fertiliser and manure in our method. The greatest increase in NUE with the progressive implementation of higher ambition measures was in unconstrained granivore systems and the least was in constrained ruminant meat systems, reflecting the lower initial NUE of granivore systems and the larger number of measures applicable to confined livestock systems.
Our work supports use of NUE as an indicator of the temporal trend in the costs and benefits of existing agricultural production systems, but highlights problems associated with its use as a sustainability criteria for livestock production systems.
For arable systems, we consider well-founded the NUE value of 90% above which there is a high risk of soil N depletion, provided many measures to increase NUE are employed. For systems employing fewer measures, we suggest a value of 70% would be more appropriate.
We conclude that while it is feasible to calculate the NUE of livestock production systems, the additional complexity required reduces its value as an indicator for benchmarking sustainability in practical agriculture.
1. Introduction
Nitrogen (N) inputs to agricultural systems are essential for food production but losses of N create environmental problems
(Sutton et al., 2011;Erisman et al., 2008). Ammonia (NH3) emissions,
which arise predominantly from agriculture, play a role in secondary particulate matter formation (Erisman and Schaap, 2004), which con-tributes to the larger threat to human health from atmospheric
https://doi.org/10.1016/j.gfs.2020.100381
Received 29 May 2019; Received in revised form 28 March 2020; Accepted 10 May 2020
∗Corresponding author. Leibniz Institute for Agricultural Engineering and Bioeconomy (ATB), Max-Eyth-Allee 100, 14469 Potsdam, Germany.
E-mail address:[email protected](B. Amon).
2211-9124/ © 2020 The Authors. Published by Elsevier B.V. This is an open access article under the CC BY-NC-ND license (http://creativecommons.org/licenses/BY-NC-ND/4.0/).
pollution (Schraufnagel et al., 2019). Nitrate (NO3−) pollution
con-tributes to environmental degradation and threatens human health, if it contaminates drinking water supplies (Schullehner et al., 2018). Live-stock production in particular has a large environmental footprint (Leip et al., 2015).
The nitrogen use efficiency (NUE) has been proposed as useful in-dicator of the environmental performance of production systems (Oenema et al., 2015) or its economically efficient use of inputs (Powell et al., 2010). The definition of the NUE of an agricultural production system varies globally (Powell, 2015). The boundaries of a production system may vary from the physical boundaries of a farm to the combination of primary production, food processing and retail (Uwizeye et al., 2016;Baldini et al., 2017;Erisman et al., 2018). Even for primary production, the issue of system boundaries can be proble-matic when considering livestock production (Oenema et al., 2015).
Measures that impact NUE are implemented for mainly two reasons; to increase production or reduce losses. Situations where the primary objective is increasing production mainly relate to a commercial benefit from more efficient use of N fertiliser whereas those where the primary objective is reducing losses mainly relate to a regulatory compliance associated with manure management with the aim to reduce environ-mental burdens. An assessment of the likely impact of measures that would increase NUE of agricultural production can be undertaken with varying focus. Oenema et al. (2009) used a geographic focus (the European Union) when assessing the effect of such measures. Here, we take an alternative view, focussing on the type of production: arable, granivore (pig, poultry), ruminant meat (beef, lamb, goat) and dairy. Our aim is to assess the technical potential to improve the NUE of these systems and to consider the role of NUE as an indicator.
2. Material and methods - model development
We developed a model that uses the concept of an agricultural production system which for arable production consists only of the land on which the crop is grown but for livestock production includes ani-mals, the associated manure management system (housing, manure storage) and the land that produces the feed necessary for the animal production, including that which is imported from arable production systems.
The availability of data concerning the current (2019) agricultural practices related to N use varies across Europe but are usually limited and are frequently absent. To make progress, we have therefore relied on our own judgement, based on our experience in the development of (Leip et al., 2014; UNECE, 2014;Winiwarter et al., 2014;Leip et al., 2015;European Environment Agency, 2016).
2.1. Classification of animal production systems
There is a wide variety of agricultural production systems in Europe and it is not feasible to explicitly simulate the N flows in all of them. The approach used here is to divide production systems into categories that differ with respect to their NUEs and the technical measures that can be applied to increase those NUEs. The first division is between systems regarding their output (crop products, animal products). Here we defined a single arable production system that encompasses all crop products, including those destined for use as animal feed and those consumed directly by humans. We assumed that this arable system requires a productive soil (adequate pH, soil depth and drainage) and the ability to use farm machinery (not too steeply sloped). We described this soil as being unconstrained, as its chemical and physical char-acteristics do not seriously constrain the type of crop production pos-sible. Within the systems producing animal products, we made a further division between those that produce food products from ruminant li-vestock (cattle, sheep, goats) and those that use non-ruminant lili-vestock such as pigs and poultry, i.e. granivores (since they are predominantly fed grain). We assumed that the granivore systems are predominantly
located on unconstrained soils, since they need to own or be close to land that can be used to utilise the manure produced. Within the ru-minant production systems, we separately identified those that produce meat and those that produce milk. For the latter, we assumed that the bulk of milk production occurs in production systems located on un-constrained soils, and the dairy cow diets contain grazed grass, grass silage, hay, maize silage and home grown concentrates. Ruminant meat production systems are common in mountain, upland and marshland areas, so are based on land where soil characteristics or slope limit agricultural activities. We describe these production systems as being on constrained land. However, ruminant meat production systems have a significant presence on unconstrained land, where diets have a composition similar to those of dairy cattle. As a consequence, we se-parately identified two ruminant meat production systems, one on constrained and the other on unconstrained land. The categories used are therefore ruminant meat production on constrained soil (RM-C), ruminant meat production on unconstrained soil (RM-U), dairy pro-duction on unconstrained soil (D-U), granivore propro-duction on un-constrained soil (G-U) and arable crop production on unun-constrained soil (A-U). The extent to which our assumptions concerning the link be-tween production and land use are supported by European data is considered in Supplementary Material C.
Most livestock production systems import some animal feed, either from other European production systems or from outside Europe. To internalise the losses of N to the environment, imported feed is assumed to be wholly sourced from the arable production system (A-U) that is within the region concerned (i.e. N or S Europe). This allows the N flows associated with the production of the imported feed to be taken into account when calculating the system NUE. An issue for dairy production systems is that they usually produce beef as a by-product. Beef production can occur in three ways. The first is dedicated beef production, based on suckler cows; this we equate with system RM-C. The second is as surplus male calves from dairy production that are raised for beef production or culled dairy cows; these we equate with RM-U. The dairy production system (D-U) then describes just lactating dairy cattle.
Since we recognize that the characteristics of climate and soil sig-nificantly influence the N flows, we divide Europe into North and South, with the boundary defined roughly by the mountains of the Pyrenees, Alps and Carpathians.
2.2. Model structure
The NUE of the production system is defined here as the N in the product divided by the input of plant-available N from outside the agricultural system (virgin N) that is necessary to produce that product. Virgin N could be in the form of synthetic N fertiliser, N deposition from the atmosphere or via N fixation but will predominantly be as fertiliser (Supplementary Material C). The manure and crop residue N flow streams represent the extent to which virgin N input is recycled.
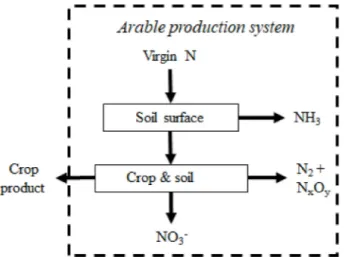
The arable production system has one stream, driven by virgin N. Nitrogen is lost via ammonia (NH3) volatilisation, gaseous emissions of
dinitrogen and oxides of N, and by nitrate (NO3−) leaching. Crop
products are here envisaged as grain that is exported for processing into food for human consumption (Fig. 1). The virgin N necessary to pro-duce a unit mass of N in the arable product is the reciprocal of the NUE of the arable system (NUEarable_crop).
In contrast, the livestock production system contains two feed pro-duction streams, one driven by manure N and one by virgin N (Fig. 2). Here, the arable production is seen as a remote subsystem, exporting feed for livestock consumption. The livestock production subsystem includes the local production of crop products for livestock consump-tion, additional N losses from the manure management system and the export of livestock products for processing into food for human con-sumption.
follows. The amount of feed N necessary to create a unit (kg) of animal product N (Nfeed; kg) is calculated from the reciprocal of the NUE at the
scale of the animal (NUElive; kg animal N (kg feed N)−1). A proportion
of that feed N is exported as animal product and the remainder passes through the manure management system, from which there are gaseous N losses. The remaining N is applied to the soil and used to produce an
amount of feed N (Nfeed_man; kg). This contributes a proportion ψ of the
feed N: = N N _ feed man feed (1.1)
A proportion of Nfeedis imported from the external, arable system
(ρ); this is a parameter, defined separately for each livestock production system. The remaining proportion of the feed N (1-(ρ+ψ)) must be supplied by the input of virgin N to soil within the livestock production system. The input of virgin N to the soil in the livestock systems ne-cessary to generate a unit mass of feed N is determined by the crop NUE of the livestock system (NUElive_crop). The NUE of the whole production
system is then: =
+ +
NUE _ NUE
_ _
live prod live
NUE NUE
(1 ( ))
arable crop live crop (1.2)
NUEliveis a parameter that varies according to the type of
produc-tion (milk versus meat) and for meat, between ruminant and granivore production. The values of Nfeed_man, NUEarable_crop, NUElive_cropare
si-mulated using a model of both the C and N flows in the manure man-agement system and the field. We assume that straw is incorporated into the soil. We use the most complete method to assess NUE (TRIO, as defined byWatson and Atkinson, 1999), including the estimation of the long-term fate of N in crop residues and manure. This means that there is no net change in the stock of N in the soil and that we include N lost via denitrification in soil. We do not include denitrification losses from manure management systems, as although some are of environmental Fig. 1. Nitrogen flows in the arable production system. Virgin N is applied to
the soil, from which over a number of years, there are gaseous losses (NH3, N2,
N2Oy), NO3−leaching and removal in the harvested crop.
Fig. 2. Nitrogen flows in the livestock production system. This contains two subsystems. The livestock subsystem contains two feed streams, one driven by manure N and one by virgin N, with both located on the same type of land (constrained or unconstrained). The arable subsystem only has one stream, driven by virgin N and on unconstrained land. A proportion ψ of the feed N is supplied from within the livestock subsystem, using manure, and a proportion ρ is imported from the arable production system. The remainder (1-(ψ+ ρ)) is produced within the livestock subsystem, using virgin N.
significance, they are small in terms of mass lost. A detailed description of the modelling of the production systems is given in Supplementary Material A, B and C, with the Excel models in Supplementary Material D and E.
2.3. Selection and implementation of measures
The measures implemented were selected with reference in parti-cular to UNECE (2014)for measures to reduce NH3 emission and to
DCA et al. (2014)for measures to reduce NO3−leaching, and using the
expert knowledge of the authors. For NO3− leaching, only measures
that retain N within the agricultural system were considered. The in-dividual measures themselves also encompass a range of generic tech-nologies, since the technologies can be numerous (e.g. seeCrowe et al., 2018;Nguyen and Kant, 2018). Although many of the measures con-sidered here that are related to manure management are applicable to all the livestock systems, a number are only relevant to liquid manure, so this work is most relevant to such systems.
Measures were categorized into groups that represent Low, Medium and High ambition for increasing NUE. Low ambition measures are those that were considered readily implemented and at low cost. This equates to the current situation in Europe for production systems that are broadly following good agricultural practice. The High ambition measures are intended to represent situations where there is a will-ingness (or legal obligation) to reduce N losses. The measures im-plemented are considered to be practical (i.e. have been imim-plemented in practice in at least one country) but would generally be considered costly.Table 1shows the measures and their effect. The equations(s), the parameter value(s), and their documentation are shown inTable 2 of Supplementary material C.
When implementing measures for livestock production systems, we
have assumed that the arable system supplying imported feed will implement measures at the same ambition level e.g. the feed imported to a dairy production system on unconstrained land implementing Medium ambition measures will be sourced from an arable production system that also implements Medium ambition measures.
3. Results
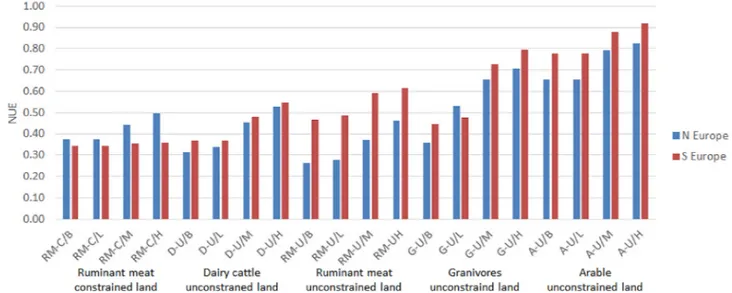
The NUE efficiencies of the production are shown inFig. 3. The NUE for the Low ambition was similar or equal to that for the Base (no measures) in all cases except granivores in Southern Europe. In Northern Europe, the NUE for the Low ambition measures decreased in the order A-U > G-U > RM-C > D-U > RM-U, whereas for Southern Europe, the order was AU > U > G-U > D-U > RM-C. The NUE was similar or higher in Southern Europe than Northern Europe for all production systems, with the greatest difference for the Ruminant meat (U). The differences between Northern and Southern Europe were greatest for the Low ambition measures and decreased slightly with the progressive implementation of higher ambition mea-sures. In both regions, the greatest increase in NUE with the progressive implementation of higher ambition measures was in the Granivore system and the least was in Ruminant meat (C).
The fate of a single unit of virgin N input is shown inFig. 4. With the Base ambition measures, NO3− leaching, denitrification and NH3
emission account for similar proportions of the losses in the Dairy, Ruminant meat (RM-U) and Granivore (G-U) systems in Northern Europe. In the Ruminant meat (RM-C), denitrification accounts for the largest proportion and NH3emissions were low in the Arable system. In
Southern Europe, NH3emissions accounted for the largest proportion of
losses, except for the RM-C and A-U systems, where denitrification ac-counts for the largest proportion. The implementation of more Table 1
Measures to increase NUE. Measures are allocated to Low (L), Medium (M) and High (H) ambition groups for each production system. A measure can be allocated to an ambition group in Northern Europe (N), Southern Europe (S) or in both regions (B). Shading indicates where a measure is not applicable to the production system. Key: RM-C = ruminant meat, constrained land, D-U = dairy, unconstrained land, RM-U = ruminant meat, unconstrained land, G-U = = granivore, unconstrained land, A-U = arable, unconstrained land.
Production system types
RM-C D-U RM-U G-U A-U Notes
Ambition level L M H L M H L M H L M H L M H
Fields
Nitrification inhibitors B B B B Reduces denitrification and nitrate leaching Exchange urea-based fertiliser with
non-urea based B B B B B B B B Reduces ammonia emission
Rapid incorporation of N fertiliser B B B B Reduces ammonia emission Rapid incorporation of manure B B B B B B Reduces ammonia emission
Injection of slurry B B N B B B Reduces ammonia emission
Trailing hose or trailing shoe slurry
application N B N B N B B B Reduces ammonia emission Reduces N application in excess of cropuptake ability Tank or field acidification of manure B B B Reduces ammonia emission
Urease inhibitors B B B B Reduces ammonia emission
Precision fertiliser application B B B B B B B B Reduces N application in excess of crop uptake ability
Conservation agriculture S S S Reduced nitrate leaching Reduced compaction and better water and nutrients holding capacity
Arable crops only
Cover cropping B B B B B B B B Reduced nitrate leaching
Ban on tillage in autumn and winter B B B B B B B B Reduced nitrate leaching
Livestock farms
Precision formulation of ruminant diet B B B Reduce N surplus in diet, reducing total N and TAN excreted Precision formulation of granivore diets N B B Reduce N surplus in diet, reducing total N and TAN excreted Acidification of slurry in animal housing B B B Reduces ammonia emission
Scrubbing of ventilation air B Captures ammonia emitted and returns N to manure storage Granivore low ammonia emission housing B Reduces ammonia emission
Ruminant low ammonia emission housing B B Reduces ammonia emission
Slurry separation B B B Reduces ammonia emission
Covering storage B B B Reduces ammonia emission
Anaerobic digestion B B B Increases the TAN content and reduces the organic N content, thereby increasing first-year crop N uptake
Fig. 3. The NUE for the production systems in N and S Europe, for Ruminant meat production on constrained land (RM-C), Dairy production on unconstrained land (D–U), Ruminant meat production on unconstrained land (RM-U), Granivore production on unconstrained land (G–U) and Arable crop production on unconstrained land (A–U), for ambition levels Base (/B), Low (L), Medium (M) and High (H).
Fig. 4. The fate of a single unit of virgin N input, N and S Europe, for Ruminant meat production on constrained land (RM-C), Ruminant meat production on unconstrained land (RM-U), Dairy production on unconstrained land (D–U), Granivore production on unconstrained land (G–U) and Arable crop production on unconstrained land (A–U), for ambition levels Base (/B), Low (L), Medium (M) and High (H).
ambitious measures reduced both the NH3 and the NO3− leaching
losses but had little effect on losses via denitrification. 3.1. Sensitivity analysis
The results of the sensitivity analysis are in the Excel file in Supplementary material D. The parameters for which a change of ± 10% resulted in changes in production system NUE of > 1% were the NUE of the livestock, the leaching adjustment factor, the deni-trification rate (including the partitioning between growing and non-growing season rates), the NH3emission factor for granivore housing
and the NH3emission factor for cattle manure storage. The measures
for which a change of ± 10% resulted in changes in production system NUE of > 1% were precision feeding of cattle and granivores.
The values of NUE were sensitive to the length of the soil model simulation period. Expressed as a percentage of the value after 100 years and averaged across all production systems, the values for NUE for simulation periods of 1, 2, 5 and 10 years were 51%, 77%, 97% and 99% for N Europe and 62%, 88%, 99% and 100% for S Europe (see Supplementary Material F). The greater sensitivity in Northern versus Southern Europe can be explained by the effect of the lower rate of soil organic matter decomposition due to the lower temperature (see Supplementary Material C).
4. Discussion
4.1. Interpreting the changes in Nitrogen Use Efficiency
The NUE for all livestock production systems was lower than for the arable production system, at the same level of ambition of measures (Fig. 3). This is due to higher NO3−leaching losses and emissions of
NH3(Fig. 4). The higher NUE achieved with the Low ambition measures
on the Ruminant meat production on constrained land (RM-U) com-pared to the other livestock systems in N Europe was for two reasons. Firstly, these livestock are assumed to be grazing for a large proportion of the year and the NH3emissions associated with excreta deposited
during grazing are less than those that occur when excreta must pass through the manure management system. The second reason is that feed production in this system is assumed to be solely based on per-manent grassland and the NUE of perper-manent grassland is often high (Cardenas et al., 2019), compared to production systems in which some or all the land is cultivated with a new crop each year, reducing crop N uptake capacity.
There were differences between Northern and Southern Europe for a large number of the parameters determining losses of N. These include the mineralisation of organic N in manure storage, the proportion of manure C in the humic form, the NH3emission factors for field-applied
manure and fertiliser, and the mineralisation rate of organic matter in the soil, all of which were higher in Southern Europe (see Supplementary material C). In contrast, the leaching factors for Southern Europe were lower than in the North. The differences in NUE in the two regions in each of the production systems represent the balance of the effect of these differences and these differ between production systems. The ruminant meat production on unconstrained land (RM-U) are similar in both Northern and Southern Europe (ex-tensive, grazed grassland), so the N losses and NUEs are comparable (Fig. 4). The NUE of the ruminant meat production on constrained land (RM-C) in Southern Europe was higher than in the north because in the former, the grazing season was longer (lower NH3emissions) and
be-cause the climate was drier (lower NO3−leaching). In other production
systems, similarities in NUE between Northern and Southern Europe disguise large, counteracting differences in individual losses. For ex-ample, in the dairy production system on unconstrained land (D-U), the NO3−leaching was higher in the North than in the South but the NH3
emissions are lower (Fig. 4).
The increase in NUE with increasing level of ambition was least for
ruminant meat production on constrained land (RM-C) and greatest for granivore production (G-U). The small increase for RM-C is due to the extensive use of grazing in this system. As noted earlier, this leads to a relatively high NUE (compared to other livestock systems), even in the Base ambition case. In addition, many of the measures are only ap-plicable to the manure management system or cultivated land, both of which play a minor role in N flows compared to other production systems. In contrast, in G-U, the livestock are housed year-round, with a large flow of N through the manure management system that is sus-ceptible to NH3emission, and are on land that does not restrict the use
of machinery. This means that a wider range of measures are available to reduce these losses, hence the large increase in NUE with increasing ambition.
4.2. Comparison with measured values
When comparing the results obtained in the current study with those of earlier ones, it is important to ensure that the system bound-aries are equivalent and are equally based on a ‘land N budget’ (Leip et al., 2011) as in the current study. Even within the land system boundaries, direct comparison should only be made with the results of studies that account for soil processes until zero soil N stock changes. The values for the NUE of livestock production systems are much lower if the study does not take into account the extent to which excretal N is recycled through increased crop production.
Studies of the NUE of whole production systems have focussed on dairy production. For dairy production systems,de Klein et al. (2017) found a range of 19–36% for farm scale NUE for New Zealand and literature values to support a range of about 20–40%. However, the NUE values found byde Klein et al. (2017)were reduced when the land dedicated to feed productions was included. The range found in Aus-tralia and USA by Gourley et al. (2012) was wider still (15–35%) whereasBuckley et al. (2016)found a narrower range of 21–24% in Ireland. Estimates of NUE tend to be higher where the soil processes are taken fully into account (Powell and Rotz, 2015,FAO, 2018). Note, however, that imported feed was considered a system input inPowell and Rotz (2015). For other production systems,Joensuu et al. (2018) found the NUE of the agricultural part of a beef production system in Finland to be about 50%, which is higher than for the equivalent sys-tems here (RM-C, RM-U).
Another issue when comparing our results to the NUE of dairy production systems is whether the value reported is for the dairy cattle alone (as here) or includes replacement livestock. In the current study, the RM-U system can be considered equivalent to a system to replace dairy cows. The balance between the NUE values of the two systems (RM-U and D-U) depends on the replacement rate assumed. However, in this study, the NUE values for these two systems are similar, so the combined NUE for a system of dairy cows and replacement animals would not be very sensitive to this parameter.
4.3. Scope for increasing NUE
The results of this study suggest that there is scope for significant increases in the NUE of some production systems, with more modest increases in others. The increases of NUE in the system dominated by grazed grassland (RM-C) are limited, in-line with the results fromde Klein et al. (2017). The predominance of grazing in RM-C means that N losses associated with manure management are lower than in other li-vestock systems and the presence of a perennial crop with a high N uptake capacity means that the NUE in the field is also high. This means that in the Base or Low ambition scenarios, the NUE is higher than for other livestock systems. However, the emphasis on grazing also means that there are few applicable measures for increasing NUE further. In contrast and as found byMillet et al. (2018), the greatest increases are for livestock systems in which the animals are confined to livestock housing, thus allowing their diets to be optimised and NH3emissions to
be reduced by technical measures. In this context, the role of organic farming is interesting. Some organic standards will tend to reduce NUE, relative to conventional production, such as the requirement to allow housed livestock access to larger exercise areas (increased NH3
emis-sion), and restrictions on the implementation of certain measures to increase livestock NUE, such as a ban on the use of synthetic amino acids to provide a more balanced protein content of pig feed rations. Conversely, the requirement for ruminant livestock to be grazed for a substantial proportion of the year is likely to increase the NUE of ru-minant organic systems compared to the conventional systems.
The extent to which the technical scope for increasing NUE identi-fied here is achievable in practice depends on a wide range of socio-economic barriers to progress; a situation analogous to that of reducing greenhouse gas emissions (Smith et al., 2007).
4.4. NUE as an indictor
The NUEs reported are for situations where the system is in equi-librium, i.e. there is no change in soil N stocks. The potentials found here for increasing the NUE of the production systems suggest that the indicative value of 90% proposed byOenema et al. (2015)above which there is a high risk of soil N depletion in arable farming systems might only be achievable in situations where a large number of technical measures to increase NUE have been applied. If few such measures are implemented, our results suggest that a value of 70% would be ad-visable. For livestock systems, the upper limit varied from 46% to 53% (N-Europe) and 36%–62% (S-Europe) for ruminants and 71% (N Europe) or 80% (S Europe) for unconstrained granivores. The upper limits are only relevant for situations where all the currently known measures to raise NUE have been implemented, so the somewhat lower limits tentatively proposed by Oenema et al. (2015) for present-day livestock systems seem reasonable.
NUE has been proposed as a simple and useful indicator for decision makers (Oenema et al., 2015). This would require a clear understanding of the terminology (Powell, 2015) – which should be feasible – and of the system boundaries. Livestock production systems do not map completely onto geographic units at the farm, state or continental scales, since feed is often imported. Developing benchmark NUE values for livestock production within defined geographic units therefore re-quires a mechanism to account for the NUE of the production systems that generate these imports. This and other studies (Godinot et al., 2014; FAO, 2018) show that this feasible and has the potential to identify where and how increases in NUE might be achieved. However, the additional data and assumptions required mean that the values generated by such systems lack the simplicity and transparency of those for arable systems. We therefore conclude that as an integrative in-dicator of the changes in the efficiency of the use of N in agricultural production that have occurred over time (Buckley et al., 2016) or that might occur in response to changes in agricultural practices (Oenema et al. (2009), and here), NUE is a useful guide to decision makers. In contrast, we question the usefulness of NUE as a practical indicator for benchmarking livestock production systems.
5. Conclusions
When comparing NUE it is important to pay particular attention to the system boundaries and to whether the residual effects of fertiliser and manure N applications are included. Improvements in the NUE of dairy, meat and arable production systems can be achieved using technical measures that are currently available. The improvements are likely to be greater for livestock that can be confined to livestock housing, with a maximum technical NUE of 71% and 80% in Northern and Southern Europe, respectively. The lowest potential for increase is for ruminant livestock reared for meat production on extensive per-manent grassland, where the NUE with few technical measures applied is already higher than for other livestock and where few additional
measures are available.
For arable systems, we find that the NUE value of 90% above which there is a high risk of soil N depletion is well founded for production systems that already employ many measures that increase NUE. For systems employing fewer measures, we suggest a value of 70% would be more appropriate.
We conclude that while it is feasible to calculate the NUE of live-stock production systems, the additional complexity required reduces its value as an indicator for benchmarking the balance between primary food production and N losses to the environment for these systems.
Declaration of competing interest
No known conflicts of interest.
Acknowledgements
This paper constitutes an output of the Expert Panel of Nitrogen and Food of the Task Force on Reactive Nitrogen under the Working Group on Strategies and Review of the UNECE Convention on Long-range Transboundary Air Pollution.
The lead author wishes to acknowledge funding provided under the “Contract between Aarhus University and the Ministry of Environment and Food of Denmark for the provision of research-based policy advice by Aarhus University, DCA - Danish Centre for Food and Agriculture, 2018-2021” The authors would like to thank Dr. Anja Hansen for her helpful comments and support during paper submission, and wish to acknowledge the useful suggestions from anonymous reviewers for improvements to this paper.
Appendix A. Supplementary data
Supplementary data to this article can be found online athttps:// doi.org/10.1016/j.gfs.2020.100381.
References
Baldini, C., Gardoni, D., Guarino, M., 2017. A critical review of the recent evolution of Life Cycle Assessment applied to milk production. J. Clean. Prod. 140, 421–435.
Buckley, C., Wall, D.P., Moran, B., O'Neill, S., Murphy, P.N.C., 2016. Farm gate level nitrogen balance and use efficiency changes post implementation of the EU Nitrates Directive. Nutrient Cycl. Agroecosyst. 104, 1–13.
Cardenas, L.M., Bhogal, A., Chadwick, D.R., McGeough, K., Misselbrook, T., Rees, R.M., Thorman, R.E., Watson, C.J., Williams, J.R., Smith, K.A., Calvet, S., 2019. Nitrogen use efficiency and nitrous oxide emissions from five UK fertilised grasslands. Sci. Total Environ. 661, 696–710.
Crowe, M.A., Hostens, M., Opsomer, G., 2018. Reproductive management in dairy cows -the future. Ir. Vet. J. 71, 1.https://doi.org/10.1186/s13620-017-0112-y.
DCA, 2014. In: Eriksen, J., Jensen, P.N., Jacobsen, B.H. (Eds.), Measures to Achieve the Second Generation Water Action Plans and Targetted Land Use Regulation. DCA report 052. Aarhus University, Aarhus, Denmark, pp. 314 (in Danish).
de Klein, C.A.M., Monaghan, R.M., Alfaro, M., Gourley, C.J.P., Oenema, O., Powell, J.M., 2017. Nitrogen performance indicators for dairy production systems. Soil Res. 55, 479–488.https://doi.org/10.1071/sr16349.
Erisman, J.W., Sutton, M.A., Galloway, J.N., Klimont, Z., Winiwarter, W., 2008. How a century of ammonia synthesis changed the world. Nat. Geosci. 1, 636–639. Erisman, J.W., Leach, A., Bleeker, A., Atwell, B., Cattaneo, L., Galloway, J.N., 2018. An
integrated approach to a nitrogen use efficiency (NUE) indicator for the food pro-duction–consumption chain. Sustainability 10, 925.https://doi.org/10.3390/ su10040925.
Erisman, J.W., Schaap, M., 2004. The need for ammonia abatement with respect to sec-ondary PM reductions in Europe. Environ. Pollut. 129, 159–163.
European Environment Agency, 2016. EMEP/EEA Air pollutant emission inventory guidebook 2016. https://www.eea.europa.eu/publications/emep-eea-guidebook-2016.
FAO, 2018. Nutrient flows and associated environmental impacts in livestock supply chains: guidelines for assessment (Version 1). In: Livestock Environmental Assessment and Performance (LEAP) Partnership. FAO, Rome, pp. 196 Licence: CC BY-NC-SA 3.0 IGO.
Godinot, O., Carof, M., Vertès, F., Leterme, P., 2014. SyNE: an improved indicator to assess nitrogen efficiency of farming systems. Agric. Syst. 127, 41–52.
Gourley, C.J.P., Aarons, S.R., Powell, J.M., 2012. Nitrogen use efficiency and manure management practices in contrasting dairy production systems. Agric. Ecosyst. Environ. 147, 73–81.
Joensuu, K., Pulkkinen, H., Kurppa, S., Ypyä, J., Virtanen, Y., 2018. Applying the nutrient footprint method to the beef production and consumption chain. Int. J. Life Cycle Assess. 24, 26–36.
Leip, A., Britz, W., Weiss, F., de Vries, W., 2011. Farm, land, and soil nitrogen budgets for agriculture in Europe calculated with CAPRI. Environ. Pollut. 159, 3243–3253.
Leip, A., Billen, G., Garnier, J., Grizzetti, B., Lassaletta, L., Reis, S., Simpson, D., Sutton, M.A., de Vries, W., Weiss, F., Westhoek, H., 2015. Impacts of European livestock production: nitrogen, sulphur, phosphorus and greenhouse gas emissions, land-use, water eutrophication and biodiversity. Environ. Res. Lett. 10, 115004.
Leip, A., Weiss, F., Lesschen, J.P., Westhoek, H., 2014. The nitrogen footprint of food products in the European Union. J. Agric. Sci. 152, S20–S33.
Millet, S., Aluwe, M., Van den Broeke, A., Leen, F., De Boever, J., De Campeneere, S., 2018. Review: pork production with maximal nitrogen efficiency. Animal 12, 1060–1067.
Nguyen, G.N., Kant, S., 2018. Improving nitrogen use efficiency in plants: effective phenotyping in conjunction with agronomic and genetic approaches. Funct. Plant Biol. 45, 606–619.
Oenema, O., Brentrup, F., Lammel, J., Bascou, P., Billen, G., Dobermann, A., Erisman, J.W., Garnett, T., Hammel, M., Haniotis, T., Hillier, J., Hoxha, A., Jensen, L., Oleszek, W., Pallière, C., Powlson, D., Quemada, M., Schulman, M., Sutton, M.A., Grinsven, H.J.M.v., Winiwarter, W., 2015. Nitrogen Use Efficiency (NUE) - an Indicator for the Utilization of Nitrogen in Agriculture and Food Systems. Wageningen University.
Oenema, O., Witzke, H.P., Klimont, Z., Lesschen, J.P., Velthof, G.L., 2009. Integrated assessment of promising measures to decrease nitrogen losses from agriculture in EU-27. Agric. Ecosyst. Environ. 133, 280–288.
Powell, J.M., 2015. The need for more uniform terms and measures of nitrogen use ef-ficiency in agricultural production. J. Soil Water Conserv. 70, 95A–97A.
Powell, J.M., Gourley, C.J.P., Rotz, C.A., Weaver, D.M., 2010. Nitrogen use efficiency: a potential performance indicator and policy tool for dairy farms. Environ. Sci. Pol. 13,
217–228.
Powell, J.M., Rotz, C.A., 2015. Measures of nitrogen use efficiency and nitrogen loss from dairy production systems. J. Environ. Qual. 44, 336–344.
Schraufnagel, D.E., Balmes, J.R., Cowl, C.T., De Matteis, S., Jung, S.H., Mortimer, K., Perez-Padilla, R., Rice, M.B., Riojas-Rodriguez, H., Sood, A., Thurston, G.D., To, T., Vanker, A., Wuebbles, D.J., 2019. Air pollution and noncommunicable diseases: a review by the forum of international respiratory societies' environmental committee, Part 1: the damaging effects of Air pollution. Chest 155, 409–416.
Schullehner, J., Hansen, B., Thygesen, M., Pedersen, C.B., Sigsgaard, T., 2018. Nitrate in drinking water and colorectal cancer risk: a nationwide population-based cohort study. Int. J. Canc. 143 (1), 73–79.https://doi.org/10.1002/ijc.31306.
Smith, P., Martino, D., Cai, Z., Gwary, D., Janzen, H., Kumar, P., McCarl, B., Ogle, S., O'Mara, F., Rice, C., 2007. Policy and technological constraints to implementation of greenhouse gas mitigation options in agriculture. Agric. Ecosyst. Environ. 118, 6–28.
Sutton, M.A., Howard, C.M., Erisman, J.W., Billen, G., Bleeker, A., Grennfelt, P., Grinsven, H.v., Grizzetti, B., 2011. European Nitrogen Assessment. Cambridge University Press. UNECE, 2014. Guidance Document on Preventing and Abating Ammonia Emissions from
Agricultural Sources. UNECE, Geneva. https://www.unece.org/fileadmin/DAM/ env/documents/2012/EB/ECE_EB.AIR_120_ENG.pdf.
Uwizeye, A., Gerber, P.J., Schulte, R.P.O., de Boer, I.J.M., 2016. A comprehensive fra-mework to assess the sustainability of nutrient use in global livestock supply chains. J. Clean. Prod. 129, 647–658.
Watson, C.A., Atkinson, D., 1999. Using nitrogen budgets to indicate nitrogen use effi-ciency and losses from whole farm systems: a comparison of three methodological approaches. Nutrient Cycl. Agroecosyst. 53, 259–267.
Winiwarter, W., Leip, A., Tuomisto, H.L., Haastrup, P., 2014. A European perspective of innovations towards mitigation of nitrogen-related greenhouse gases. Curr. Opin. Environ. Sustain. 9–10, 37–45.