i
UNIVERSIDADE DA BEIRA INTERIOR
Ciências da Saúde
Impact of H-ferritin deficiency on macrophage
viability and iron status
Gonçalo Augusto Taborda da Costa Laranja Mesquita
Dissertação para obtenção do Grau de Mestre em
Ciências Biomédicas
(2º ciclo de estudos)
(Tese definitiva após defesa pública)
Orientador: Doutora Ana Carolina Moreira
Co-orientador: Prof. Doutora Maria Salomé Gomes
Co-orientador: Prof. Doutor Fernando A. Arosa
iii
Dedicatória
Esta tese é dedicada:
- À minha avó, que me apoia todos os dias e que me faz acreditar sempre, que sou capaz de ultrapassar todos os desafios que me apareçam;
- À Tânia Silva, que, mesmo sem ter essa responsabilidade, me apoiou em todos os aspetos no desenvolvimento desta tese;
v
Agradecimentos
Para começar queria agradecer aos meus orientadores da tese, à Doutora Carolina Moreira, à Professora Doutora Salomé Gomes e ao Professor Doutor Fernando Arosa. Um agradecimento especial à Carolina que, mais do que orientadora, é uma das pessoas mais espantosas que conheço e que se tornou numa boa amiga. Também um agradecimento especial à Professora Salomé que nunca deixou de acreditar em mim, mesmo com os percalços que fui tendo ao longo desta jornada. Quero agradecer à Universidade da Beira Interior à qual pertenci durante 5 anos e da qual vou levar imensas experiências e pessoas que ficarão comigo durante o resto da minha vida. Um agradecimento, também, ao i3S por me permitir realizar a tese nas suas instalações, não podendo esquecer um agradecimento ao Professor Doutor Pedro Rodrigues por me acolher no seu grupo, Iron and Innate Immunity. Neste grupo tenho de agradecer à Carolina (mais nova), ao João, à Tânia, a quem já dediquei esta tese e à Rita, que sempre se mostrou disponível para me ensinar e ajudar em tudo. Obrigado por tornarem o dia-a-dia no laboratório num ambiente sempre alegre e familiar. Para isto também ajudou muito a companhia do pessoal do grupo Immune Regulation a quem também deixo uma nota de apreço. Agradecer também ao ICBAS, por me permitir usar as suas instalações para o desenvolvimento desta tese.
Na parte mais pessoal, quero deixar um muito obrigado à minha família. Em especial, para os meus pais, pela educação que me deram e pelos sacrifícios que tiverem de fazer para eu chegar onde cheguei, não tenho palavras para descrever o quão grato estou. Gostava de poder expressar individualmente a minha gratidão pela minha segunda família, que são os meus amigos. No entanto isso ocuparia demasiado espaço e iria deixar demasiados egos inchados. No entanto, aos meus amigos, sejam eles de Famalicão, Covilhã ou de outra cidade qualquer, obrigado por me aturarem e não me deixarem ir abaixo mesmo em momentos menos bons. Em especial, àqueles que convivem comigo todos os dias, esta tese é um bocadinho de cada um de vocês. A quem não referi e que participou, direta ou indiretamente, nesta tese, deixo aqui a minha nota de agradecimento.
Este trabalho foi financiado pelos fundos da FEDER - Fundo Europeu de Desenvolvimento Regional, através do COMPETE2020 – Programa Operacional para a Competitividade e Internacionalização (POCI), Portugal 2020 e por fundos portugueses, através da FCT - Fundação para a Ciência e a Tecnologia/Ministério da Ciência, Tecnologia e Ensino Superior, no âmbito do projeto PTDC/IMI-MIC/1683/2014 (POCI-01-0145-FEDER-016590).
vii
Resumo
O ferro é essencial para a sobrevivência de quase todos os organismos vivos, sendo um elemento fundamental em diversas funções celulares, como a síntese do ADN e do ARN, proliferação celular e produção de energia. No entanto, este mineral necessita de ser cuidadosamente regulado e armazenado. Para tal, o metabolismo do ferro necessita de ser controlado a nível sistémico e celular. O ferro que não se encontra armazenado, ou ligado a alguma proteína, pode participar em reações que levam à formação de radicais livres, que podem promover a degradação o ADN, ARN, proteínas, entre outros. Para evitar estes efeitos nefastos, as células desenvolveram vários mecanismos, entre eles, a ferritina. A ferritina é uma proteína composta por duas subunidades, a H e a L, que são responsáveis pelo armazenamento do ferro.
Os macrófagos têm um papel essencial, tanto na resposta imune à infeção, como no metabolismo e distribuição do ferro. Estudos anteriores do nosso laboratório demonstraram que quando infetados com micobactérias os macrófagos aumentam os seus níveis de ferritina-H (FTH1). O objetivo desta tese foi investigar o papel da FTH1 na biologia do macrófago. Para tal, foram usados macrófagos derivados da medula óssea de murganhos, com uma deleção condicional da ferritina-H, na linhagem mieloide. Os nossos resultados começaram por demonstrar que a FTH1 não é necessária à diferenciação dos macrófagos, a partir dos seus precursores. Além disso, a viabilidade e a expressão de genes relacionados com o metabolismo do ferro também não foram diferentes em macrófagos deficientes em FTH1. No entanto, quando estimulados por ferro exógeno, a viabilidade celular destes macrófagos diminuiu e, de forma concordante, a morte celular aumentou. Estes fenómenos, podem estar a ocorrer devido a um aumento do ferro livre e subsequente aumento de dano devido ao stress oxidativo. Posteriormente, analisámos o impacto da FTH1 na resposta dos macrófagos a estímulos imunológicos e/ou bacterianos. Pudemos concluir que há um claro papel da FTH1 na proteção contra a toxicidade do IFN-γ, sendo que os macrófagos que não expressavam Fth1, tiveram a sua viabilidade reduzida e uma maior percentagem de morte celular. A expressão génica, de outros elementos envolvidos no metabolismo do ferro, nos macrófagos desprovidos de Fth1, também se encontrava alterada, com especial foco em células tratadas com IFN-γ+LPS. Além disso, a produção de nitritos nestas células encontrava-se diminuída.
Em conclusão, estes resultados indicam um papel preponderante da FTH1 na proteção celular contra a toxicidade induzida tanto pelo ferro, como pelo IFN-γ. Num trabalho futuro, pretendemos aprofundar os mecanismos responsáveis pela proteção conferida pela FTH1, aos macrófagos, assim como abordar o seu papel num contexto de infeç
ão.
Palavras-chave
ix
Abstract
Almost all life on Earth has a great demand for iron. Importance of iron is based on its crucial participation on several fundamental processes such as DNA and RNA synthesis, cell proliferation and energy production. However, this mineral needs to be strictly controlled and properly stored, as free iron can induce tissue and cell damage through the formation of free radicals. Iron traffic and distribution is controlled by complex systems, operating both at systemic and at cellular levels. Ferritin plays a key role in this respect. The ferritin protein, composed of H and L subunits, is responsible for safely storing iron inside the cells. Macrophages are central cells both for immune response to infection and for the iron metabolism and distribution. Previous work of our group showed that macrophages infected with mycobacteria increase their content in H-ferritin (FTH1).
The main goal of this thesis was to investigate the role of FTH1 in macrophage physiology, using bone marrow-derived macrophages from mice with a conditional deletion of Fth1 in the myeloid lineage. Our data showed that FTH1 was not necessary for macrophages’ differentiation from bone marrow precursors. FTH1-deficient macrophages kept their viability and had a normal expression of iron-related genes. Nonetheless, when challenged with exogenous iron, macrophages lacking Fth1 have increased mortality, probably due to the increase in free iron and subsequent increase in oxidative damage.
Furthermore, the impact of Fth1 on macrophage response to both immune and bacterial stimuli was studied. Our results demonstrated a clear role for H-ferritin in protection against IFN-γ toxicity, as cells that do not express Fth1 had their viability impaired alongside with higher mortality. Gene expression of iron metabolism-related genes, between genotypes, was altered, especially in cells treated with IFN-γ+LPS. Additionally, nitrites production was hampered in macrophages lacking Fth1.
In conclusion, these findings indicate that FTH1 is essential for cellular protection against iron and IFN-γ-induced toxicity. Future work will deepen our knowledge onto the mechanisms behind the protective role of FTH1 in macrophages, against these different external insults, and also in the context of infection.
Keywords
xi
Resumo Alargado
O ferro é essencial para a sobrevivência de quase todos os organismos vivos, sendo fundamental em diversas funções celulares, como a síntese do ADN e do ARN, proliferação celular e produção de energia. No entanto, este mineral necessita de ser cuidadosamente regulado e armazenado, de forma a não ser prejudicial para os tecidos e células. Para tal, o metabolismo do ferro necessita de ser controlado a nível sistémico e celular. O ferro que não se encontra armazenado, ou ligado a alguma proteína, pode participar em reações que levam à formação de radicais livres, que podem promover a degradação do ADN, ARN, proteínas, entre outros. Para evitar estes efeitos nefastos, as células desenvolveram vários mecanismos, entre eles, a ferritina. A ferritina é uma proteína composta por duas subunidades, a H e a L, que são responsáveis pelo armazenamento do ferro.
Os macrófagos têm um papel essencial, tanto na resposta imune à infeção, como no metabolismo e distribuição do ferro. Estudos anteriores do nosso laboratório, demonstraram que quando infetados com micobactérias os macrófagos aumentam os seus níveis de ferritina-H (FTferritina-H1). O objetivo do trabalho desta tese, foi investigar o papel da FTferritina-H1 na biologia do macrófago. Para tal, foram usados macrófagos derivados da medula óssea de murganhos, com uma deleção condicional da ferritina-H, na linhagem mieloide. Os nossos resultados começaram por demonstrar que, efetivamente, tanto a nível génico, como a nível proteico, confirmou-se a deleção da ferritina-H. De seguida, analisamos o desenvolvimento dos macrófagos que não possuíam ferritina-H, de forma a perceber se esta tinha algum impacto na sua diferenciação a partir dos precursores. Para tal, recorremos a testes de viabilidade, citometria de fluxo e microscopia. Estes resultados demonstraram que a FTH1 não tem um papel essencial no desenvolvimento e diferenciação dos macrófagos. O passo seguinte, foi a análise da expressão de genes envolvidos no metabolismo do ferro e de genes relativos à ativação macrofágica, na qual não foram observadas diferenças significativas entre os genótipos.
Uma vez que não se registaram diferenças em condições basais, decidimos estimular as células com diferentes compostos exógenos. Os primeiros estímulos testados foram duas diferentes fórmulas de ferro, FAC e hemina, e um quelante, denominado DFO. Ambas as formas de ferro foram tóxicas para as células. Através da análise da viabilidade e morte celular, na presença de concentrações crescentes das duas formas de ferro, foi calculado o IC50, aconcentração
necessária para um composto reduzir a viabilidade celular em 50%, para cada uma delas. Verificámos deste modo que as células foram mais suscetíveis (IC50 mais baixo) ao FAC do que à hemina e que os macrófagos deficientes em Fth1 eram mais suscetíveis a ambas as formas de ferro do que os macrófagos normais. O quelante DFO não induziu efeitos diferentes entre os dois genótipos e não conseguiu reduzir a viabilidade celular abaixo dos 50%, pelo que não foi possível calcular IC50 para este composto.
xii
Por último, averiguamos o papel da ferritina-H na ativação dos macrófagos. Com este objetivo, incubámos macrófagos, que possuem, ou não, a deleção condicional do gene da ferritina-H, com dois conhecidos ativadores macrofágicos, IFN-γ e LPS. Nesta parte do trabalho, analisámos a viabilidade, morte celular, expressão génica e produção de nitritos e TNF-α dos macrófagos. Nos vários testes realizados, encontraram-se algumas diferenças nas respostas dos dois genótipos. Macrófagos desprovidos de Fth1 são mais suscetíveis ao γ e na presença de IFN-γ+LPS expressam menos Tfrc (gene do recetor da transferrina-1) e Nos2a (gene do indutor da síntese de óxido nítrico), além de terem uma menor produção de nitritos.
Em conclusão, estes resultados demonstram que a FTH1 não é preponderante para o desenvolvimento e diferenciação dos macrófagos, mas tem um papel na resposta a estímulos exógenos. As experiências realizadas indicam um papel preponderante da FTH1 na proteção celular contra a toxicidade induzida tanto pelo ferro, como pelo IFN-γ. Num trabalho futuro, pretendemos aprofundar os mecanismos responsáveis na proteção conferida pela FTH1, aos macrófagos, assim como abordar o seu papel num contexto de infeção.
Palavras-chave
xiii
Contents
Figures’ list ... xv
Tables’ List ... xix
Abbreviation List ... i
Introduction ... 1
The Iron Metabolism ... 1
Regulation of iron absorption and distribution ... 1
Cell-intrinsic iron regulatory circuits ... 3
The Ferritin ... 4
The macrophage ... 6
Functions of the macrophage ... 6
Macrophages in iron metabolism ... 7
Objectives ... 9
Materials and Methods ... 11
Chemicals ... 11
Animals ... 11
Bone marrow-derived macrophages ... 11
Cell morphology ... 12
Cell viability ... 12
Cell metabolic activity: ... 12
Cell membrane permeability: ... 12
Flow cytometry ... 12 Cell-treatments ... 13 TUNEL ... 13 ELISA ... 13 Griess ... 14 Protein extraction ... 14 Western blot ... 14 RNA extraction ... 15 qPCR ... 15 Data analysis ... 16 Results ... 17
1. Mo-Fth1-/- develop normally from their precursors in the bone marrow ... 17
1.1. The viability of BMM is the same regardless of the expression of Fth1 ... 17
1.2. Mo-Fth1-/- express the same levels of macrophage surface markers than Mo-Fth1+/+ ... 17
1.3. The morphology of Mo-Fth1-/- and Mo-Fth1+/+ are undistinguishable ... 18
1.4. FTH1 is not expressed in Mo-Fth1-/- ... 19
2. The lack of Fth1 alters the way macrophages deal with iron. ... 20
xiv
2.2. When treated with exogenous iron, Mo-Fth1-/- loose viability to a higher extent
than Mo-Fth1+/+... 20
3. The lack of Fth1 has a minor impact on BMM response to cytokine or microbial
activation ... 22
Discussion ... 27
xv
Figures’ list
Figure 1 - Iron systemic cycle. Every day 1-2 mg of iron are absorbed through duodenum and
transported into the bloodstream bound to transferrin. Iron can be stored in hepatocytes or used in the formation of new red blood cells (RBC). Iron inside erythrocytes can be recycled by macrophages and reused in the formation of new red blood cells. Iron losses occur through bleeding, desquamation, menstruation and pregnancy. Adapted from (Wilkinson and Pantopoulos, 2014).
Figure 2 – Iron metabolism in macrophages. Iron can enter the cell through TF-TFR complex
(1), erythrocyte phagocytosis (2), or heme and hemoglobin scavengers, like hemopexin and haptoglobin (3). (1) The TF-TFR complex enters the cells and releases iron through acidification of the endosome. TF is released from the cell and TFR goes back to the cell surface. Ferric iron is reduced by STEAP3 and enters the LIP with the help of natural resistance-associated macrophage protein-1 (NRAMP-1). (2,3) Erythrocytes, heme or hemoglobin scavangers are internalized by the cell, broken down inside lysosomes, releasing iron from heme through HMOX1, before joining the LIP. (4) From LIP, iron can either be used by (5) mitochondria for new heme synthesis, among others, (6) stored in ferritin or (7) exported by ferroportin. Adapted from (Evstatiev and Gasche, 2012).
Figure 3 – Post-transcriptional control of cellular pathways by the IRE-IRP regulatory system.
When in iron deplete conditions, IRP binds IRE within 5’UTR of mRNA, inhibiting H and L ferritin, and ferroportin translation, to lower iron storage and efflux; or bind IRE within 3’UTR stabilizing the mRNA of TFR1 and DMT1, enhancing iron uptake and transport. On the other hand, when iron levels are increased, IRP do not bind IRE, leading to opposite effects (higher iron storage and efflux and lower iron uptake and transport). Adapted from (Wang and Pantopoulos, 2011).
Figure 4 – BMM viability is not dependent of Fth1 expression. Cell viability of Mo-Fth1+/+
(black bars) and Mo-Fth1-/- (grey bars) was measured at 4, 7 and 10 days after the beginning of
the culture. At those time-points, resazurin 0.3 mg/ml was added at 10% (v/v) and after 20 h the fluorescence was measured at 530/590 nm. The graphs represent the mean + standard deviation (SD) (n[Mo-Fth1+/+] = 7; n[Mo-Fth1-/-] = 14).
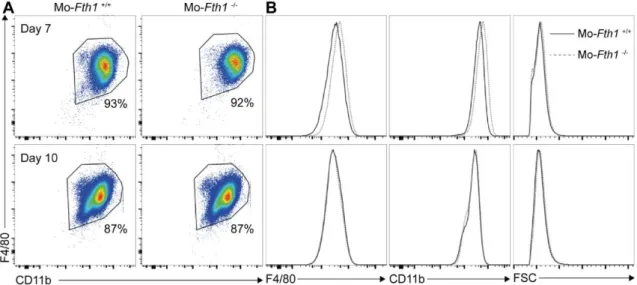
Figure 5 – H-ferritin deficiency does not impact macrophage differentiation. At days 7 and
10 of culture, BMM were stained for the myeloid markers F4/80 and CD11b and analyzed by flow cytometry. A) Flow cytometry plots of CD11b and F4/80 staining of Mo-Fth1-/- and
Mo-Fth1+/+ at the two time-points. Percentages indicate the frequency of CD11b+ F4/80+ cells. B)
Histogram plots of Mo-Fth1-/- (dotted grey line) and Mo-Fth1+/+ (solid black line) for F4/80 (left
panel) and CD11b (middle panel) markers, and cell size (FSC, right panel). One representative experiment out of two is shown.
xvi
Figure 6 – Mo-Fth1-/- and Mo-Fth1+/+ have similar morphologies. Light microscopy images of
BMM at A) 8 and B) 10 days after the beginning of the culture. Pictures shown here are representative of four independent experiments. The cells were visualized and photographed in an Olympus SC30 camera.
Figure 7 – Mo-Fth1-/- do not express H-Ferritin. A) 10 days after the beginning of the culture,
BMM were harvested, total protein quantified and H-ferritin (FTH1) expression was determined by Western blot. β-actin (ACTB) was used as housekeeping protein (loading control). These results are representative of two independent experiments. B) The graph represents the densitometry analysis obtained with ImageLabTM software of FTH1 expression in each culture,
normalized to ACTB densitometry, expressed as percentage to Mo-Fth1+/+. Statistical analysis
was performed using an unpaired t test. * p < 0.05 statistically significant.
Figure 8 – Expression of iron metabolism genes are similar in both genotypes. 10 days after
the beginning of the culture, qPCR was used to determine the expression levels of several genes involved in iron metabolism: H-ferritin (Fth1), L-ferritin (Ftl), ferroportin (Slc40a1), heme oxygenase 1 (Hmox1), transferrin receptor (Tfrc), inducible nitric oxide synthase (Nos2a), arginase (Arg1) and tumor-necrosis factor (Tnf). Data represent the mean + SD are expressed as the fold-change of expression in Mo-Fth1-/- (grey bars) relative to that in Mo-Fth1+/+ (dashed
line). Number of samples for each gene is depicted in the graph. Statistical analysis was performed using unpaired t-test. * p < 0.05 statistically significant.
Figure 9 – Mo-Fth1-/- are more sensitive to iron toxicity. Mo-Fth1+/+ (black) and Mo-Fth1
-/-(grey) were treated with FAC (A), hemin (B) or the iron chelator DFO (C) at different concentrations, 7 days after the beginning of the culture. Cell viability was measured 3 days later, by resazurin reduction: resazurin (0.3 mg/ml) was added at 10% (v/v), incubated for 20 h, and the fluorescence was measured at 530/590 nm. The graphs represent the mean ± SD (n[Mo-Fth1+/+] = 3; n[Mo-Fth1-/-] = 7). Statistical analysis was performed using two-way ANOVA
with Tukey’s multiple comparisons. * p < 0.05 statistically significant.
Figure 10 – Cell viability of Mo-Fth1-/- decreases in the presence of iron. Mo-Fth1+/+ (black)
and Mo-Fth1-/- (grey) were treated with FAC (A), hemin (B) or the iron chelator DFO (C) at
different concentrations, 7 days after the beginning of the culture. Cell death was measured through SYTOXTM Green three days after the treatment. The graphs represent the mean + SD
(n[Mo-Fth1+/+] = 2; n[Mo-Fth1-/-] = 4). Statistical analysis was performed using two-way ANOVA
with Tukey’s multiple comparisons. * p < 0.05 statistically significant. (D) Cell death was analyzed through TUNEL assay. Mo-Fth1+/+ (black) and Mo-Fth1-/- (grey) were treated with 30
µM FAC, 100 µM hemin and 100 µM DFO, for 72 h. The graph represents one experiment
(n[Mo-Fth1+/+] = 1; n[Mo-Fth1-/-] = 1).
Figure 11 - Mo-Fth1-/- have an increased susceptibility to γ. Cells were treated with
xvii
death (B) Mo-Fth1+/+ (black) and Mo-Fth1-/- (grey) were measured 3 days after treatments. A)
Resazurin (0.3 mg/ml) was added at 10% (v/v), incubated for 20 h, and fluorescence was measured at 530/590 nm. The graph represents the mean + SD of five independent experiments (n[Mo-Fth1+/+] = 3; n[Mo-Fth1-/-] = 7). B) Cell death was measured through SYTOXTM Green. The
graph represents the mean + SD (n[Mo-Fth1+/+] = 2; n[Mo-Fth1-/-] = 4). * p < 0.05 when comparing
the two genotypes. # p < 0.05 statistically significant when comparing with the corresponding NT sample.
Figure 12 – Iron metabolism genes have different expression responses to cytokines in
Mo-Fth1+/+ and Mo-Fth1-/-. After 7 days in culture, BMM were treated with IFN-γ, LPS or IFN-γ+LPS,
and 3 days later the expression levels of several iron metabolism genes were quantified by qPCR. (A) H-ferritin (Fth1), (B) L-ferritin (Ftl), (C) ferroportin (Slc40a1), (D) heme oxygenase 1 (Hmox1), (E) transferrin receptor (Tfrc) and (F) inducible nitric oxide synthase (Nos2a). Data are expressed as mean + SD, presented as fold-change relatively to the non-treated (NT)
Mo-Fth1+/+ (n[Mo-Fth1+/+] = 4; n[Mo-Fth1-/-] = 7). Statistical analysis was performed using two-way
ANOVA with Tukey’s multiple comparisons. * p < 0.05 statistically significant between the two genotypes; # p < 0.05 statistically significant when comparing with the NT of Mo-Fth1+/+.
Figure 13 – Nitrite production is altered in Mo-Fth1-/-. Cells were treated with IFN-γ, LPS or
IFN-γ+LPS, 7 days after the beginning of the cell culture. Nitrite production (A) and release of TNF-α (B) of Mo-Fth1+/+ (black) and Mo-Fth1-/- (grey) was measured 3 days after cytokines
treatment. A) Nitrite production was quantified by the Griess assay. B) TNF- production was measured by ELISA. The graphs represent the mean + SD (n[Mo-Fth1+/+] = 2; n[Mo-Fth1-/-] = 6).
Statistical analysis was performed using two-way ANOVA with Tukey’s multiple comparisons test. * p < 0.05 when comparing the two genotypes. # p < 0.05 statistically significant when comparing with the corresponding NT sample.
xix
Tables’ List
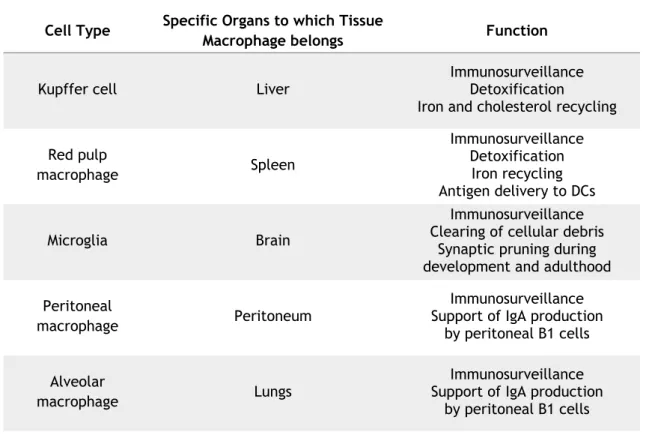
Table 1 - Tissue-resident macrophage and their functions (modified from (Varol, Mildner, &
Jung, 2015)).
Table 2 – Primers list.
a Accepted nomenclature by OMIM (www.omim.org) and Mouse Genomic Informatics
(www.iformatics.jax.org).
i
Abbreviation List
ACTB a - β-actin
Arg1 a – Arginase gene
BM - Bone marrow
BMM – Bone marrow-derived macrophages BSA – Bovine serum albumin
CT – Threshold cycle
CYBRD1 - Cytochrome b reductase 1 DFO – Desferoxamine B mesylate
DMEM – Dulbecco’s modified eagle medium DMT1 - Divalent metal transporter-1 EP - Erythroid precursors
FAC – Ferric ammonium citrate FBS – Fetal bovine serum FSC – Forward scatter
Fth1 or FTH1a – H-ferritin gene or protein
Ftl or FTLa – L-Ferritin gene or protein
HBSS – Hank’s salt balanced solution
Hmox1 or HMOX1a – Heme oxygenase 1 gene or protein
Hprt a – Hypoxanthine guanine phosphoribosyl transferase gene
HSC - Hematopoietic stem cells
IC50 – Half maximal inhibitory concentration
IFN-γ – Interferon-gamma IRE - Iron responsive elements IRP - Iron regulatory proteins LCCM – L cell conditioned medium LIP - Labile iron pool
LPS – Lipopolysaccharide
Lyz2 –Lysosome 2 gene
MAPK – mitogen-activated protein kinase Mo-Fth1-/- -Macrophages deficient for Fth1
Mo-Fth1+/+ - Macrophages sufficient for Fth1
NF-kB – nuclear factor kappa B
Nos2a or NOS2Aa - Nitric oxide synthase gene or protein
NRAMP-1 – Natural resistance-associated macrophage protein-1 NT – Non-treated
PBS – Phosphate Buffered Saline PFA - Paraformaldehyde
a Accepted nomenclature by OMIM (www.omim.org) and Mouse Genomic Informatics
(www.iformatics.jax.org).
ii
RBC – Red blood cells SD – Standard deviation
Slc40a1 or FPN1a - Ferroportin-1 gene or protein
SSC – Side scatter
STEAP3 - Six-transmembrane epithelial antigen of prostate 3 TBS-T – Tris-buffered saline with 0.1% Tween-20
TF – Transferrin
TFR2 - Transferrin-receptor 2
Tfrc or TFR1a - Transferrin receptor 1 gene or protein
TIM - T cell immunoglobulin-domain and mucin-domain TLR –Tool-like receptor
Tnf or TNF-αa – Tumor necrosis factor gene or protein
1
Chapter 1
Introduction
The Iron Metabolism
Regulation of iron absorption and distribution
Iron is essential for almost every living organism. It plays several key roles in diverse processes like synthesis of DNA or RNA, mitochondrial respiratory chain, cell proliferation and differentiation, among others (Lieu et al., 2001). Specifically, in mammals, the most iron-demanding process is erythropoiesis. However, iron levels must be controlled, as either the lack or the excess of this metal can lead to serious health problems. Mammalian species have developed various mechanisms that can potentially protect them from the nefarious effects of both the lack and excess of iron. In case of iron deficiency, consequences can impact pregnancy (Allen, 2000), impair erythropoiesis and lead to anemia (Miller, 2013) or even affect the normal cognitive development (Jauregui-Lobera, 2014). When in excess or misplaced, iron may cause tissue and cell damage through formation of free radicals.
Figure 1 - Iron systemic cycle. Every day 1-2 mg of iron are absorbed through duodenum and transported
into the bloodstream bound to transferrin. Iron can be stored in hepatocytes or used in the formation of new red blood cells (RBC). Iron inside erythrocytes can be recycled by macrophages and reused in the formation of new red blood cells. Iron losses occur through bleeding, desquamation, menstruation and pregnancy. Adapted from (Wilkinson and Pantopoulos, 2014).
2
The most well-known reactions that involve iron and can harm the cells are the “Haber-Weiss” and the “Fenton” reactions. In these, both ferrous iron (Fe2+) and hydrogen peroxide interact
with other substrates giving origin to radicals that are able to damage cell membranes, proteins and DNA (Eaton and Qian, 2002, Winterbourn, 1995). Iron toxicity can lead to several health problems, from cardiovascular diseases to cancer (Weinberg, 2009). In humans, iron represents approximately 45 mg/kg in male and female adults (Alleyne et al., 2008). Iron values in the body do not vary much since there are almost no losses except for bleeding, pregnancy, menstruation or desquamation of epithelia (Nairz et al., 2015) (Fig. 1). The small quantities of iron that enter the organism (1-2 mg a day) are absorbed through the duodenum and proximal jejunum, by the enterocytes. The extent of this absorption is tightly regulated by several factors. Ingested iron enters the enterocytes via the divalent metal transporter-1 (DMT1), located on the apical membrane of these cells. The most common form of iron in the diet is Fe3+, however to be internalized by DMT1, iron needs to be in the ferrous form (Fe2+). Thus, it
is necessary to reduce it before it enters the enterocytes, which occurs mostly by cytochrome b reductase 1 (CYBRD1) (Latunde-Dada et al., 2008). Heme-iron is also absorbed in the intestinal tract, but the mechanisms by which heme enters the enterocytes are not clear yet. After entering the cells, heme is degraded by heme oxygenase 1 (HMOX1) into carbon monoxide, free iron and bilirubin (Tenhunen et al., 1968). Iron is exported from the cells by the only known iron exporter, ferroportin-1 (FPN1). This protein is essential in the iron homeostasis and when Slc40a1, ferroportin gene, is deleted it results in embryonic lethality (Donovan et al., 2005). The levels of FPN1 at the cellular surface are controlled by hepcidin, a liver-produced hormone that induces the internalization and posterior degradation of the iron exporter (De Domenico et al., 2009a, Nemeth et al., 2004). Hepcidin expression is regulated by iron levels (Lin et al., 2007), anemia (Wang and Babitt, 2016) and hypoxia (Liu et al., 2012). When in conditions of iron overload, the levels of hepcidin increase leading to a decrease in FPN1 levels (D'Angelo, 2013). On the other hand, in situations of anemia or hypoxia there is a dramatic decrease in the hepcidin levels (Nicolas et al., 2002). The link between iron levels and the expression of hepcidin in hepatocytes is regulated by bone morphogenic proteins and JAK2/STAT3 signaling pathway, hemojuvelin, neogenin, transferrin-receptor2 (TFR2), human hemochromatosis protein and BMP6 (reviewed in (Zhao et al., 2013)).
The iron exported by FPN1 is oxidized by ferroxidases like hephaestin or ceruloplasmin, in order to be caught by the main iron transporter protein in the bloodstream, transferrin (TF) (Cherukuri et al., 2005, Vulpe et al., 1999). TF is an iron chelating protein that can bind two atoms of ferric iron (Fe3+) in a reversible way, maintaining thus the iron in a tightly bound and
low reactivity form, and preventing the generation of free radicals that could appear with the presence of ferrous iron (Fe2+) (Aisen et al., 1978).
3
Cell-intrinsic iron regulatory circuits
In order to internalize iron from transferrin, cells have ubiquitously expressed transferrin receptor 1 and 2 (TFR1 and TFR2). Upon binding, the TF-TFR complex undergoes endocytosis, through a clathrin dependent process, and the exposure to the acidic pH of the endosome releases iron from TF. Before entering the cytosol through DMT1, iron needs to be reduced from its ferric form by six-transmembrane epithelial antigen of prostate 3 (STEAP3) (Ohgami et al., 2005). Then, the complex TF-TFR will be recycled, TF will return to the bloodstream and TFR1 will return to the cell surface (Fig. 2). The TF-TFR pathway is not the only way for iron to enter the cells as TFR1-independent iron uptake has been reported (Trinder et al., 1996). For example, macrophages have various ways to import this metal, including phagocytosis of senescent erythrocytes (Bratosin et al., 1998) or scavenging free hemoglobin or heme (Fig. 2). Iron scavengers, like haptoglobin and hemopexin, bind serum heme or hemoglobin that is released from ruptured erythrocytes. Macrophages are able to internalize these proteins and further degrade the heme group to obtain iron (Smith and McCulloh, 2015, Soares and Hamza, 2016) (Fig. 2). Once inside the cell, iron enters a pool of free iron, named labile iron pool (LIP), which consists in a transient pool of iron, alongside with some permeant chelators that prevent iron participation in the redox-cycling (Kakhlon and Cabantchik, 2002). From the LIP, iron can either be immediately used, stored inside the cell, or released through FPN1 (Delaby et al., 2005, Van Zandt et al., 2008) (Fig. 2).
Figure 2 – Iron metabolism in macrophages. Iron can enter the cell through TF-TFR complex (1),
erythrocyte phagocytosis (2), or heme and hemoglobin scavengers, like hemopexin and haptoglobin (3). (1) The TF-TFR complex enters the cells and releases iron through acidification of the endosome. TF is released from the cell and TFR goes back to the cell surface. Ferric iron is reduced by STEAP3 and enters the LIP with the help of natural resistance-associated macrophage protein-1 (NRAMP-1). (2,3) Erythrocytes, heme or hemoglobin scavangers are internalized by the cell, broken down inside lysosomes, releasing iron from heme through HMOX1, before joining the LIP. (4) From LIP, iron can either be used by (5) mitochondria for new heme synthesis, among others, (6) stored in ferritin or (7) exported by ferroportin. Adapted from (Evstatiev and Gasche, 2012).
4
The iron status of each cell is also regulated by iron responsive elements/iron regulatory proteins (IRE/IRP) that act in response to cellular iron content, affecting the expression of several iron-related proteins. This system impacts on iron acquisition (TFR1, DMT1), iron storage (H-ferritin [FTH1] and L-ferritin [FTL]), iron use (mitochondrial aconitase, hypoxia-inducible factor) and iron export ferroportin ([FPN1]) (Muckenthaler et al., 2008).
Iron Regulatory Elements are a family of 28-nucleotide non-coding sequences present in mRNAs coding for some proteins involved in iron metabolism. Iron Regulatory Proteins bind to IRE, either preventing the degradation of the mRNA and increasing the production of the coded protein or blocking its translation (Fig. 3). IRP bind IRE only when cellular iron levels are low. When the IRP binds within the 5’UTR of the mRNA, translation is inhibited. This happens in genes coding for iron storage and iron export proteins as Fth1, Ftl and Fpn1. When the complex IRP-IRE is formed in the 3’UTR region, as occurs in mRNA coding for proteins involved in iron uptake as TFR or DMT1, the mRNA is stabilized preventing its degradation and increasing protein production (Daniels et al., 2006, Torti and Torti, 2002) (Fig. 3).
Figure 3 – Post-transcriptional control of cellular pathways by the IRE-IRP regulatory system. When in
iron deplete conditions, IRP binds IRE within 5’UTR of mRNA, inhibiting H and L ferritin, and ferroportin translation, to lower iron storage and efflux; or bind IRE within 3’UTR stabilizing the mRNA of TFR1 and DMT1, enhancing iron uptake and transport. On the other hand, when iron levels are increased, IRP do not bind IRE, leading to opposite effects (higher iron storage and efflux and lower iron uptake and transport). Adapted from (Wang and Pantopoulos, 2011).
The Ferritin
Regarding the storage of iron in the cells, the key player on this process is ferritin. Ferritin is a large, spherical molecule that stores iron inside its core. This protein has been conserved throughout evolution in most living species, demonstrating the importance of ferritin and its functions. Ferritin is much more than an iron deposit, because it can protect the cells from the nefarious effects of free iron, and has been implied in immune regulation (Recalcati et al., 2008, Theil, 1987). Generally, ferritin is a cytosolic protein, but has been described in mitochondria, nucleus and in serum (Levi et al., 2001, Thompson et al., 2002) (Levi et al., 2001). The cytosolic ferritin consists of a polypeptide with 24 protein subunits that compose
5
the apoferritin shell. This shell is capable of sheltering more than 4000 Fe3+ atoms and is
composed of two types of subunits: H-ferritin (FTH1) and L-ferritin (FTL). These subunits are found at different ratios in the apoferritin shell, on different organs. In humans, the genes coding for the two proteins that make the apoferritin shell are located in different chromosomes, the H in the eleventh chromosome and the L in the nineteenth (Worwood et al., 1985). In 1991 the structure of a ferroxidase moiety on the FTH1 protein was disclosed, leading to the understanding of the function on this subunit of ferritin (Lawson et al., 1991). This ferroxidase is responsible for the conversion of Fe2+ to Fe3+ allowing ferritin to sequester iron
inside the shell as a hydrous ferric oxide with a structure similar to the “ferrihydrite” (Chasteen and Harrison, 1999). This function is exclusively performed by the FTH1, since FTL does not have a ferroxidase center, making it incapable of oxidizing the iron. FTH1 is extremely important for the organism, as mice lacking Fth1 gene cannot survive while embryos (Ferreira
et al., 2000).
Although FTL lacks the iron-oxidizing capacity, it has other functions. The presence of L chains in ferritin improves the stability of the protein helping the iron incorporation activity (Luscieti
et al., 2010). The electron transport that helps the mineralization and demineralization of iron
on ferritin is also a specific function of the light chain (Carmona et al., 2014). The H subunits of ferritin, as mentioned before, are the ones that will oxidize the iron making it possible to be stored inside the shell. This process can be complex. The Fe2+ enters ferritin with the help
of an electrostatic gradient that attracts metal cations, and once internalized, the ferrous iron migrates to the ferroxidase center located on the heavy chain of ferritin. On this center, the Fe2+ atoms will react with hydrogen peroxide and will be oxidized into Fe3+ that, slowly, is going
to be hydrolyzed and mineralized as ferrihydrite (Arosio et al., 2015). These reactions protect the cell from the reactive species that can interact with other substrates and cause biological harm. Ferritin ensures that iron is immediately stored and detoxified, preventing the oxidative damage that could be caused by reactions like Haber-Weiss or Fenton.
As previously mentioned, ferritin can also be found in the serum (Wang et al., 2010). The functions or effects of serum ferritin are not known. Serum ferritin can be taken up by cells but their putative receptors in humans and mice are distinct. In the mouse, T cell immunoglobulin-domain and mucin-domain (TIM), more specific TIM2, can serve as receptor to serum FTH1, but not FTL, while in humans the FTH1 receptor is the TFR1 and FTL can enter the cells through scavenger receptor class A member 5 (Chen et al., 2005, Li et al., 2009, Li et al., 2010). Serum ferritin is thought to be a poor iron carrier but since each protein can carry more iron atoms than TF, it cannot be neglected as an iron delivery system. Serum ferritin is composed mainly by L subunits and very few H subunits (Cohen et al., 2010). It was seen that both hepatocytes and macrophages have the ability to secrete ferritin, but the mechanisms by which this happens remain inconclusive (Ghosh et al., 2004, Wang et al., 2010).One of the hypothesis is that ferritin is secreted through a non-classical secretory pathway on a process
6
that starts on the endoplasmic reticulum. The ferritin accumulates in the lysosomal compartment being secreted through the secretory-lysosomal pathway (Cohen et al., 2010). Variations in the serum ferritin levels can be clinically relevant. Ferritin is used to estimate iron levels in the body, either to identify iron overload conditions or to distinguish between different types of anemia. There are other health problems where serum ferritin can help the diagnosis, from Still’s disease to neurologic disorders and even cancer (Knovich et al., 2009).
The macrophage
Macrophages have several functions throughout the body. Even though these cells are best known for their role in host defense, due to the ability to act against invading pathogens, this is just one of the many roles played by them. Macrophages are also important in wound repair and tissue homeostasis. Consistently, macrophages are key players in the iron homeostasis. Erythropoiesis is the most iron-demanding process in vertebrate animals. Since erythrocytes only have a lifespan on average of 120 days, macrophages have to “recycle” the iron on these cells in order to comply with iron demands. Conversely, macrophages help the formation of new red blood cells by providing them with the recycled iron and with a supportive niche in the bone marrow known as “erythroblastic islands” (Chow et al., 2013).
Macrophages can either be tissue resident or bone marrow (BM)-derived. Tissue resident macrophages generally appear during embryogenesis and consist in groups of macrophages that populate different tissues, with different functions depending on site, and the ability of self-renewal (Davies et al., 2013). These macrophages can be found in nearly every tissue, as in the liver (Kupfer cells) or in the spleen (red pulp macrophages) (Cumano and Godin, 2007). BM-derived macrophages are produced throughout life and are dependent of hematopoietic stem cells (HSC). HSC originate monocytes through a complex process involving several intermediate progenitor cells (Geissmann et al., 2010). These monocytes can either stay as tissue resident macrophages in the bone marrow or disperse through the bloodstream to patrol the vascular endothelium or to aid in other tissues homeostasis (Zigmond and Jung, 2013).
Functions of the macrophage
Both tissue-resident macrophages and BM-derived macrophages have important and varied functions in different tissues. Macrophages are cells equipped to defend the organism against all sort of hazardous agents. Besides the ability of phagocytosing pathogens and inducing inflammation at the site of infection, macrophages can participate in the adaptive immunity by presenting antigens to T cells (Getz, 2005). Tissue-resident macrophages have different functions depending on their residence (Table 1). Kupffer Cells and red pulp macrophages have an upmost important role in iron metabolism. They phagocyte red blood cells recycling the heme molecule, releasing iron and making it available for further re–use (Kondo et al., 1988,
7
Kurotaki et al., 2015). In the BM, macrophages have key roles in numerous functions, as in the erythropoiesis or in the hematopoietic niche, supporting the HSC.
Table 1 - Tissue-resident macrophage and their functions (modified from (Varol et al., 2015)).
Cell Type Specific Organs to which Tissue
Macrophage belongs Function
Kupffer cell Liver Immunosurveillance Detoxification Iron and cholesterol recycling Red pulp macrophage Spleen Immunosurveillance Detoxification Iron recycling Antigen delivery to DCs Microglia Brain Immunosurveillance Clearing of cellular debris
Synaptic pruning during development and adulthood Peritoneal
macrophage Peritoneum
Immunosurveillance Support of IgA production
by peritoneal B1 cells Alveolar
macrophage Lungs
Immunosurveillance Support of IgA production
by peritoneal B1 cells
Macrophages in iron metabolism
As was previously said, macrophages play a key role in the iron metabolism (Fig. 2). After RBC maturation, they have approximately 120 days in circulation, being removed by macrophages in the spleen and liver. Kupffer cells and red pulp cells are extremely important in this process, since they can phagocytose senescent and damaged erythrocytes (Kondo et al., 1988, Kurotaki
et al., 2015). With the help of HMOX1, these macrophages remove the iron inside the heme
group present in the erythrocytes (Fig. 2). This iron will return to the BM to be re-incorporated in the forming erythrocytes, and stored by ferritin. Macrophages can also release ferritin through exocytosis in order to “feed” iron to the erythroid precursors (EP) (Leimberg et al., 2008). EP engulf ferritin, releasing iron intracellularly through acidification and proteolysis, making it available for heme synthesis (Leimberg et al., 2008). Supplying iron to the EP is not the only way through which macrophages help the erythropoiesis. BM tissue-resident macrophages, known as nurse macrophages, support erythropoiesis by stimulating proliferation and survival of the erythroblast (nucleated red blood cell) (Chow et al., 2013). Also, macrophages phagocytose and digest the nuclei of these cells with the help of DNase II (de Back
8
Macrophages also participate in the manipulation of iron metabolism aiming at the protection of the host against pathogenic agents (Cassat and Skaar, 2013). The main goal of this strategy is to deny iron to pathogens, leading to what is known by nutritional immunity (Soares and Hamza, 2016). In the case of extracellular pathogens, it will be beneficial to the host to lower the amount of iron found extracellularly, by storing it inside the cells. This can be achieved by either scavenging heme through haptoglobin and hemopexin, or by reducing FPN and inducing TFR and HMOX1 (Parrow et al., 2013). The iron is then stored by ferritin. On the other hand, in the case of intracellular pathogens, like Mycobacteria, macrophages can try to deny iron either by suppressing heme entrance in the cell (TFR modulation) or increasing its release (through NRAMP-1 and DMT1). Iron already released from heme can either be exported by FPN or stored in ferritin. Release of iron from macrophages can lead to an induction in nitric oxide synthase (NOS2A) which contribute to the microbicidal activity of macrophages (Soares and Hamza, 2016).
The aim of this thesis’ work is to study the role of FTH1, in BM-derived macrophage physiology. Since this protein is a key player in iron homeostasis, the cell viability and iron handling capacity will be the main focus of the study.
9
Chapter 2
Objectives
The main goal of this thesis work was to evaluate the role of FTH1 in macrophages biology. To achieve that we used a new experimental model consisting of mice with a conditional deletion of H-ferritin in cells of the myeloid lineage. We proposed to answer the following questions:
- Is Fth1 essential for the development and survival of BMM?
- Is the iron status of the macrophage influenced by the lack of Fth1? - What is the role of Fth1 in macrophages response to exogenous iron?
- How does Fth1 impact in the macrophages response to immune and microbial
11
Chapter 3
Materials and Methods
Chemicals
In general, all chemicals used were obtained from Sigma Aldrich (Sto Louis, MO, USA), unless specified. Particularly, for cell culture, the reagents were obtained from Gibco (Paisley, U.K.); for protein extraction, western blot and qPCR were obtained from Bio-Rad (Hercules, CA, USA); and flow cytometry antibodies were obtained from Biolegend, San Diego, CA, USA, unless stated otherwise. Phosphate buffered saline (PBS) was prepared in water with 9% sodium chloride (NaCl), 1.1% sodium hydrogen phosphate (Na2HPO4) and 0.2% potassium dihydrogen phosphate
(KH2PO4).
Animals
Conditional Fth1 deficient (Fth1Fl/Fl; Lyz2cre/+) mice, obtained by crossing Lyz2cre/+ mice
with Fth1Fl/Fl mice were kindly provided by Prof. Lukas Kuhn (Swiss Institute for Experimental
Cancer Research, Lausanne, Switzerland) (Darshan, Vanoaica, Richman, Beermann, & Kühn, 2009). In these mice, Cre recombinase deletes the Fth1 gene in cells expressing Lyz2 (cells of the myeloid lineage). Fth1Fl/Fl; Lyz2+/+ (Cre-) littermate mice were used as experimental
controls. The experiments described in this thesis were carried out with male mice between 12 to 18 weeks-old. All procedures were performed with the approval of Direção-Geral de Alimentação e Veterinária (DGAV), the Portuguese National Authority for Animal Health, and the persons involved in the experiments were credited for animal experimentation by FELASA (Federation for Laboratory Animal Science Associations) at levels B or C
Bone marrow-derived macrophages
Bone Marrow-derived Macrophages (BMM) were obtained from the bone marrow of the femur and tibia of the Fth1Fl/Fl; Lyz2+/+ and Fth1Fl/Fl; Lyz2cre/+ mice. The cells obtained were either
sufficient (Mo-Fth1+/+) or deficient (Mo-Fth1-/-) in H-ferritin, respectively. The animals were
sacrificed with isoflurane anesthesia followed by cervical dislocation, and both femurs and tibias were harvested. The bones were flushed with cold Hank’s Balanced Salt Solution (HBSS) centrifuged and resuspended with Dulbeccos’s Modified Eagle Medium (DMEM) supplemented with 1 M HEPES, 200 mM L-glutamine, 100 mM sodium pyruvate, 10% inactivated fetal bovine serum (FBS) (Gibco or Biowest, France) and 10% of L929 cell conditioned medium (LCCM) as a source of Macrophage Colony Stimulating Factor (M-CSF). Cells were cultured overnight at 37
12
oC, 7% CO
2 in a Nuclon plate (Thermo Fisher, Massachusetts, USA). Afterwards, the
non-adherent cells were collected with cold HBSS, centrifuged, resuspended with DMEM/10%LCCM to a density of 4x10⁵ cells/ml and seeded onto culture plates. At the 4th day of culture 10%
LCCM was added, and at the 7th day the whole medium was renewed.
Cell morphology
To evaluate if the two genotypes would have differences in cell morphology, cells were imaged every 24 h, during an entire experiment, to evaluate growth and morphology. The cells were visualized and photographed in an inverted optical microscope (Olympus SC30).
Cell viability
Cell metabolic activity:
Cell metabolic activity was measured by resazurin reduction. Briefly, 10% (v/v) of resazurin (0,3 mg/ml) was added to the cells and incubated for 20 h. The fluorescence of resorufin, resulting from the reduction of resazurin by metabolic active cells, was measured at λex=530
nm λem=590 nm in SynergyTM Mx (BioTek, Winooski, VT, USA).
Cell membrane permeability:
In order to assess cell membrane permeability, cells were washed with warm 5%FBS/PBS, and incubated with a mixture of a cell-permeable nuclear dye, for cell counting (Hoechst 33342, 1:12000, Invitrogen, Eugene, OR, USA) and a membrane-impermeable dye SYTOXTM Green
(1:45000, TermoFisher, Waltham, MA, USA), for 20 minutes at 37 oC and 7% CO
2, and washed
again. The cells were visualized and photographed in a controlled environment (37 oC, CO 2
atmosphere) with a 20x Nikon objective in a high-throughput automated fluorescence wide field microscope (IN Cell Analyzer 2000, GE Healthcare, Little Chalfont, UK). The images were then analyzed with Developer Toolbox 1.9.2 (GE Healthcare, Little Chalfont, UK).
Flow cytometry
To perform flow cytometry, the cells were collected at the 7th and 10th day of culture, labelled
with anti-mouse CD11b and anti-mouse F4/80 antibodies (1:200 and 1:100, respectively) in FACS buffer (1%FBS/PBS), and conjugated with AmCyan-A and APC-Cy7-A as fluorochromes, respectively. The samples were washed, the supernatant discarded and cells resuspended in FACS buffer. Samples were then analyzed using the BD FACSCantoTM II Bioanalyser (BD
Biosciences, San Jose, CA, USA) and with FlowJo software (FlowJo, LLC, USA). Cells were initially gated based on the size (forward scatter, FSC) and granularity (side scatter, SSC),
13
allowing single cells to be selected. Double positive cells for F4/80 and CD11b were considered fully differentiated macrophages.
Cell-treatments
Iron treatments were given to the cells at the 7th day of culture (day 0 post-treatment), at
different concentrations (0.1, 0.25, 0.5, 1, 5, 10, 15, 30, 60, 100, 200, 300, 400 and 600 μM). The iron compounds used were, ferric ammonium citrate (FAC), hemin (Frontier Scientific Inc, Logan, UT, USA) and an iron chelator, desferoxamine B mesylate (DFO). FAC and DFO were dissolved in PBS, and hemin was prepared as previously described (Silva-Gomes, et al., 2013). Briefly, hemin was dissolved in NaOH 0.2 M, the pH was adjusted to 7.4, and the volume was made up with distilled water. Recombinant mouse Interferon gamma (IFN-γ) (Gibco, MD, USA) was added at 16 ng/ml, at the 7th day of culture (day 0 post-treatment), and 2 more times with
a 24 h range. Lipopolysaccharide (LPS) was given at 10 ng/ml and diluted in DMEM/10%LCCM. Cell viability and morphology were evaluated 72 h after treatments, as described above.
TUNEL
Terminal deoxynucleotidyl transferase dUTP nick end labeling (TUNEL) assay was performed following manufacturer’s instructions (Roche, Basel, Switzerland). Briefly, 72 h post-treatment, cells were fixed with 4% paraformaldehyde (PFA) in PBS for 15 minutes, washed with PBS and incubated with permeabilisation solution (0.1% Triton X-100 in 0.1% sodium citrate) for 2 minutes at 4 oC. Afterwards, each sample was labelled with 50 µl of TUNEL reaction mixture (5
µl of TUNEL-Enzyme with 45 µl TUNEL-Label) and incubated for 1 h at 37 oC in a humidified
chamber in the dark. The cells were visualized and photographed with a 20x Nikon objective in a high-throughput automated fluorescence wide field microscope (IN Cell Analyzer 2000, GE Healthcare, Little Chalfont, UK). The images were then analyzed with Developer Toolbox 1.9.2 (GE Healthcare, Little Chalfont, UK).
ELISA
Mouse TNF-α ELISA Ready-SET-Go was performed following manufacturer’s instructions (TermoFisher, Waltham, MA, USA). First, Nunc Maxisorp® plates were coated with capture antibody (anti-mouse TNF-α purified) diluted in Coating buffer overnight. Afterwards, the plates were washed with wash buffer (0.05% Tween-20/PBS), blocked with Assay Diluent for 1 h at room temperature, and incubated with standards (Mouse TNF-α recombinant proteins) or samples (cells’ supernatants at 72 h of incubation with treatments), overnight at 4 oC. Detection
antibody (anti-mouse TNF-α Biotin), diluted in Assay Diluent, was incubated for 1 h at room temperature, followed by Avidin-HRP for 30 minutes at room temperature, substrate solution for 15 minutes at room temperature, and finally, stop Solution (1 M H3PO4). The absorbance
14
was read at 450 nm and 570 nm (for subtraction), on a µQuantTM Microplate Spectrophotometer
(BioTek Instruments, Winooski, VT, USA).
Griess
To evaluate nitrites production, Griess assay was performed using the cells’ supernatant. After 72 h of incubation with the different treatments, the medium was recovered, and incubated with Griess reagent (1% sulfanidamine, 0.1% naphthylenediamine dihydrochloride (NEDADHC), 1.72% phosphoric acid 85%, in water) in a proportion of 1:1, for 10 minutes. The standard curve was made using sodium nitrite (NaNO2). After incubation, the absorbance was read at 550 nm
on a µQuantTM Microplate Spectrophotometer (BioTek Instruments, Winooski, VT, USA).
Protein extraction
All the procedures were performed at 4 oC. The cell culture medium was collected and cells
were harvest with 5 mM ethylenediaminetetraacetic (EDTA)/PBS. Cells were then centrifuged and washed with cold PBS followed by another centrifugation. Afterwards, the cells were resuspended with collecting buffer (Ripa buffer: 150 mM NaCl, 1.0% NP-40, 0.5% sodium deoxycholate, 0.1% SDS, 50 mM Tris, pH 8.0), supplemented with dithiothreitol (DTT), phenylmethylsulfonyl fluoride (PMSF) and a protease inhibitor cocktail, followed by rupture with a 26–gauge needle. The protein suspension was then stored at -80 oC, prior sample
quantification (with DCTM protein assay) and preparation for western blot.
Western blot
Equivalent amounts of protein prepared in Laemmli buffer were separated by electrophoresis (30 mA per gel, with 10% SDS polyacrylamide gels (SDS-PAGE)) and electrophoretically transferred into an activated (methanol 10 seconds, water 5 minutes and transfer buffer for 15 minutes) polyvinylidene difluoride (PVDF) membrane for 90 min at 100 V. Membranes were blocked with 5%BSA in tris-buffered saline with Tween20 (TBS-T) (NaCl 150 mM, Tris 50 mM, Tween-20 0.1%) for 1 h at room temperature, followed by overnight incubation with the primary antibodies (FTH1, 1:500, Cell Signaling Technology, Danvers, MA, USA; β-actin, 1:5000, Abcam, Cambridge, UK) prepared in 1% bovine serum albumin (BSA)/TBS-T. The membranes were washed with TBS-T, and incubated with the secondary antibody (anti-rabbit, 1:10000, The Binding Site, Birmingham, UK) in 1%BSA/TBS-T for 1 h at room temperature. The imaging of the membranes was made using ChemiDoc (Bio-Rad, Hercules, CA, USA), with the help of horseradish peroxidase (HRP) (LuminataTM Milipore, Billerica, MA, USA) substrate. Membrane
15
RNA extraction
In order to extract RNA from the BMM we used PureLink® RNA Mini Kit, following the manufacturer’s instructions (AmbionTM, Invitrogen, Carlsbad, CA, USA). Briefly, lysis buffer,
supplemented with 1% β-mercaptoethanol, was added to the cells and samples were homogenized for 45 seconds. The centrifuged supernatant was transferred to a new tube and the same volume of ethanol 70% was added. After mixing, the whole volume was transferred to the mini-columns. The next step was to centrifuge at 1200 g for 15 seconds after a wash with “wash buffer I” and two washes with “wash buffer II”. The extracted RNA was eluted with RNAse-free water from the column to a proper tube. The samples were stored at -80 oC, prior
to conversion to cDNA and qPCR analysis.
qPCR
Table 2 – Primers list.
Gene Sequence Hprt forward 5’-GGTGGAGATGATCTCTCAAC-3’ Hprt reverse 5’-TCATTATAGTCAAGGGCATATCC-3’ Fth1 forward 5’-GCTGAATGCAATGGAGTGTGCA-3’ Fth1 reverse 5’-GGCACCCATCTTGCGTAAGTTG-3’ Ftl forward 5’-ACCTACCTCTCTCTGGGCTT-3’ Ftl reverse 5’-TGGCTTCTGCACATCCTGGA-3’
Slc40a1 forward 5’-TTGGTGACTGGGTGGATAAGAATGC-3’ Slc40a1 reverse 5’-CGCAGAGGATGACGGACACATTC-3’
Hmox1 forward 5’-GCCACCAAGGAGGTACACAT-3’
Hmox1 reverse 5’-GCTTGTTGCCCTCTATCTCC-3’
Tfrc forward 5’-GCAGCATTGGTCAAAACATGG-3’
Tfrc reverse 5’-GCTTTGGGCATTTGCAACCC-3’
Nos2a forward 5’-ACATCGACCCGTCCACAGTAT-3’
Nos2a reverse 5’-CAGAGGGGTAGGCTTGTCTC-3’
Arg1 forward 5’-CTCCAAGCCAAAGTCCTTAGAG-3’
Arg1 reverse 5’-CGAGCTGTCATTAGGGACATCA-3’
Tnf forward 5’-CCGTCAGCCGATTTGCTATCT-3’
Tnf reverse 5’-CGGACTCCGCAAAGTCTAAG-3’
The RNA was converted into cDNA with the First-Strand cDNA Synthesis Kit (NZYtech, Lisbon, Portugal) following the manufacturer’s instructions. The cDNA was stored at -20 oC before use.
To perform the qPCR, the samples were prepared with the probe (iTaq Universal SYBR Green – Bio-Rad, Hercules, CA, USA), and a specific pair of primers (forward and reverse) (Table 2). The qPCR was made on IQ5 (Bio-Rad, Hercules, CA, USA), where the cDNA was heated 5 minutes at 94 oC and entered a cycle that repeated 24 times the following: heat 30 seconds at 94 oC, 1
minute at 30 oC and 30 seconds at 72 oC. At the end of the cycle, the sample was heated for 5
minutes at 72 oC, and kept at 4 oC. Threshold cycles (CT) were obtained by the Bio-Rad iQTM5
software and normalized to the housekeeping gene, hypoxanthine guanine phosphoribosyl transferase (Hprt1) (ΔCT) (equation 1). Then, ΔCT was used to calculate ΔΔCT which was
16
further used to determine the n-fold difference relative to non-treated samples of Mo-Fth1+/+,
calculated with 2-ΔΔCT (equation 2).
∆CT (x or y)= CTgoi - CTgor (1)
2-∆∆CT= 2-(∆CT x - ∆CT y) (2)
goi – gene of interest; gor – gene of reference; x – goi from non-treated or treated Mo-Fth1+/+
or Mo-Fth1-/-; y – goi from non-treated Mo-Fth1+/+.
Data analysis
The concentration of FAC, hemin and DFO that inhibits 50% of the macrophage viability (IC50)
was determined by fitting the resazurin data with a four-parameter dose-response sigmoidal curve using GraphPad Prism 7 software (GraphPad Software, Inc, La Jolla, CA, USA).
Statistical analysis was performed as described in the figures’ legends using GraphPad Prism 7 (GraphPad Software, Inc, La Jolla, CA, USA). Statistical significance was obtained when p < 0.05.
17
Chapter 4
Results
1. Mo-Fth1
-/-develop normally from their precursors in the bone
marrow
1.1. The viability of BMM is the same regardless of the expression of Fth1
In order to evaluate the effect of the lack of Fth1 on macrophage differentiation from their precursors, BM cells were extracted from Fth1Fl/Fl; Lyz2+/+ and Fth1Fl/Fl; Lyz2cre/+ mice in order
to obtain sufficient (Mo-Fth+/+) and deficient (Mo-Fth-/-) macrophages in H-ferritin. BMM
viability was evaluated through resazurin reduction. Resazurin is a blue non-fluorescent dye capable of permeating the cell membrane. Once inside the cell, it can be reduced into resorufin (pink and fluorescent) by viable cells with active redox metabolism. As can be seen in figure 4, the cells’ viability did not differ between the two genotypes regardless of the day of culture.
Figure 4 – BMM viability is not dependent of Fth1 expression. Cell viability of Mo-Fth1+/+ (black bars)
and Mo-Fth1-/- (grey bars) was measured at 4, 7 and 10 days after the beginning of the culture. At those
time-points, resazurin 0.3 mg/ml was added at 10% (v/v) and after 20 h the fluorescence was measured at 530/590 nm. The graphs represent the mean + standard deviation (SD) (n[Mo-Fth1+/+] = 7; n[Mo-Fth1
-/-] = 14).
1.2. Mo-Fth1
-/-express the same levels of macrophage surface markers
than Mo-Fth1
+/+At different time-points (7th and 10th days), the development and differentiation of the cells in
culture were evaluated by flow cytometry, using the cells’ size and granulosity and two well-known macrophages’ surface markers: F4/80 and CD11b. F4/80 is a well-characterized membrane protein and is a homolog to epidermal growth factor (EGF)-like module-containing
18
mucin-like hormone receptor-like 1 (EMR1) of humans. This protein is used as a macrophage marker since 1981, when it was found that it was expressed during macrophage differentiation in culture (Austyn and Gordon, 1981). CD11b, also known as macrophage-1 antigen (Mac-1), is a macrophage cell surface antigen, of the integrins’ family (Podolnikova et al., 2016).
The results obtained from flow cytometry analysis indicate that both Mo-Fth1+/+ and Mo-Fth1-/-
mature similarly, as there were almost no differences in the markers’ expression and cells’ size (Fig. 5). Besides, at the 7th day of culture both macrophages genotypes (93% - Mo-Fth1+/+ and
92% - Mo-Fth1-/-) had already matured (meaning the macrophages have differentiated) from
their precursors. Since, in both cultures, the cells had matured at this time-point, subsequent experiments were performed 7 days after the beginning of the culture.
Figure 5 – H-ferritin deficiency does not impact macrophage differentiation. At days 7 and 10 of
culture, BMM were stained for the myeloid markers F4/80 and CD11b and analyzed by flow cytometry. A) Flow cytometry plots of CD11b and F4/80 staining of Mo-Fth1-/- and Mo-Fth1+/+ at the two time-points.
Percentages indicate the frequency of CD11b+ F4/80+ cells. B) Histogram plots of Mo-Fth1-/- (dotted grey
line) and Mo-Fth1+/+ (solid black line) for F4/80 (left panel) and CD11b (middle panel) markers, and cell
size (FSC, right panel). One representative experiment out of two is shown.
1.3. The morphology of Mo-Fth1
-/-and Mo-Fth1
+/+are undistinguishable
To analyze cell morphology, the cultures were imaged once a day during the entirety of the experiment. From the first day to the 8th day, the cells started from a round shape to a more
flattened one (Fig. 6A). Another difference visualized was the cells’ enlargement during maturation, starting to gain filamentous protrusions extending from the main body. The changes described, happened to both Mo-Fth1+/+ and Mo-Fth1-/- at the same time. From the 8th
day to the last day of culture (10th day), changes in morphology, were less visible (Fig. 6B).
There was a loss of cell density, and some macrophages start to gain a rounder shape again. The number of cell ramifications increased with time. These phenotypes seem to be occurring in the two genotypes, as there were no significant differences between them.
19
Figure 6 – Mo-Fth1-/- and Mo-Fth1+/+ have similar morphologies. Light microscopy images of BMM at A) 8
and B) 10 days after the beginning of the culture. Pictures shown here are representative of four independent experiments. The cells were visualized and photographed in an Olympus SC30 camera.
1.4. FTH1 is not expressed in Mo-Fth1
-/-The animal model used in these studies was designed so that the Fth1 gene is deleted in all cells of the myeloid lineage. In order to confirm that there was no expression of FTH1 in
Mo-Fth1-/- western blot analysis for this protein was performed at the 10th day of culture. The
results confirmed that FTH1 was absent from Mo-Fth1-/- (Fig. 7).
Figure 7 – Mo-Fth1-/- do not express H-Ferritin. A) 10 days after the beginning of the culture, BMM were
harvested, total protein quantified and H-ferritin (FTH1) expression was determined by Western blot. β-actin (ACTB) was used as housekeeping protein (loading control). These results are representative of two independent experiments. B) The graph represents the densitometry analysis obtained with ImageLabTM
software of FTH1 expression in each culture, normalized to ACTB densitometry, expressed as percentage to Mo-Fth1+/+. Statistical analysis was performed using an unpaired t test. * p < 0.05 statistically