Miguel Veiga Miranda
Master of ScienceVR Exergames for ocular
diseases diagnosis
Dissertation submitted in partial fulfillment of the requirements for the degree of
Master of Science in
Computer Science and Engineering
Adviser: Filipe Sousa, Head of Connected Things,
Fraunhofer AICOS
Co-adviser: Sofia Carmen Faria Cavaco, Associate
VR Exergames for ocular diseases diagnosis
Copyright © Miguel Veiga Miranda, Faculty of Sciences and Technology, NOVA Univer-sity Lisbon.
The Faculty of Sciences and Technology and the NOVA University Lisbon have the right, perpetual and without geographical boundaries, to file and publish this dissertation through printed copies reproduced on paper or on digital form, or by any other means known or that may be invented, and to disseminate through scientific repositories and admit its copying and distribution for non-commercial, educational or research purposes, as long as credit is given to the author and editor.
Ac k n o w l e d g e m e n t s
I want to thank everyone why has participated in my life throughout this whole process. And a special thanks to:
• Filipe Sousa and Alberto Carvalho for being my advisors and helping build and finish this project;
• Professor Sofia Cavaco for being my advisor at college;
• Faculdade de Ciências e Tecnologias da Universidade Nova de Lisboa for being the institution where I graduated;
• Fraunhofer AICOS for accepting me on this dissertation;
• My colleagues from Fraunhofer AICOS, who helped me throughout my dissertation journey;
• My colleagues from FCT for all the good and the bad moments we had together, especially Pedro Correia, André Santos, Nuno Pulido, and Lara Borisoglebski;
• My parents for taking care of me throughout all my life;
• My aunt and godmother Cristina Veiga for always being there when I needed, help-ing me through a lot of thhelp-ings and for behelp-ing so friendly.
A b s t r a c t
According to the World Health Organization, in 2011 there were about 314 million people with impaired vision, due either to ocular diseases or uncorrected ocular errors. Around 45 million people, of these 314 million, are blind. About 75% of all blindness and visual impairment cases caused by these diseases are avoidable. There are already some practical and relatively cheap tools to make this diagnosis, but all of them are intrusive, which doesn’t make them too attractive.
To solve this issue, we thought of a non-intrusive way to diagnose eye problems. So we created a Virtual Reality exergame,EyeCare, that tests users’ vision, while they are having
fun playing it. This exergame is meant to be played by teenagers and young adults, using only a smartphone and Virtual Reality visor.
EyeCare consists in a game where users have to complete several puzzles to escape the
forest. The users play the puzzles to assess their astigmatism, contrast sensitivity, color blindness, and peripheral vision. In the end, the results are given to the users as problems that they may have.
With this solution, our goal is to diagnose diseases early enough, so they can be monitored, and thus reducing the number of people with impaired vision and blindness.
R e s u m o
Segundo a World Health Organization, em 2011 existiam cerca de 314 milhões de pessoas com problemas de visão, devido a doenças oculares ou erros de visão não corrigi-dos. Cerca de 45 milhões dessas 314 milhões de pessoas eram cegas. Aproximadamente 75% dos casos de cegueira e problemas de visão, causados por estas doenças, podem ser evitados. Já existem várias ferramentas práticas e relativamente baratas para fazer este diagnóstico, mas todas elas são intrusivas, o que não as torna muito atrativas.
Para este problema, pensou-se numa forma não intrusiva de diagnosticar problemas de visão. Para isso criámos umexergame de Realidade Virtual, EyeCare, que testa a visão
dos utilizadores, enquanto eles se divertem a jogar. Esteexergame foi desenvolvido para
ser jogado por adolescentes e jovens adultos, usando só um smartphone e um visor de Realidade Virtual.
OEyeCare consiste num jogo em que os utilizadores têm de completar vários puzzles
para escapar da floresta. Os utilizadores resolvem os puzzles e ao mesmo tempo vai-lhes sendo avaliado alguns possíveis problemas de visão. No final, os resultados são mostrados aos utilizadores como forma de identificar possíveis problemas de visão que eles possam ter.
Com esta solução, o nosso objetivo é diagnosticar doenças visuais o mais cedo possível, para que possam ser monitorizadas, e assim reduzir o número de pessoas com problemas visuais e cegueira.
C o n t e n t s
List of Figures xv
List of Tables xvii
Glossary xix
Acronyms xxi
1 Introduction 1
1.1 Motivation and Context . . . 1
1.2 Problem and Objectives . . . 2
1.3 Solution . . . 3
2 Background and Related Work 5 2.1 Background, Technology and Tools Description . . . 5
2.1.1 What is Virtual Reality? . . . 5
2.1.2 How does Virtual Reality work? . . . 6
2.1.3 Different types of hardware used to experience Virtual Reality . . 7
2.1.4 Advantages of Virtual Reality . . . 10
2.1.5 Exergames . . . 10
2.1.6 What is Gamification? . . . 12
2.1.7 Game Design Process . . . 12
2.1.8 Eye Conditions . . . 13
2.2 State of The Art . . . 16
2.2.1 Examples of existing exergames that use VR . . . 16
2.2.2 Gamification to improve technology adoption . . . 18
2.2.3 Games for vision disorders detection . . . 18
2.2.4 Online tests for vision disorders . . . 20
3 Solution 25 3.1 Development Software . . . 25
3.2 Used Hardware . . . 26
3.3 Description . . . 27
C O N T E N T S 3.5 Implementation . . . 29 3.5.1 Story . . . 29 3.5.2 Puzzles . . . 29 3.5.3 End game . . . 36 3.5.4 Movement . . . 37 3.5.5 Interaction . . . 38
4 Solution tests and validation 39 4.1 Testing Environment . . . 39 4.2 Tested scenarios . . . 39 4.2.1 Pre-testing . . . 39 4.2.2 Lisbon Testing . . . 39 4.2.3 Porto Testing . . . 40 4.3 Inclusion Criteria . . . 40
4.4 User Testing Group . . . 40
4.5 Results . . . 40
4.5.1 Feedback about the gameplay . . . 40
4.5.2 Usability . . . 41 4.5.3 Validation . . . 44 4.6 Summary . . . 45 5 Conclusion 47 5.1 Main Contributions . . . 48 5.2 Future Work . . . 48 Bibliography 49 Annexes 55
I Usability Test Protocol 55
L i s t o f F i g u r e s
1.1 EyeCare concept. . . . 4
2.1 Existent types of VR. . . 9
2.2 Game Design Diagram. Adapted from [23]. . . 13
2.3 Comparison between Normal Vision and Vision with Myopia. . . 14
2.4 Comparison between Normal Vision and Vision with Astigmatism. . . 14
2.5 Comparison between Normal Vision and Vision with Contrast Sensitivity Problem . . . 15
2.6 Comparison between Normal Vision and Vision with Deuteranopia. . . 15
2.7 Comparison between Normal Vision and Vision with Tunnel Vision. . . 16
2.8 Images ofVRun game. Adapted from [31]. . . . 17
2.9 Senior playing the Exergame for PWD. Adapted from [32]. . . 17
2.10 Screenshot from DoDo game. Adapted from [38]. . . 19
2.11 Visual Acuity tests. . . 21
2.12 Astigmatism tests. . . 21
2.13 Contrast Sensitivity tests. . . 22
2.14 Color Blindness tests. . . 22
2.15 Screenshot from Visual Field Plotter test. Adapted from [46]. . . 23
3.1 Samsung Galaxy S7. . . 26
3.2 Denver VR Box Kit (Images from their website). . . 27
3.3 What is required to play. . . 28
3.4 Sequence of the game. . . 29
3.5 Visual Acuity Puzzle. . . 30
3.6 Visual Field Puzzle. . . 31
3.7 Astigmatism Puzzle. . . 32
3.8 Pelli-Robson Chart. . . 33
3.9 Contrast Sensibility Puzzle. . . 34
3.10 Color blindness Puzzle. . . 35
3.11 Final Color Blindness Puzzle. . . 36
3.12 Problem with astigmatism in the right eye. . . 37
L i s t o f F i g u r e s
4.1 [Game Score] In the pie chart, we can see the number of persons that gave each score, and in the bar chart, we have the same information but divided by groups of ages. . . 42 4.2 [Story score] In the pie chart, we can see the number of persons that gave
each score, and in the bar chart, we have the same information but divided by groups of ages. . . 42 4.3 [Gameplay score] In the pie chart, we can see the number of persons that gave
each score, and in the bar chart, we have the same information but divided by groups of ages. . . 43 4.4 [Puzzles score] In the pie chart, we can see the number of persons that gave
each score, and in the bar chart, we have the same information but divided by groups of ages. . . 43 4.5 In this pie chart, we can see how many users experienced motion sickness. . 44 4.6 In the pie chart, we can see the number of persons that would rather play the
game over going to a doctor, and in the bar chart, we have the same information but divided by groups of ages. . . 44 4.7 In this pie chart, we can see how accurate our solution was. . . 45
L i s t o f Ta b l e s
2.1 Different types of VR . . . 8 3.1 Difference between Unity and Unreal . . . 25 4.1 User Testing Group . . . 40
G l o s s a r y
Accelerometer Smartphone tool that measures acceleration, and tells the smartphone where it is pointing (works with Magnetometer and Gyroscope) AMD A disease which leads to blurred vision or no vision in the center of the
visual field
App Computer software, usually small, that is used by smartphones
Astigmatism Causes the vision to be blurred at all distances
Cataracts Clouding of the lens in the eye, that cause a decrease in vision
Cornea The transparent front part of the eye that covers the iris, pupil and anterior chamber
Cybersickness Causes symptoms similar to motion sickness symptoms. May occur when there are some discrepancies in the display of the image
Deuteranopia Green color blindness
Diabetic retinopathy Eye disease, caused by diabetes, that can cause blurry vision, vision loss and, sometimes, blindness
Ergonomics Consists of a set of subjects that aims to develop and apply techniques for adapting elements of the work environment to the human being, and generating worker well-being, and consequently increasing pro-ductivity
Eye-tracking To find where someone’s eyes are looking at and the way they are mov-ing, measuring their activity
Field of View This is the observable area that a user can see at any given moment. In this context, it takes place inside the HMD
Frame Rate Another name that is given to Frames per second (fps)
Frames per second How many images appear in the screen per second, processed by the GPU
G L O S S A RY
Glaucoma An eye disease that can cause eye pain, mid-dilated pupil, redness of the eye and vision loss
GPU Computer chip designed to render graphics or images
Gyroscope In this context, it is a smartphone tool that helps the accelerometer understanding where the first is orientated (works with Accelerometer and Magnetometer)
High-end High-quality products that, relative to other products of the same type, are overpriced
Hyperopia Inability to see objects clearly that are up close
Intrusive Affecting someone in a way that makes them feel uncomfortable Magnetometer Smartphone tool that says which way is north, using its voltage output
(works with Accelerometer and Gyroscope)
Myopia Inability to see objects clearly unless they are relatively close to the eye
Protanopia Red color blindness
Real-time The machine receives data, processes it and makes it available for some-one to see, almost instantly
Refractive Errors Errors with the shape of the eye, usually resulting in blurred vision
Smartphone A mobile phone that connects to the internet and where apps can be installed
Stereoscopy A technique used to enable a 3D effect, adding an illusion of depth to a flat image
Teleportation/teleport Moving instantly from one place to another
User The person who utilizes the computer or the smartphone
Ac r o n y m s
3D Three Dimensional
3DoF Three Degrees of Freedom 6DoF Six Degrees of Freedom
AMD Age-related Macular Degeneration
FOV Field of View Fps Frames per second
GPU Graphics Processing Unit
HMD Head-Mounted Display
LCD Liquid Crystal Display
C
h
a
p
t
e
r
1
I n t r o d u c t i o n
This work is licensed under the Creative Commons Attribution-NonCommercial 4.0 International License. To view a copy of this license, visit http://creativecommons.
org/licenses/by-nc/4.0/.
1.1
Motivation and Context
As the years go by, the population tends to increase in number and so do people with visual impairment and blindness [1]. Forecasts made by World Health Organization (WHO) in 2007, say that the number of visually impaired people would double from 1990 to 2020. It was also estimated that seven million people become blind each year and that this number was increasing by one to two million per year.
More importantly, around 75% of all blindness and visual impairment cases in the world are avoidable if diseases are diagnosed early enough and then monitored. Also, 82% of all blind people are aged 50 or above, despite this group being only 19% of the world’s population.
There are diseases that, even though they are easy to detect, may impact someone’s life. These diseases have more impact on teenagers and young adults, since it may cause social exclusion, bad school performance and less productivity.
Uncorrected refractive errors, which are errors with the shape of the eye, usually resulting in blurred vision, cataracts, and age-related macular degeneration (AMD) are the top causes for visual impairment [2]. Cataracts are a clouding of the lens in the eye that causes a decrease in vision. AMD is a disease that leads to blurred vision or no vision in the center of the visual field. Uncorrected refractive errors are also the top cause of blindness, as well as glaucoma, an eye disease that can cause eye pain, mid-dilated pupil, redness of the eye and vision loss. When diagnosed early enough, some of these diseases
C H A P T E R 1 . I N T R O D U C T I O N
and some others can be cured or have their progression prevented, resulting in a reduced number of visual impairment and blindness cases.
This project is being developed in the context of a company,Fraunhofer. Fraunhofer
is a non-profit private association that focuses on applied research. Its more recent eye related project isOphtha, which is a smartphone-based device that captures retinal images
and diagnoses eye diseases.
1.2
Problem and Objectives
Since the number of ophthalmologists per person in each country is low [3], it makes harder for someone to have access to an ophthalmologist. Because there are few doctors, this results in long waiting queues to schedule an appointment, and small towns may not have this specialist, forcing people living there to travel long distances.
Doctors advise people to visit an ophthalmologist at least once every ten years for people under 40 years old, once every five years for people under 55 and once every two or three years for older people [4, 5]. Furthermore, people who have some vision problems should pay a visit more often. Some countries respect this visit to the doctor more than others. The big problem is that most countries, 21 out of 27 according to [6], have 19% or more of their population not visiting an ophthalmologist ever, in their lifetime.
The fact that most medical equipment works in an intrusive way, by flashing lights at the patient’s eyes or by pouring some substance on it, may make patients flinch when they think about visiting a doctor. By intrusive, it means affecting someone in a way that makes them feel uncomfortable. Some methods adopted by ophthalmologists to diagnose visual problems can even create other problems; for example, drugs used to dilate the pupil may cause glaucoma [7].
There are already some products on the market that are more affordable than the standard ophthalmological equipment while doing a reasonably good job in terms of diagnosing some eye diseases. By reasonably good job I understand that they are accurate. Still, they are very diverse, and it becomes a problem when trying to implement one of them adopt it in medical practice. Another problem is that they still work in an intrusive way, so they are not very attractive. Our solution, to be further detailed, does not have such an intrusive approach.
Our main goal is to prevent the progression of eye diseases by diagnosing them early enough. Consequently, reducing the number of these visual impairment and blindness cases worldwide, starting on a younger audience. The means to achieve this goal is to create something that can solve as many problems as possible, posed before. So, it is useful to develop a smartphone app, which tests patients’ eyes for visual impairment, that can be available to everyone and, at the same time, that people accept to use it.
1 . 3 . S O LU T I O N
1.3
Solution
There are ocular diseases that can be detected through some tests. Examples of these symptoms are astigmatism, loss of peripheral vision, not being able to distinguish differ-ent colors and having problems distinguishing objects with low contrast difference.
Our solution aims at finding a way to entertain the users (which, in this case, are the people who utilize our solution with a smartphone) while their vision is being tested. By smartphone I mean, a mobile phone that connects to the internet and where apps, which are small computer software, can be installed. Testing the vision can be a little tedious, so we want users to feel entertained, and also to promote eye health.
The app created is calledEyeCare (Fig. 1.1), and besides entertaining the users, it
applies visual tests at the same time. In the end, results are presented to the users. This idea works better in a Virtual Reality (VR) world, where it is easier to track the users’ eye while making sure the app guides them to perform the visual tests. The VR game is different from current solutions since users will be engaged in a virtual world, exploring and having fun with it, and not just looking to a standard board, sometimes with strong lights pointing to their eyes. Our target audience is teenagers and young adults so, to make this idea fun and more attractive, we decided to bring the concept of a game.
By using the concept of an exergame toEyeCare, we can collect data while the users
are playing the game, such as the choices they make. This exergame has implemented some of the existing visual tests that do not require any intrusive methodologies for more extensive diagnosis. Those tests will be masked as puzzles for the users to have fun while playing our game. This is one of the gamification ideas we will be using. EyeCare was
designed to be played at home to give users a visual acuity status, providing an early diagnosis before they go to a doctor.
EyeCare can be considered both as eye-health promotion and for prevention since,
after the diagnosis, the disease can be closely monitored by ophthalmologist and prevent acute episodes. We also want to contribute with a Virtual Reality game that can diagnose eye problems.
C H A P T E R 1 . I N T R O D U C T I O N
Figure 1.1: EyeCare concept.
C
h
a
p
t
e
r
2
Ba c k g r o u n d a n d R e l a t e d Wo r k
2.1
Background, Technology and Tools Description
2.1.1 What is Virtual Reality?
Virtual Reality, also known as VR, is an interactive experience that happens inside a computer-simulated environment. Instead of being in front of a screen, users are im-mersed in a 3D world, with which they can interact in a lot of different ways [8]. A good VR experience makes users believe they are in the virtual world; that is why it is said to be immersive. This can be achieved when enough senses are stimulated. These senses include vision, hearing, touching, even smelling sometimes. The more senses are stimulated, the more immersed users are expected to be.
Relatively new to the market, several companies are creating different ways for users to have a VR experience. They seem to differ mostly in terms of price, comfort, interactivity with the virtual environment and level of immersion [9].
• The first VR Head Mounted Display (HMD) was invented in 1968 to be used in immersive simulation applications. It was so heavy that it had to be suspended on the ceiling, and it only showed wire-frame model rooms. It was calledThe Sword of Damocles.
• From 1970 to 1990, VR was mainly used for scientific and training purposes like medical, flight simulation, automobile design, and military training.
• In the 1990s, there was the first widespread in the commercial release of VR head-sets. Brands likeSega, Nintendo launched their VR back then.
• More recently, big names of VR were released. In 2010Oculus Rift was first designed.
C H A P T E R 2 . BAC KG R O U N D A N D R E L AT E D WO R K
Sony released PlayStation VR [10] and Samsung announced Samsung Gear VR. From
that date onwards, many companies began developing their headsets. For example,
HTC developed HTC Vive and Google developed Google Cardboard.
• Nowadays, VR is most commonly used in entertainment. It is also widely used in robotics, social science and psychology, medicine, training, and educational pur-poses.
2.1.2 How does Virtual Reality work?
First, a screen is displayed in front of the user’s eyes, to eliminate the sense of the real world [11]. A video is sent to the screen by either HDMI cable connected to a computer or by using the smartphone’s screen itself. This video consists of two separated 2D images that are reshaped through auto-focus lenses placed between the screen and the user’s eye, to create a stereoscopic 3D image. Stereoscopy is a technique used to enable a 3D effect, adding an illusion of depth to a flat image.
To create an immersive VR experience there are some requirements, a frame rate of at least 60 frames per second (fps) and a minimum of 100 degrees of field of view (FOV). Frames per second, as well as frame rate, is how many images appear in the screen per second, processed by the Graphics Processing Unit (GPU). By GPU I mean, a computer chip designed to render graphics or images. FOV is the observable area that a user can see at any given moment. In this context, it takes place inside the HMD. If the HMD does not meet these requirements, the user may experience cybersickness. This causes symptoms similar to motion sickness symptoms, and it may occur when there are some discrepancies in the display of the image. Matching images with sound is also essential in VR. The delayed or advanced sound may contribute to cybersickness. The better frame rate and the FOV are, the better is the experience for the user.
An important part of VR is its head tracking. Just as the name says, it tracks a user’s head in every possible move it makes. Head tracking techniques vary from HMD to HMD. In more basic versions, the technique used is 3Dof (three degrees of freedom), which allows users to rotate their heads 360º. In these cases, the virtual viewpoint is fixed, meaning movements like going back and forth or up and down are not tracked. On the other hand, a more complex and expensive version of HMD uses what is called 6Dof (six degrees of freedom). This allows users to do everything they could do with 3Dof, as also to move freely throughout the virtual environment.
Different components are used to track the user’s head, such as gyroscope, accelerom-eter, and magnetometer. These are tools, included in almost all smartphones, that help it understand where it is oriented, where it is pointing and in which direction is north, respectively.
When it comes to computer-generated VR, other things can be tracked. Motion track-ing is one of them. An example of this is when a person looks down, inside the VR, to see their hands. To make this possible, the user must hold one controller in each hand,
2 . 1 . BAC KG R O U N D , T E C H N O L O G Y A N D T O O L S D E S C R I P T I O N
and two or more base stations (sensors) must be placed around the room, so they can triangulate the 3D position of each controller. This not only allows users to see their hands inside the VR environment but also allows users to walk around physically and see their movement reproduced in the simulated environment (via HMD tracking).
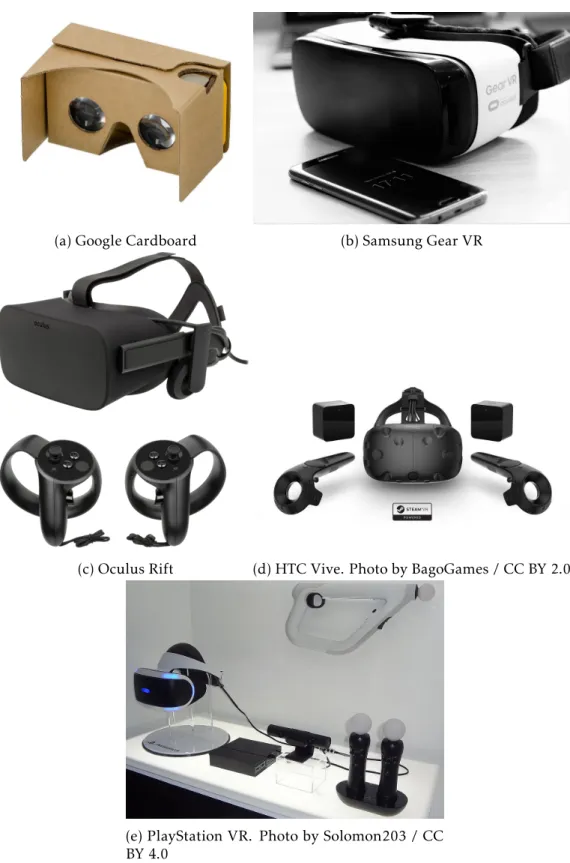
2.1.3 Different types of hardware used to experience Virtual Reality
There are several ways to experience Virtual Reality nowadays. Some are cheap and easy to use, and others are more expensive but amazingly immersive and interactive. The biggest names on the market are the following [8]:
• Google Cardboard: a simpler and cheaper version to have a VR experience (Fig. 2.1a). For $15 a person can buy a viewer and have the experience from their smart-phone. In this version, users can interact with the environment using their head rotation. Google Cardboard itself has various versions. Some of these versions may include a single button on the side of the viewer.
• Samsung Gear VR: this one is a little more expensive thanGoogle Cardboard and
only works on Samsung smartphones (Fig. 2.1b). From $80 to $120, this version
offers more comfort and interactivity. This comfort is due to its ergonomics and the quality of the image inside the VR. Ergonomics consists of a set of subjects that aims to develop and apply techniques for adapting elements of the work environment to the human being, and generating worker well-being, and consequently increasing productivity. Concerning interactivity, it has a touchpad on the right-hand side of the viewer, which allows the user to interact with the environment differently. The slightly more expensive version ofSamsung Gear VR also has a controller, which
the user can hold physically and see it inside the Virtual Reality environment. This further increases the interactivity between the user and the VR world, also increas-ing the possibilities of applications.
• PlayStation VR: Virtual Reality hardware designed for PlayStation (Fig. 2.1e). It offers some comfort and has embedded sensors like Accelerometer and Gyroscope [12], but users may experience cybersickness due to low-resolution images. PlaySta-tion VR combined with PlayStaPlaySta-tion controller or moPlaySta-tion controller offers a better experience [13]. The user may also buy a camera to increase the headset’s features and precision. This hardware is mainly used to play games or watch movies in VR. The headset only costs $200, while the controllers and the camera are bought separately.
• Oculus Rift & HTC Vive: both are the high-end versions of VR, high-quality prod-ucts that, relative to other prodprod-ucts of the same type, are much more expensive (Oculus Rift in Fig. 2.1c and HTC Vive in Fig. 2.1d). In these versions, the environ-ment is no longer simulated by a smartphone. Instead, it is simulated by a computer,
C H A P T E R 2 . BAC KG R O U N D A N D R E L AT E D WO R K
which allows a better quality of the image and a better performance. These factors lead to a more immersive and comfortable experience. UnlikeSamsung Gear VR,
both versions have two controllers, instead of only one. Nowadays, HTC and Oculus have many versions of their Head-Mounted Displays.
For example, Oculus has Rift, S, Quest and Go; and HTC has Vive, Vive Focus, Vive Pro and Vive Cosmos. Each version is different from the other, varying in specs, quality of image, mobility, and price. Some of these versions come with built-in headphones, for an enhanced experience. As the sound is an essential aspect in VR, these versions have a better sound than the previous ones. Some also come with tracking sensors to lay around in a room, so the user can walk in the virtual environment while walking in the physical environment.
Table 2.1 presents the information of each VR hardware described before. As we can see in the table, Interactivity, FOV, and Fps have the most significant changes as you increase the price, since one can have controllers in both mobile versions, for an extra price. We can also see that the quality of the hardware used increases when it is designed for a computer.
Table 2.1: Different types of VR
Name Interactivity Comfort Price Platform FOV fps Google Cardboard
Head Rotation, May have a button
Is not designed to have
much comfort Cheap (around $15) Smartphone 90º 60
Samsung Gear VR
Head Rotation, Controller, Touchpad
Designed with comfort More Expensive
(around $120) Smartphone 96º 60 PlayStation VR Head Rotation, Head Movement, Variety of Controllers
Designed with comfort High-End (+$200) PlayStation 100º 90
Oculus Rift HTC Vive Head Rotation, Head Movement, Walking Movement, Two Controllers
Designed with comfort High-End (+$600) Computer 110º 90
2 . 1 . BAC KG R O U N D , T E C H N O L O G Y A N D T O O L S D E S C R I P T I O N
(a) Google Cardboard (b) Samsung Gear VR
(c) Oculus Rift (d) HTC Vive. Photo by BagoGames / CC BY 2.0
(e) PlayStation VR. Photo by Solomon203 / CC BY 4.0
C H A P T E R 2 . BAC KG R O U N D A N D R E L AT E D WO R K
2.1.4 Advantages of Virtual Reality
As said before, Virtual Reality is used nowadays in a wide variety of subject matters. It is also a technology that is growing and is yet to show its full potential. Concerning the topic of eye tracking and eye disease diagnosis, the use of VR has some advantages:
• One eye can be tested at a time, turning off one of the images: this can be useful when testing if the user has visual problems related to visual acuities, like astigma-tism (Sec. 2.2.4);
• It may be more appealing for younger people to try: it is a new and fun technology, which will make people want to try it, achieving our goal;
• Although not being as accurate as medical equipment and not being able to replace it, Virtual Reality is cheaper: Virtual Reality can simulate some tests that can detect problems with a user’s vision;
• No need for a doctor to be present: on this game’s early screening, there is no need for a doctor to be present, as Virtual Reality can display the results itself. Although this only applies to this game’s early screening, not the general early screening. Also, it is essential for the presence of a doctor in the next stages;
• The screen is always close and at the same distance to the users’ eyes: this has its pros and cons. On the one hand, this allows us to test their visual acuity, as it covers most of the users’ peripheral vision. It also allows them to see clearly the game, even if they have disorders of visual acuity (explained in 3.5.2.1). On the other hand, we are not able to test disorders, such as myopia and hyperopia (2.1.8).
Also, studies have shown that eye screening is possible through Virtual Reality: Visual Field [14], Color Blindness [15].
2.1.5 Exergames
Exergames are videogames that combine physical activity with gaming, on a digital device [16]. A potential of exergames is that they can gather data in a non-intrusive way. More specifically, the player input, in the exergame, is captured by the device itself and allows researchers to access the data after the gameplay or in real-time. By real-time, it means that the machine receives data, processes it, and makes it available to see, almost instantly. This can be accomplished by using technology that tracks body movement. Exergames have increased in importance over the decades [17].
• They made their first appearance in the 1980s. The first two called exergames were •HighCycle and Virtual Racquetball, both developed by Autodesk. The first was a
game where a user biked through a virtual landscape; the second could have up to two players and be controlled by an actual racquet, hitting a virtual ball.
2 . 1 . BAC KG R O U N D , T E C H N O L O G Y A N D T O O L S D E S C R I P T I O N
• The first exergaming system released to the market wasComputrainer, in 1986. This
exergame was likeHighCycle, in which the user had to ride through a landscape,
while the system was monitoring the data, such as speed and force at which the user pedaled. This device too expensive to be seen as an entertainment product and was only bought by professional athletes.
• Nothing significant happened in the 1990s until 1998. Konami’s Dance Revolution
was the first significant success of exergaming. In this game, the user would step on each arrow according to what they saw on the screen, and dance at the sound of the music.
• The 2000s were the peak years of exergaming. It first became popular in the mass media in 2003, when Bill Gates showcasedExertris Interactive Gaming Bike, a fitness
bike. Since then, there were major appearances in the market.
• In 2005,EyeToy: Kinetic was released to PlayStation 2, which brought the first
multi-function exergame into people’s homes. It would detect the movement of the player using a camera.
• In 2006,Nintendo’s Wii brought acceleration detection through remote control and,
later in 2007; it broughtWii Fit. Wii Fit’s base component was its Wii Balance/Fit Board, on which the player stood during the exercises, such as yoga or jogging.
• The last decade brought more precise and more affordable hardware to the customer. There is not one specific game to mention, as many titles came out during this period. Nowadays it is used to monitor people through exercise, help people with diseases and make people entertained, promoting physical activity.
As exergames are becoming, over the years, more and more available to everyone, their impact and importance have been increasing. Initially thought and designed for entertainment purposes, nowadays it serves a higher purpose.
Studies made on the effects of exergames, with participants aged 55 or above, showed that they have several social-related outcomes [18]. They were categorized into three groups: emotion, behavior, and attitude related.
Loneliness was found to be the primary emotion-related outcome affected by ex-ergames. Studies showed that elderly people became less lonely after playing Nintendo Wii games, in comparison to playing board games or watching television. Older adults playing exergames with youths led to improve their attitude towards younger age people. Studies demonstrated that physical training exergames performed regularly increased musculoskeletal function, among other aspects [19]. Physical training exergames pro-mote self-perception of health status and make the user physically healthier. This is an important aspect because people tend to be more sedentary as the years go by.
As exergames are mostly games, they tend to attract people to try it and so to become healthier both mentally and physically, while having fun. Of course, games can become
C H A P T E R 2 . BAC KG R O U N D A N D R E L AT E D WO R K
an addiction, but since these make people do exercise, they are less harmful than normal games.
2.1.6 What is Gamification?
Gamification is applying video game characteristics, like scoring points or competition between players, to areas that have nothing to do with games. ‘gamification is exciting because it promises to make the hard stuff in life fun’ [20]. This means, making some tedious and challenging tasks no one likes to do, in a fun one that grants some sort of prize.
A good example is Pokémon Go, which led users to walk a lot, so they could get
their favorite virtualPokémon. [21] There are other examples of gamification but with
some competition. One example can be an app that tracks your steps and puts you in a leaderboard with many other people. Here, instead of walking for a prize, you walk to be the person who walked the most in a day, for example.
We will be using the concept of gamification, as we are going to transform vision tests into something more motivating, like puzzles. Also, we plan to give users some prize/reward each time they finish the game.
2.1.7 Game Design Process
Game design is mostly an artistic process. It may refer to a lot of things, such as story writing, creating characters or plot, designing the art style, choosing the gameplay, and so on [22].
There are different ways to design a game. One way includes six stages: Capture, Brainstorm, Prototype, Playtest, Iterate and Implement [23]. Each stage can be repeated, and they may not be consecutive. This can be observed in the diagram (Fig. 2.2).
• Capture: This is the stage of research. It is here that one studies what is going on in games in general and what people are looking for. It is also here that the technology, the art, and the history fields are studied. This stage will later inspire and give ideas.
• Brainstorm: Here one collects all the information gathered in the previous stage and starts introducing constraints and limits. More ideas may also appear in this stage, but its purpose is to focus on a handful of ideas and eliminate the others.
• Prototype: In this stage, one starts to create prototypes of the ideas. These proto-types are quick to make, and their purpose is to see whether the idea will work or not.
• Playtest: Following the prototype stage, this is when one or more people try the game and give feedback.
2 . 1 . BAC KG R O U N D , T E C H N O L O G Y A N D T O O L S D E S C R I P T I O N
• Iterate: After the playtest stage, one has feedback and data from playtesting. This data is used to improve the prototype until the developer is happy with it.
• Implement: This is where the game is implemented to be released to a broader audience to experience.
Figure 2.2: Game Design Diagram. Adapted from [23].
2.1.8 Eye Conditions
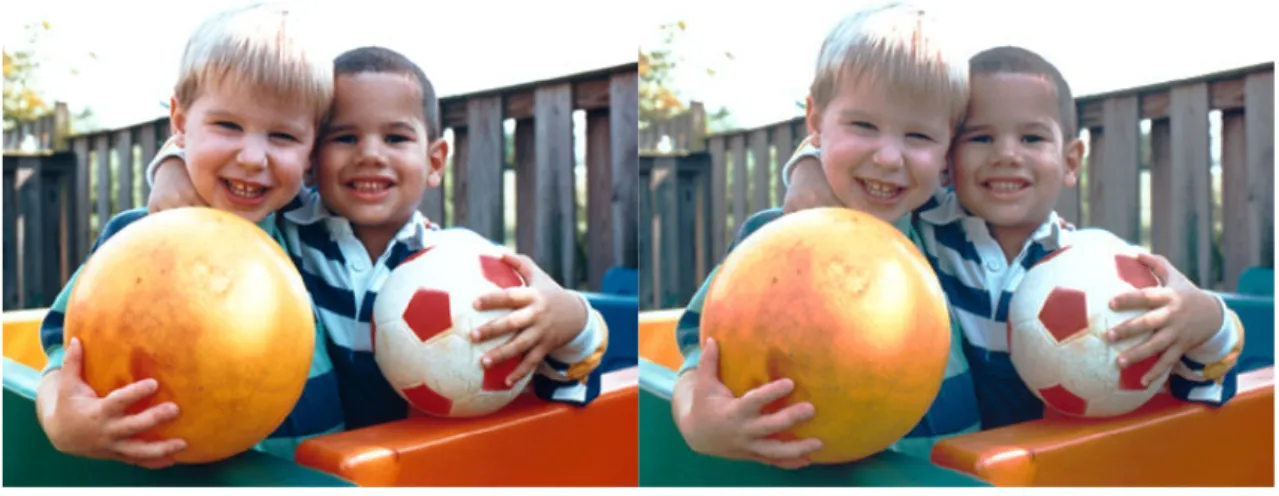
There are many eye conditions, but we are only interested in a few since our solution is not going to detect them all. The main problems we are interested in are Visual Acuity deficiency, Astigmatism, Contrast Sensitivity problems, Color Blindness, and Visual Field problems.
• Visual Acuity (Fig. 2.3) is a measurement of central vision and refers to the clarity of the vision [24]. This is influenced by vision problems such as Astigmatism, Hyperopia, and Myopia. Hyperopia, or Farsightedness, is the inability to see objects clearly that are up close. On the other hand, Myopia, or Nearsightedness, is the inability to see objects clearly unless they are relatively close to the eye. Astigmatism causes the vision to be blurred at all distances.
C H A P T E R 2 . BAC KG R O U N D A N D R E L AT E D WO R K
(a) Normal Vision. Image from [25] (b) Vision with Myopia. Image adapted from [25]
Figure 2.3: Comparison between Normal Vision and Vision with Myopia.
• Astigmatism (Fig. 2.4) is a type of refractive error that results in blurred vision at all distances [26]. The severity of the blur is determined by the magnitude of astigmatism. It may appear in three primary types: more correlated with Hyperopia, more correlated with Myopia or correlated with both.
(a) Normal Vision. Image from [25] (b) Vision with Astigmatism. Image adapted from [25]
Figure 2.4: Comparison between Normal Vision and Vision with Astigmatism.
• Contrast Sensitivity (Fig. 2.5) is the ability to detect different shading and to “distinguish between finer and finer increments of light versus dark” [27, 28].
2 . 1 . BAC KG R O U N D , T E C H N O L O G Y A N D T O O L S D E S C R I P T I O N
(a) Normal Vision. Image from [25] (b) Vision with Contrast Sensitivity problem. Im-age adapted from [25]
Figure 2.5: Comparison between Normal Vision and Vision with Contrast Sensitivity Problem
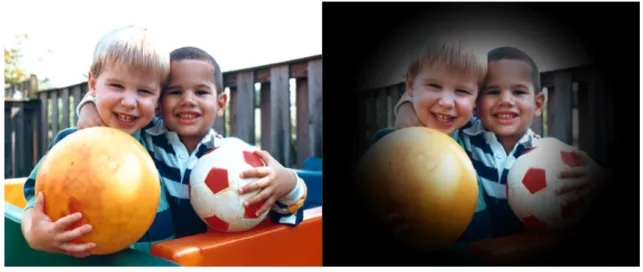
• Color Blindness (Fig. 2.6) is the inability to distinguish specific colors [29], and it may vary in severity. The more severe it is, the less able to distinguish colors the person will be. There are three main types of color blindness: Protanopia, Deuteranopia, and Tritanopia. Protanopia and Deuteranopia are two types of red-green color blindness, where people affected by Protanopia are less sensitive to the red light and people affected by Deuteranopia are less sensitive to green light. Tritanopia, being the rarest of these three cases, affects people in a way they are less sensitive to the blue light.
(a) Normal Vision. Image from [25] (b) Vision with Deuteranopia. Image adapted from [25]
Figure 2.6: Comparison between Normal Vision and Vision with Deuteranopia.
C H A P T E R 2 . BAC KG R O U N D A N D R E L AT E D WO R K
that results in loss of peripheral vision [30]. This means, having specific areas of the vision as blind spots. More severe cases may seem like the person is looking through a narrow tube, usually referred to as tunnel vision.
(a) Normal Vision. Image from [25] (b) Vision with Tunnel Vision. Image adapted from [25]
Figure 2.7: Comparison between Normal Vision and Vision with Tunnel Vision.
2.2
State of The Art
2.2.1 Examples of existing exergames that use VR
These are examples of exergames that were created to gather information on people with diseases or just to entertain them.
• VRun: This VR exergame works onGoogle Cardboard. The experience was designed
for the users to run on the spot while running and making progress in the virtual world (Fig. 2.8) [31]. The users had to run through a level with ten obstacles, which they had to surpass by either waiting for the obstacle to pass or to run faster to beat it. The smartphone’s accelerometer was used to detect the users as they ran in the spot.
This exergame was part of a test made in three devices: a laptop (small screen), a projector (big screen) and in an HMD (Virtual Reality). In the first two, the users were required to have a smartphone in their pocket. Users found laptop and HMD more practical than the projector and scored better overall on HMD. This demonstrated potential towards the HMD.
2 . 2 . S TAT E O F T H E A R T
(a) Screenshot from the HMD version (b) Overview of theVRun level
Figure 2.8: Images ofVRun game. Adapted from [31].
• Exergame for PWD: This was an exergame specially made for PWD (People living With Dementia) (Fig. 2.9). It had two environments: a farm and a gym [32]. The farm had five different activities: following a butterfly, lifting apple boxes, fruit sorting (straight and crossing) and rowing a boat. In the gym, the user followed motions reproduced by an avatar. Users were given an Oculus Rift HMD and two Oculus Rift controllers.
This exergame aimed to compare virtual programs to the therapist-guided exer-cises, and it was successful. The results showed that they were comparable, so this demonstrates the potential of VR exergames for PWD.
Figure 2.9: Senior playing the Exergame for PWD. Adapted from [32].
C H A P T E R 2 . BAC KG R O U N D A N D R E L AT E D WO R K
of VR, work well together. It is relatively easy to generate data that is useful, from the users, using Virtual Reality. Such as where the users are looking, what choices they make while inside the game and his head rotation movement.
2.2.2 Gamification to improve technology adoption
Here are two examples of the use of gamification to improve user’s participation and engagement with the software.
• The adoption of Gamification in e-banking: This study’s goal was to investigate the acceptance of a gamified application in e-banking [33]. E-banking is a method of banking in which transactions are made through the internet. It was used a traditional web page promoted by an electronic bank and an application called “FuteBank”, which gave it a football look with the transactions and investments on players. Even though it had some limitations due to who had access to this applica-tion, results showed that the ease-of-use has a positive impact on the intention to use the application. Ease-of-use also has a positive impact on enjoyment, since the more straightforward to use an application is, the more enjoyable it becomes.
• Exploring Gamification Effects on User Acceptance Constructs: In this research, SAP ERP (Enterprise Resource Planning developed by SAP that incorporates the key business functions of an organization) was compared to a gamified version of SAP [34]. The goal was to find out whether the gamification version was better for the users, regarding its usability, usefulness, enjoyment, among other aspects. Some aspects had a better score in the gamified version, while others had a better score in the regular version. Telepresence, which is to give a person the appearance of being present, was improved by 29%, interface by 23%, flow by 36%, enjoyment by 53% and perceived ease of use by 36%. However, its usefulness decreased by 3%. In conclusion, the results of this article lead us to believe that gamification can improve the quality of the job, job performance, and commitment.
These examples show that using the gamification technique will, most certainly, en-courage users to useEyeCare regularly, as well as entertain them throughout the journey,
making them more aware of eye diseases.
2.2.3 Games for vision disorders detection
These are examples of games, made specifically with the purpose of detecting visual disorders that users may have, although they may not always detect when it is there.
• EyeSpy 20/20: This is a vision screening program available for schools to order [35], [36]. Created by Vision Quest 20/20 [37], a non-profit organization, it offers games for children to play while their vision is being tested. EyeSpy 20/20 has several tests:
2 . 2 . S TAT E O F T H E A R T
visual acuity, depth perception, and color vision. Each one of these tests has its own games, to be played with different stations, even though all of them are played on a regular computer. By station, I mean a set of equipment that the child used to aid the vision screening. For example, a pair of glasses with one blocked lens or a pair of glasses with one blue and one red lens.
Each game will also have its set of rules. For example, the distance between the child and the screen may change depending on the game. Different ages will have different tests as well, adapting the test to the child’s current grade.
• DoDo game: This is a game is a color vision deficiency screening test [38] for young children. This game is available for both computers and tablets, using a computer mouse and touch respectively. It allows identifying several color-blind issues: Yellow-Blue and Red-Green color deficiency, and total color blindness. It is able to distinguish between deuteranopia, green color blindness, and protanopia, red color blindness.
In this case, children are asked to pick one specific object with similar color profiles to the sample object, as seen in figure 2.10. There are three kinds of objects for the child to pick: one for healthy vision, one for color-blind and one neutral.
Figure 2.10: Screenshot from DoDo game. Adapted from [38].
• Vision Game Labs: This is a game designed to test visual acuity, contrast sensitivity and color sensitivity on patients as young as two years old [39]. It uses colorful animations to keep the children attracted. The data collected allows the optometrist to see if there is a decline in vision.
C H A P T E R 2 . BAC KG R O U N D A N D R E L AT E D WO R K
2.2.4 Online tests for vision disorders
Besides these games, there are online “diagnosis” that may help to detect vision impair-ment cases [40], [41], [42]. They come in the form of a group of tests, where each one tests a factor in the overall vision. These tests are somehow implemented in the games mentioned before. Although they are not a real diagnosis, they serve as a reference.
There are many online tests, but none of them are represented in a game. One of the issues is that they do not have all of the different visual tests in the same group of tests. Another issue is, as they are meant to be taken using the computer, they are not as accurate as Virtual Reality tests can be. This happens due to the different sizes of screens (some may be larger than others), and the tests do not take that into account, and due to the distance that the user is from the screen, although some online tests recommend a certain distance.
These tests do not replace medical exams, for they are not so accurate, and they may present false-negatives and false-positives. False-negative being when there is exists a disease, and the test does not detect it, and false-positive being when it detects a visual impairment, and there is none.
• Visual Acuity: This checks how clear someone’s vision is, and their capability of identifying shapes and details [43]. There are many ways to test Visual Acuity, but the most common is theSnellen Chart (Fig. 2.11a) and the Random E test (Fig. 2.11b).
In the first one, users try to read all the letters from top to bottom, having a perfect vision, users who can read line 8 (20/20) or lower. In the second, users try to tell which direction the letter E is facing. This test can be presented in a similar way to theSnellen Chart. The further the users get, the better their vision is, theoretically.
2 . 2 . S TAT E O F T H E A R T
(a) Snellen Chart. Photo by Jeff Dahl / CC BY 3.0
(b) Random E test
Figure 2.11: Visual Acuity tests.
• Astigmatism: This checks blurring and distortion of vision [44]. Astigmatism is tested by looking at one image. That image is either a full or a semi-circle, with either equidistant lines or sets of three lines separated by the same distance (Fig. 2.12). If some lines appear sharp and dark, while others appear blurred and lighter, the user may have astigmatism.
Figure 2.12: Astigmatism tests.
• Contrast Sensitivity: This checks someone’s ability to distinguish small differences in shades. There are many ways to test this, although the most common is thePelli Robson contrast sensitivity chart (Fig. 2.13a). For a more interactive version, we will
be using a test similar to Random E but with a circle with an opening, where this
C H A P T E R 2 . BAC KG R O U N D A N D R E L AT E D WO R K
circle, the better is their contrast sensitivity.
(a) Pelli Robson contrast sensitivity chart. Design by Denis Pelli and John Robson
(b) Open circle contrast test
Figure 2.13: Contrast Sensitivity tests.
• Color Blindness: This checks if someone is capable of seeing all or some specific color, and to distinguish them from others [45]. There are some ways to test Color Blindness, being the most popularIshihara Color Test (Fig. 2.14a) and Farnsworth Test (Fig. 2.14b). Results will differ according to the user’s case of color blindness.
(a) Ishihara Color Test. (b) Farnsworth Test. An online version of the test by Daniel Flück
Figure 2.14: Color Blindness tests.
• Visual Field: This tests someone’s visual field of view / peripheral vision. This test (Fig. 2.15) consists of following a cross with the eyes, while dots appear far from
2 . 2 . S TAT E O F T H E A R T
the cross [46]. If users are able to see all the dots, while looking at the cross, then they should not have any visual field deficiency.
C
h
a
p
t
e
r
3
S o lu t i o n
3.1
Development Software
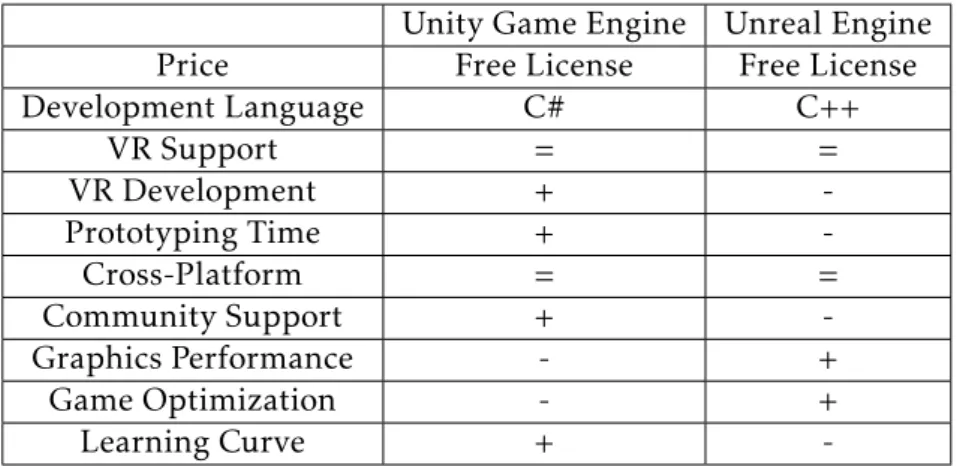
For our solution, we considered two different development softwares: Unity Game Engine andUnreal Engine. In table 3.1 we can see the pros and cons for each engine, meaning
the plus sign (+) that that engine is better relative to the other and the minus sign (-) the inverse. [47]
Unity Game Engine Unreal Engine
Price Free License Free License
Development Language C# C++ VR Support = = VR Development + -Prototyping Time + -Cross-Platform = = Community Support + -Graphics Performance - + Game Optimization - + Learning Curve +
-Table 3.1: Difference between Unity and Unreal
As we can see in the table above, each engine has its advantages. The most important things to consider are the learning curve and VR related attributes.
We chose the Unity Engine as it has a good VR support and a better VR development compared to the Unreal Engine. Also, the fact that it uses C# (programming language, arguably easier than C++) and its learning curve is faster; this is a big advantage since we want to focus on fast prototype development. Finally, even though Graphics Performance and Game Optimization are sometimes important, in this case, they are not much, since
C H A P T E R 3 . S O LU T I O N
we are developing a simple game in terms of its graphics.
3.2
Used Hardware
For testing our solution, it was used a Samsung Galaxy S7 (Fig. 3.1) and a Denver Virtual Reality Box (Fig. 3.2). The specifications of the smartphone were the following:
• CPU: Mali-T880 MP12;
• GPU: Octa-core (4x2.3 GHz Mongoose & 4x1.6 GHz Cortex-A53);
• Memory: Exynos 8890 Octa, 4GB RAM;
• Resolution: 1440 x 2560 pixels, 16:9 ratio ( 577 pixel per inch density);
• Size: 5.1 inches, 71.5 cm2( 72.1% screen-to-body ratio);
• Operation System: Android 8.0.0.
Figure 3.1: Samsung Galaxy S7.
The Denver VR Box we are using is Denver VRC-23 with the following specifications:
• Supports smartphones from 4,7 to 6,5 inches;
• 95º of FOV;
• Includes Bluetooth controller;
• Adjustable focal and object distance;
• Flexible Velcro strap to fit most persons.
3 . 3 . D E S C R I P T I O N
(a) Denver VRC-23. (b) Denver Bluetooth Controller.
Figure 3.2: Denver VR Box Kit (Images from their website).
3.3
Description
EyeCare is a Virtual Reality Exergame developed with the purpose of testing users’ vision
while they are playing. In other words, it is a fun way to detect vision disorders and promoting, at the same time, vision awareness. This game has six puzzles, two to detect color blindness and one for each eye disease: visual acuity deficiency, astigmatism, visual field problem and contrast sensibility problem.
Our target audience is teenagers (13 to 19) and young adults (20 to 40), as we want to detect vision problem as soon as possible, which does not apply so much to the elderly. This younger generation is more used to and enjoys more playing games than older generations. There are always exceptions, so people out of our target audience may want to try this out since it is more fun and more interactive than the medical tests. We do not include people under 12 years old, because it is not advised for them to use VR, which is written in the Health & Safety Warning documents of every Virtual Reality visor.
According to the tests and questionnaires made, this target audience would rather play this game, which makes early diagnosis, than go to a doctor, as seen in Section 4.5.2, even though it does not replace a doctor. EyeCare only advises people to go to the doctor,
based on their performance in the game.
This game is to be used home and does not need any medical participation. An interesting thing to notice is that this game can be used by people with other disabilities, such as deaf people or mute people, as this does not have any influence on the results.
3.4
Architecture
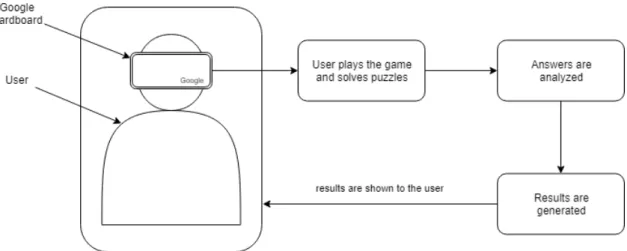
In order to playEyeCare, there are three main components users need: a Virtual Reality
C H A P T E R 3 . S O LU T I O N
Figure 3.3: What is required to play.
3 . 5 . I M P L E M E N TAT I O N
First, users boot the application and press “Play” to start the game. Then, a simple tutorial will show up, telling users the basics of the game. After this, a puzzle will be available to be played. Each completion of a puzzle unlocks the next, and this repeats until the final puzzle (Fig. 3.4). In the end, users’ answers are compared to the right solutions and shown to users.
Figure 3.4: Sequence of the game.
3.5
Implementation
3.5.1 Story
The game begins somewhere inside the forest. The player just woke up and does not know how he got there. The first thing he sees is a blue butterfly, and apparently it’s trying to get him out of there and take him home. Once he passes all the puzzles, he will be able to return home safe and sound.
3.5.2 Puzzles
For each successfully ended puzzle, users will get several colors, proportional to the length of the puzzle. Colors will not be shown to users until they reach the final puzzle.
C H A P T E R 3 . S O LU T I O N
At this point, all the colors they have gotten will be used to solve the final puzzle, which is a Color Blindness puzzle.
3.5.2.1 Visual Acuity Puzzle
In this puzzle, there will be presented one sign, at a time, in front of the user. In this sign, there will be one animal footstep and four arrows, pointing up, down, left and right. The footstep will be pointing randomly to one of those four directions. Users have to tell, by clicking an arrow, in which direction the footstep is pointing. In total, there are four signs, so four difficulties; each one has a smaller footstep than the previous one (Fig. 3.5).
This puzzle was created to detect signs of myopia in users, but we could not get any positive results, even from users who have myopia. This happens because the screen is close to the users’ eyes, and the VR headset uses lenses to help the viewer focus on the image at close distance. Nonetheless, we decided to keep this puzzle because it is one more game users can play.
The idea was taken from theSnellen Chart and EyeSpy 20/20. The decrease in size of
the footstep tries to simulate the decrease in size of the letters and the distance between users and the chart, simultaneously. This game is based on the idea of one of the EyeSpy games, where the user had the correct image out of four total pictures.
This was the very first puzzle to be developed in this project, so it had a lot of re-peated game design stages 2.1.7. We had to understand how users felt using the VR headset and how they felt inside its environment. The Brainstorm stage did not take much time because we already had some examples to work with. We spent a long time in the Prototype-Playtest-Iterate stages because we could not detect any signs of myopia in users that had it. Eventually, after a lot of changing and testing, we got to the conclusion that it was not possible.
(a) First difficulty. (b) Second difficulty.
Figure 3.5: Visual Acuity Puzzle.
3.5.2.2 Visual Field Puzzle
In this puzzle, users have to count how many lemons they can see, while looking at the butterfly. The butterfly flies over four predetermined points and the lemons will be on
3 . 5 . I M P L E M E N TAT I O N
the opposite side of the butterfly (e.g., while the butterfly is on the left side, lemons are on the right side). The number of lemons spawned will be arbitrary between two and four, although users can answer any integer between zero and four, so they do not answer randomly (Fig. 3.6).
This puzzle was created to detect signs of peripheral vision loss. If users fail to count the lemons, they most likely have problems with their peripheral vision. This kind of problems may be related to glaucoma [48]. It may happen that they see the lemons but fail to count them, resulting in a false-positive, which is when it detects a problem, but there is none.
The idea was taken from an online test calledVutest [46]. The main difference between EyeCare and this online test is where the points are displayed. Vutest is more complete
and gives a more precise diagnosis, but we could not make a more elaborate version because it would tire people when playing.
To put together all these ideas, we had to go through the Prototype stage more than once. The most challenging parts were to calculate the best time users had to look to the butterfly so they could answer the puzzle, and to make all the lemons inside the user’s field of view when playing.
(a) Tutorial.
(b) Looking at the butterfly. (c) Answering.
C H A P T E R 3 . S O LU T I O N
3.5.2.3 Astigmatism Puzzle
In this puzzle, users have to tell if they see any image distorted or not. Two images will be presented, each time, to the user. This is the only puzzle that tests each eye individually. Users will look at four images with the left eye and another four with the right eye. To achieve this, we blocked the view of one eye, giving a black image to the user. There is a total of four different images, and this process repeats four times, two for each eye. Each image is a blank background with several black lines parallel to each other. There are different types of astigmatism, and with these four images we aim to detect most of them (Fig. 3.7).
This puzzle was created to detect astigmatism. If users see any image distorted, it means they have astigmatism, even if it is minimal. At the end of the test, the image for both eyes is restored.
The idea was taken from several online tests, each with a slightly different image than the other, but all with the same purpose. The idea behind these tests was to check if users could see all lines, whatever their placement was, with the same size and intensity.
This was the last puzzle to be developed. Because showing images only to one eye was a new idea, we had to go through quite some testing. Also, we had to test how big the circles had to be and how distant and bold the lines had to be, for the user to see them as we wanted. This so we could diagnose astigmatism accurately.
(a) First set of images. (b) Second set of images.
Figure 3.7: Astigmatism Puzzle.
3.5.2.4 Contrast Sensibility Puzzle
In this puzzle, users have to identify the direction in which the horseshoe has an opening. The horseshoe lowers in opacity as the users answer the questions. Just like Visual Acuity Puzzle (Section 3.5.2.1), the horseshoe will be pointing to one random direction, and there will be four arrows for users to give an answer (Fig. 3.9).
This puzzle was created to detect problems with contrast sensibility. Users who fail in the early levels have a stronger contrast sensibility problem than users who fail in the later levels. This visual impairment may be caused by diseases like glaucoma, age-related
3 . 5 . I M P L E M E N TAT I O N
macular degeneration (AMD), and diabetic retinopathy [49]. Diabetic Retinopathy is an eye disease, caused by diabetes, which can cause blurry vision, vision loss and, sometimes, blindness.
The idea was based on the Pelli Robson contrast sensitivity chart (Fig. 2.13a). This
test has different values for each group of three letters, as seen in Fig. 3.8. These values represent how well a person can distinguish contrast.
This was the puzzle with the most number of different Prototype stages. In the first couple of prototypes, there was no white background, which made the horseshoe harder to see. Also, the values for the opacity were somewhat random. In the later steps of this stage, we decided to use thePelli Robson chart as a reference, and use a white background
so we could have more accuracy when diagnosing.
Figure 3.8: Pelli-Robson Chart.
According to studies, people with normal vision tend to score a mean of 1.79 points, people with glaucoma 1.64 and people with AMD 0.98 REF [49]. These values are then submitted to a formula to get the corresponding contrast/opacity values: 101x where x is
the value we get from the chart [50]. Finally, we chose six values: 0.3, 0.6, 0.9, 1.2, 1.5, and 1.65 and got the corresponding opacity, which we then applied to the horseshoe. The opacity values are 50.11%, 25.11%, 12.59%, 6.31%, 3.16%, and 2.24% respectively. If we were to calculate the opacity value for 1.8, which is the value for people with healthy vision, we would get 1.58%. This represents a problem when it comes to implementing it in the Unity Engine. It happens because this Engine’s opacity values can only go from 0 to 100 in steps of 1 (only whole numbers), and when rounding 2.25% (value for 1.65) and 1.58% (value for 1.8), they both tend to 2%. Therefore it is technically impossible, using this Engine, to have both of these values; so we chose to have 1.65 over 1.8 because it is
C H A P T E R 3 . S O LU T I O N
closer to 2%.
(a) 50% of opacity. (b) 12.5% of opacity.
Figure 3.9: Contrast Sensibility Puzzle.
3.5.2.5 First Color Blindness Puzzle
In this puzzle, there will be presented one sign with color, and four other colors displayed in a grid. Colors will be like the ones in DoDo game (Fig. 2.10), where our idea came from. One color similar to the color in the sign, one neutral color and two colors to “trick” people with deuteranopia. Users have to tell which color, displayed in the grid, is the most similar to the one in the sign (Fig. 3.10).
This puzzle was created to detect people with deuteranopia. Users who fail to identify the correct color, suffer from this red-green color blindness.
The idea of this puzzle was simple. The most challenging part was to make the animations and planning the position of the colors. We had to go through some Prototype stages though, so the butterfly had the correct movements and timings.
3 . 5 . I M P L E M E N TAT I O N
Figure 3.10: Color blindness Puzzle.
3.5.2.6 Second Color Blindness Puzzle
In this puzzle, there will be displayed a sign with two rows. Each row has 16 little squares. The first row has one blue square in the first column, by default, and the other 15 columns left empty. And the second row has 15 colored squares, sorted randomly, as soon as users finish the game. The goal is for users to move the squares from the second to the first row and sort them by color (Fig. 3.11).
This puzzle was created to detect any color blindness that users may have, as well as their severity. It is the only puzzle that gives a non-binary result.
We decided to adapt theFarnsworth test to our solution. Farnsworth test has two main
variations: Farnsworth Dichotomous test or D-15 and Farnsworth-Munsell 100 or F-M 100 [51]. Both are color arrangement tests, but F-M 100 is more complex and can be more precise. Therefore, we decided to implement D-15 in our solution because it is more practical.
This puzzle required a lot of testing to prevent bugs from being in the final stage, to be more user-friendly and to see if the results were correct. Although it seems a bit confusing at first, the previous versions were chaotic, comparing to this one.
We usedA Quantitative Scoring Technique For Panel Tests of Color Vision [51] to help to
determine the results of the test. They provide a program in BASIC, so we had to translate that code to C#, to be able to implement it in our solution. This program receives as input the order of the colors and has as output six values: Angle, Major Rad, Minimum Rad, Total Error, S-Index, and C-Index. We will only be using two of these values: Angle and Total Error. The first is the Confusion Angle, which identifies the type of color blindness, and
C H A P T E R 3 . S O LU T I O N
the second identifies how severe the color blindness is.
(a) First look at the puzzle. (b) Sorted colors.
(c) The reward for completing.
Figure 3.11: Final Color Blindness Puzzle.
3.5.3 End game
After users finished the last puzzle, they may go through the giant gate that takes them to the end game. Here users will be able to see their “score” and how they performed in all puzzles. This information will be displayed in two big signs (Fig. 3.12).
The left sign has the information relative to the following puzzles: astigmatism, visual field, contrast sensibility, and the first color blindness puzzle. It tells users whether they have no problem or should go to the doctor. It also has some notes when it detects problems: in the astigmatism row, it says in which eye users have astigmatism, or both if that is the case; in the visual field, it says how many times users have failed; and in the contrast sensibility, it says what possible disease users can have.
The right sign’s information is relative to the last (color blindness) puzzle. It tells what color blindness types users may have, as well as its severity.
3 . 5 . I M P L E M E N TAT I O N
Figure 3.12: Problem with astigmatism in the right eye.
3.5.4 Movement
There were a couple of ways we could have done the movement: click (almost) anywhere to move to that position, click on specific objects to move, automatically move the player when they finish a puzzle, either by traditional locomotion or by teleportation. Tele-portation is moving instantly, from one place to another. Each with advantages and disadvantages, for different games and Virtual Reality kits.
We decided to pick the click on specific objects to move and instant teleportation because it is easy to use and does not cause any motion sickness. This considering the fact thatEyeCare is meant to be played only with a Virtual Reality headset, including a
C H A P T E R 3 . S O LU T I O N
(a) Teaching the user how to move in the game. (b) Continue Guiding the user.
(c) Moving using the staircase. (d) Moving using the door.
Figure 3.13: Game movement.
3.5.5 Interaction
Interaction with objects is mainly done by clicking the button. Interactive objects make the red dot, on the center of the screen, expand and become a red circle when users look at them (Red dot Fig. 3.7a and Interaction circle Fig. 3.6c). These objects include rocks that you can teleport to, buttons to answer puzzles and more specific objects to interact with the game.
There are also some objects that react to the gaze, which is another way of interaction. These objects are the butterfly in the Visual Acuity Puzzle and objects you have to look at to start puzzles.
There are already some games available that diagnose ocular diseases. Some are apps one can play with an Android device, others are playable with a PC and others are available online. Virtual Reality is a platform that has some advantages over the others I just mentioned, so it would be a good idea to have these games on this platform.
There are lots of ways to diagnose each disease, ones being more accurate than others. Since this accuracy does not differ between different types of Virtual Reality devices, opting for the Google Cardboard is a plus, because it is affordable.

![Figure 2.2: Game Design Diagram. Adapted from [23].](https://thumb-eu.123doks.com/thumbv2/123dok_br/15907731.1092263/35.892.131.764.292.522/figure-game-design-diagram-adapted-from.webp)

![Figure 2.9: Senior playing the Exergame for PWD. Adapted from [32].](https://thumb-eu.123doks.com/thumbv2/123dok_br/15907731.1092263/39.892.154.741.148.404/figure-senior-playing-exergame-pwd-adapted.webp)
![Figure 2.10: Screenshot from DoDo game. Adapted from [38].](https://thumb-eu.123doks.com/thumbv2/123dok_br/15907731.1092263/41.892.192.701.616.982/figure-screenshot-from-dodo-game-adapted-from.webp)