1
InSmart – A methodology for combining modelling with stakeholder input towards EU
cities decarbonisation
S.G. Simoes a, *, L. Dias a, J.P. Gouveia a, J. Seixas a, R. De Miglio b, A. Chiodi b, M. Gargiulo b, G. Long c, G. Giannakidis d
a CENSE e Center for Environmental and Sustainability Research, NOVA School of Science and Technology, NOVA University Lisbon, 2829-516, Caparica,
Portugal
b E4SMA S.r.l.,Turin, Italy
c University of Nottingham, Nottingham, UK
d Centre for Renewable Energy Sources and Saving (CRES), Athens, Greece
Abstract
In a world where an increasing share of the population lives in cities, its energy transition is gaining more relevance. The decision-making process in urban planning is frequently fragmented across departments considering different criteria. Integrated city planning approaches are not commonly employed, especially for the promotion of sustainable energy. This paper presents an innovative approach to promote holistic decision-support combining complex integrated city energy system models (ESM) with effective stakeholder input using a Multi-Criteria Decision Analysis (MCDA). A holistic optimization city-ESM, based on the TIMES model generator, was developed and implemented in four European cities (Évora in Portugal, Cesena in Italy, Nottingham in UK and Trikala in Greece). Each city defined a range of future scenarios for sustainable energy promotion up to 2030 which were modelled in the city-ESM. The scenarios considered both individual measures as expansion of bicycle lanes and combinations of measures. Going one step further from typical approaches in urban energy modelling, the modelling work was carried out in close cooperation with city stakeholders which participated not only in the definition of the modelled scenarios, but also on the critical review of the modelling results. This review was conducted through a MCDA with considering both quantitative and qualitative criteria in the selection of the most adequate and realistic scenarios to be implemented. It was found that there are substantial differences in most desirable scenarios if the MCDA is performed as well or if only the city-ESM model results are considered. The critical review of quantitative modelling results and their ranking via the MCDA led to improved communication of model results to non-modellers, which in turn made possible a better scrutiny and improvement of the modelling. It is concluded that at an urban level is important to combine qualitative analysis with quantitative modelling to identify the optimum mix of measures for a sustainable city energy future.
Key-words: sustainable urban energy planning, TIMES energy system model, MCDA, participatory scenarios
1 Introduction
The importance of energy for sustainable development is portrayed in the United Nations Sustainable Development 7th goal (United Nations, 2018), since it is closely related to others as e.g. infrastructure, health, poverty eradication, innovation and job creation. Therefore, reliable, sustainable and modern energy in cities is paramount for achieving the 2030 Agenda and support the pathways for achieving the Paris Agreement targets on Climate Change.
The deployment of low carbon technologies for sustainable energy production and use requires the active engagement of local and regional communities. Across the globe, cities consume 78% of the world’s energy and are responsible for more than 60% of global CO2 emissions, due to energy generation, transport, industry, and biomass use (UN Habitat, 2017) (OECD/IEA, 2016). Several programmes and voluntary initiatives such as such as the EU Covenant of Mayors Pact (CoM) (Covenant of Mayors Office, n.d.) renamed as Covenant of Mayors for Climate & Energy, or the UN Global Compact of Mayors for Climate and Energy (Mayors, 2018), or the C40 Cities Climate leadership group (C40 Cities Climate Leadership Group, 2016), strive to lead their partner cities towards sustainable development achievements, low carbon future design and improved quality of life of their citizens.. Cities’ activities affect the environment in both negative and positive ways (Dodman et al., 2013), which leads to the need of cities to address climate change, reduce energy consumption and increase the use of renewable energy resources (RES) through the development of holistic plans rooted in environment, social and economic aspects. To do so, city authorities need the support of appropriate methods throughout the urban development value chain addressing increasing energy demand, changing demographics and ageing infrastructure (World Economic Forum, 2016). This is even more relevant
2 considering that a recent review of 200 EU cities’ climate plans concludes that climate change planning in EU cities is very much determined by their local organisational capacity (Reckien et al., 2014). It has been recognized by several authors that there is a need for a more comprehensive and integrated approach to urban planning aimed towards increasing the use of sustainable energy, such as mentioned by the Global Covenant of Mayors (Global Covenant of Mayors for Climate & Energy, 2018), by (Immendoerfer et al., 2014) in their review of 58 cities in the EU, by (Zanon and Verones, 2013) focusing on Italian cities or by (World Economic Forum, 2016) stating the need for city planning processes driven by integrated approaches to ensure a sustainable energy use. Consequently, innovative tools and models developed through extensive data gathering and analysis, to evaluate and perform in-depth analysis of alternative measures, will help pave the way towards long term energy planning. Ideally, these will be able to fully capture the environmental, economic, technical and social potential of each city in the most efficient way. Research carried out by different authors have presented diverse perspectives and models for simulating future cities, regarding its energy use and planning. (Keirstead et al., 2012) evaluated 219 papers and concluded that even with a large diversity of modelling practices of urban energy systems, the studies usually compartmentalize the assessments focusing on specific aspects of energy use. A few examples; (Falke and Schnettler, 2016) cover only residential buildings for the design of energy supply systems, (Aste et al., 2016) only evaluates the energy retrofit in public and zero emissions buildings, (Liu et al., 2017) and (deLlano-Paz et al., 2017) only addressed the electricity supply side. (Sreekanth, 2016) presented a review on studies on sectoral energy end use demand for domestic, commercial, industrial and transports sectors. This split tends to miss synergies of technical solutions and of common policy instruments leading to serious inefficiencies. The authors argue that the integration of the different energy demand sectors of the city is crucial for proper decision on investments, comparing the cost effectiveness of measures, for short, medium and long-term city energy planning.
Integrated city energy systems models (ESM) have been approached by several authors: (Mirakyan and De Guio, 2013) suggested a four phase-scheme for energy planning presenting methods and tools for each phase; (Zhou et al., 2014) used a fractile-based interval mixed-integer programming to deliver solutions for energy supply, electricity generation, air pollutants mitigation, and carbon dioxide control, among others; (Neves et al., 2015) identified the need for a holistic perspective to local energy systems while using a local energy planning model focused on energy services demand; (Cosmi et al., 2015) presented a methodology to characterize the whole energy system from policy background, energy uses and infrastructures, as well as market behaviour and community attitude for sustainable development; (Mirakyan and De Guio, 2015) discussed the different types of uncertainties related to integrated energy planning; (Yazdanie et al., 2017) implemented a cost optimal urban energy systems tool for the city of Basel to assess interactions between national energy policies and local action. Other authors implemented a TIMES energy system model for the city of Oslo to assess possible routes for the city’s decarbonisation (Lind and Espegren, 2017). Finally, the LEAP energy system model (Stockholm Environment Institute, n.d.) was implemented for several cities as Beijing (Zhang et al., 2011) and Bangkok (Phdungsilp, 2010).
Despite these presented efforts it is still fundamental to translate the model results into effective city planning. (Cajot et al., 2017) revealed the interrelated challenges and obstacles hampering efficient urban energy planning, highlighting that contribution of novel quantitative solutions, as urban scale simulation and optimization tools, has yet to be fully understood and established in planning practices. In other words, it is fundamental to translate sophisticated, complex (and imperfect) model results to the city decision-makers, allowing to obtain their feedback and thus improving the modelling process. With this in mind this paper presents a novel and innovative approach to co-create city sustainable energy systems pathways, through combining city-ESM processes and results with local stakeholders’ perspectives. Contrarily to what has been done in other similar studies, the novelty of this approach is that stakeholders are called to scrutinise the quantitative modelling results in a structured manner through a Multi-Criteria Decision Analysis (MCDA) approach. Moreover, following their feedback, the quantitative model is modified, and new runs are made. In most studies, even if stakeholders are engaged to provide feedback (which is not common practice), they are normally presented with a selection of more or less final results. Qualitative criteria are not used to assess them, and the modelling work is not subsequently corrected and redone. This is the case of for example the modelling work done for Oslo (Lind and Espegren, 2017), for Delhi (Farzaneh et al., 2016) or for Beijing (Zhang et al., 2011). It should be mentioned that the work for Bangkok (Phdungsilp, 2010) also combined a MCDA approach with quantitative energy systems modelling. However, in this work, the author does not engage stakeholders in this MCDA and it does not lead to re-running the model.
3 Although the growing availability of advanced computing and sensing capabilities facilitates access to big data repositories with city information at several levels (Sanz et al., 2015), it still requires decision-makers to trust and understand the indicators and tools behind them. Moreover, the energy dimension is only one of the concerns of city decision makers, whose foremost goal is to improve the living conditions of their citizens (e.g. create jobs, renovate degraded areas, reduce traffic congestion, provide waste collection) (Ploger, 2006). The decision-making process is thus frequently fragmented across different departments considering different criteria (Simoes et al., 2018). Integrated city planning approaches are not frequently employed, especially where the promotion of sustainable energy is concerned.
The integrated approach presented in this paper was developed under the FP7 European funded project InSmart – Integrated Smart City Planning, for four European cities: Évora (Portugal), Cesena (Italy), Nottingham (United Kingdom) and Trikala (Greece), with the support of scientific and technical organizations of the same countries. Therefore, this paper has two main objectives: 1) briefly present the developed city-ESM, and 2) describe the adopted co-development approach integrating stakeholders used throughout the MCDA process. Results for the 4 case-study cities are presented to illustrate the developed approach and replication for other cities is discussed.
The paper is organized in four sections. The methods used are portrayed in Section 2, both for the city-ESM and the MCDA. Section 3 presents the obtained results from the city-city-ESM, the MCDA and final outcome which where the city action plans. Section 3 also presents a discussion on the added values of combining city-ESM with MCDA. The conclusions and limitations are summarized in Section 4.
2 Methods - a participatory approach for sustainable urban energy
planning
2.1 Overview of the approach
The proposed approach brings together city stakeholders and researchers in a co-development process for enhancing sustainable urban planning through an integrative and multidisciplinary planning process. The approach addresses the issue of integration between the cities administration staff, as well as between the decision makers and the different relevant departments in municipalities (Giannakidis et al., 2018; Gouveia et al., 2016) (Figure 1). The four cities for which this approach was implemented have different energy profiles, diverse geographical and socio-economic contexts, as well as rather diverse levels of experience envisioning and implementing sustainable energy solutions, with Nottingham and Cesena being larger and more experienced regarding sustainable energy promotion. While for example Nottingham has a relevant problem with traffic congestion, Évora has a pressing concern with its declining population and an historic centre increasingly abandoned by citizens. On the contrary, Cesena has an expanding population and is planning to develop new urban areas. Finally, Trikala is focused on improving its infrastructure for its citizens (e.g. access to natural gas and new roads) (Seixas et al., 2017). These differences make them a good test-case to assess the feasibility and added values of the presented approach.
The base-year situation in each city was characterised to prepare the scene for developing future urban energy scenarios and comparing their sustainability with the base-year situation (from 2013/2014 till 2030). The approach covered the following city sectors:
• residential and services buildings (privately owned and managed by the municipalities) • public and private transport
• urban spaces (green areas, public lighting) and city support services (water, waste water and waste management)
• city energy supply side regarding potential for intra-city RES generation (e.g. photovoltaic, solar thermal, small-scale hydropower, wind, geothermal and biogas).
The imports of energy (electricity, natural gas, biomass, liquid fuels) into the city were also considered, including associated GHG emissions.
4
Figure 1- Overview of the approach indicating the steps where public participation was more relevant
The first step in the proposed approach is an enhanced understanding of the energy system of the city with all information stored in a geographic information system (GIS) based energy database. This includes DATA COLLECTION of multi-scale granularity (e.g. 15 min electricity consumption registries from smart meters, monthly to annual statistical energy production and consumption data, and door-to-door surveys). Each city selected a base year according to the availability of data. This was 2012 for Trikala, 2013 for Évora and Cesena and 2014 for Nottingham and is used as a benchmark. The data collection entailed a substantial amount of work, which is summarised as follows:
• The current status of residential buildings was mapped using existing information and 400 household surveys for the case of Évora, which collected data on building envelope, equipment for heating, cooling, lighting and other uses, and behaviour of occupants. More information on these households surveys can be found in (Gouveia et al., 2018).This information was used to define several building typologies, based on similar characteristics (e.g. typical wall construction, typical window frames etc.), which allowed simplifying the analysis of energy consumption, alternative scenario analysis and aggregations for the total energy demand over city zones. In the case of Évora, where all residential customers are equipped with smart meters, detailed electricity consumption profiles provided an in-depth knowledge of the demand for various uses (Gouveia and Seixas, 2016) . The characteristics of residential building typologies were used in building simulation software (DesignBuilder) to create EnergyPlus models capable of simulating residential retrofit options for insulation, heating, cooling, water heating and lighting technologies. The simulation results for energy savings and the corresponding costs were utilised in the city-ESM (described further in section 2.2);
• Energy consumption in municipal buildings was provided directly from the municipalities, while the behaviour of private services buildings was modelled using average energy use benchmarks (kWh/m2 for space heating, for space cooling, for lighting and total consumption in kWh/m2) from national sources, which were also an input to the city-ESM;
• A household survey for the mobility needs on city inhabitants provided the data for transportation demand between city zones (more details are presented in the Annex). These inputs were used in a simplified transport model developed by the project partner Systra1 to forecast the future demand of transportation load (defined as a demand of passenger kilometres and tonne kilometres) in
1 Systra is an international engineering and consulting group specializing in rail (passenger and freight) and public
transport who was a partner of the InSmart project. More information on Systra available at: https://www.systra.com/en/
5 alternative city development scenarios. The mobility simulation tool was used to produce detailed results that were further utilised in the city-ESM where the transportation demand drives the energy consumption by vehicles and the need for investing in new vehicles in the future;
• Current energy consumption profiles for public lighting, green areas & public fountains, municipal solid waste (MSW) collection and disposal, water supply and waste water collection and treatment were also characterised and input into the city-ESM;
• The existing district heating infrastructure (applicable only to Nottingham and Cesena) was mapped and the future energy saving possibilities, both technological (e.g. improve efficiency of waste water treatment plants) and behavioural (e.g. impact of increasing MSW recycling rates) were assessed, as input into the city-ESM.
• The energy supply side for each city was analysed and the technical potential for urban decentralised energy supply using renewable energy sources (RES) was assessed. This included the technical maximum potential for photovoltaic (PV), solar thermal, small-scale hydropower, wind, geothermal and biogas (see (Simoes et al., 2018)). All RES potential (except solar) was assessed using literature. For the case of solar, a new methodology was developed to assess the potential for installation of solar thermal panels and solar PV systems. More detailed explanations on the developed methodology can be found in (Dias et al., 2019, 2015).
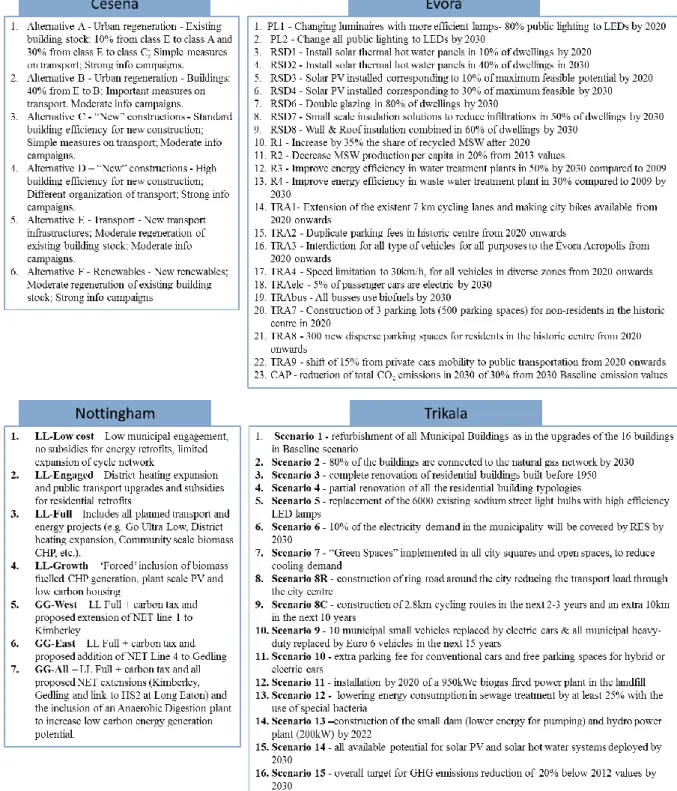
Following the data collection, and to be able to perform the INTEGRATED CITY ENERGY SYSTEM MODELLING, the drivers for 2030 scenarios in each city were identified and developed. These considered evolution of population and number of dwellings, development/modification of residential, industry or services areas and infrastructures within the city and modifications in energy consumption patterns (e.g. higher thermal comfort requirements in buildings or different mobility patterns). The types of scenarios proposed varied from the implementation of specific actions like refurbishment of residential sector buildings to more comprehensive scenarios like focus on urban regeneration (Figure 2).
The resulting scenarios for each city were then run through the city-ESM. This model was an application for each city of the International Energy Agency’s TIMES city energy system model (described in the following section). TIMES was used as a city planning platform to identify, in an integrated manner, the urban energy system scenario’s effects in terms of energy consumption, GHG emissions, share of renewable energy and energy costs. At the end of this step each city scenario was characterized with the mentioned indicators as well as a list of options of future technologies. These quantitative outputs of the TIMES city-ESM model reflected a cost-minimisation approach.
In the following step, the TIMES city-ESM modelled scenarios were then tested and ranked through a MULTI-CRITERIA DECISION ANALYSIS (MCDA) approach to ensure they were economically, environmentally and socially acceptable while improving economic prospects and quality of life. The MCDA considering thus both quantitative (e.g. energy savings, GHG emission reductions, financial effort for implementation) and qualitative criteria (e.g. implementation complexity, improving comfort and quality of life, feasibility and social acceptability). The criteria were selected by the stakeholders in each city, as well as respective weights (described further in section 2.3). At the end of this step each city had a realistic list of measures to improve the sustainability of their energy system, which were translated to an action plan.
6
Figure 2 – Overview of the city scenarios until 2030
Throughout the whole approach and unlike typical approaches to urban modelling, the modelling activities were developed in close cooperation with diverse groups of city stakeholders, namely: city planners, NGOs, private & public companies and regional authorities. In all the cities that were part of the project, stakeholders were engaged in a continuous manner throughout the project duration. The key events were the three participatory workshops where stakeholders contributed to designing future energy scenarios, identifying the key issues that should be included in the analysis. Persons from diverse types of organizations participated in these workshops including regional government authorities; local authorities (municipality and sub-municipal management); market agents (as PV companies, business associations, waste company) and non-governmental organizations (e.g. university, consumer associations and environment protection, association of engineers). The stakeholders also defined the criteria and provided the weighting for each criterion that was included in the MCDA analysis, as described section 2.3.
7 The GIS platform played a significant role in the sense that it was the connecting point between the different sectors that focus into specific parts of the energy demand and supply in each city. The platform integrates and presents the data describing the current energy system on the city’s geographical background, but it also presented the results of energy scenarios.
2.2 The InSmart city energy system model and stakeholder input
The ultimate objective of the city-ESM tool is the identification of the cost-effective and social-relevant optimum mix of measures and technologies to pave the way towards the achievement of cities’ sustainable targets, such as those stated in the Covenant of Mayors, or others, requiring high contributions of renewables and/or aggressive emissions reductions. As mentioned, the authors used the technological-based TIMES (The Integrated MARKAL-EFOM System) energy system model (Loulou et al., 2016), detailed for the different city’s energy sectors and spatially explicit for each city district, refined with the city stakeholders’ validation through a multi-criteria decision-making tool.
The TIMES model generator was developed as part of the IEA-ETSAP collaboration , using long term energy scenarios at different spatial scales to conduct in-depth energy and environmental analyses (e.g. (Labriet et al., 2012) at a global scale, (Lind and Espegren, 2017) for the city of Oslo, and (Simoes et al., 2016) for the European scale). TIMES is a technology-rich, bottom-up optimization model integrating the entire energy/emission system of the city, including the procurement, transformation, trade, and consumption of a large number of energy forms. The reference energy system was designed and validated according to statistics of the base year (e.g. 2012/2013/2014). The TIMES city model represents the municipality from the base year till 2035 in two or five-year time steps, depending on the city. Each year is subdivided into time slices representing different fraction of the year. This allows for a proper integration of the different levels of granularity of the data collected.
Figure 3 - Integrated TIMES city-ESM structure and outcomes
The TIMES city-ESM tool is supported by an extensive database of technological options from which the cost-effective mix of technologies will be derived to supply the city energy services demand along the modelling time horizon. Therefore, a TIMES model at city level departs from the current energy system and generates future scenarios of cost-effective energy technologies, taking into consideration city planning goals and policies (e.g. expansion of a services hotspot in a specific city district, reducing the city overall GHG emissions, complying with a renewable target) while fulfilling the exogenous
8 demand for energy services of the various city districts. Model outputs are: energy flows, energy commodity prices, GHG and air quality emissions; new supply infrastructures and demand device purchases, total installed capacity of technologies and energy expenditures. More details on the four TIMES city models developed for the four cities can be found at (Giannakidis et al., 2016; Long and Robinson, 2016a; Miglio et al., 2016; Simoes et al., 2016a).
2.3 Using a Multi Criteria Decision making method for combining modelling with
stakeholder input
The application of multi-criteria decision making in energy planning problems has gained considerable ground between research communities (e.g. (Løken, 2007; Lombardi et al., 2017)). The application of MCDA entailed the following steps:
(1) Defining criteria together with stakeholders’ (Table 1) and allocating weights to the different criteria with stakeholders. For the case of Évora and Trikala functional groups of stakeholders were considered starting from a suggestion made by the scientific partners which was adjusted for each city. For Évora these groups were local authorities, regional authorities, private sector, and civil society, whereas for Trikala they were municipality, technical chamber, commercial association, and Trikala Chamber. For Nottingham, stakeholder groupings were intentionally cross-functional to ensure maximum diversity of opinions within each group and four groups were used. For Cesena was decided to have two cross-functional stakeholder groups meeting in two sequential workshops. The composition of each group was defined by the cities. Each group discussed and allocated weights to each criterion in a two-step process. The stakeholders were firstly asked to discuss the criteria in order to achieve a first common basis of understanding on their meaning and then to allocate the weights in an individual basis. This was then followed by another discussion to try to achieve consensus on the weights. After the first set of ranking was made, the weights were reviewed and adjusted by consensus if deemed necessary.
These final weights were the ones used in the following steps of the MCDA.
(2) Definition of the decision-making scheme, regarding the objective function and preference function. A Deliberative Multi Criteria Evaluation (DMCE) approach was used and Hinkle’s resistance to change method (Hinkle, 1965) was applied towards the conclusion of representative preferences that were used as weights in the decision-making scheme afterwards. For Évora, the problem was not further constrained using the Preference function accompanied with thresholds for Preference (P) and Indifference (Q). In this case, the preference function was the Usual default one. In Nottingham and Cesena, partly due to the lower number of possible scenarios, preference functions and P and Q thresholds were discussed and included as part of the MCDA process. “Linear” and “V-shape” options have been used for the quantitative criteria, while the “Usual” (step-wise) shape option has been chosen for the qualitative criteria. In Trikala, different preference functions (and P and Q thresholds) where considered for each of the four stakeholder groups.
(3) Implementing the MCDA by characterizing the results of each tested scenario in the city-ESM according to the defined criteria. Some of the model results provided direct inputs in the MCDA (i.e. investment costs), whereas some criteria required qualitative assessment by all stakeholders. The decision-making scheme was solved for each stakeholder group using the Promethee method (Brans and Mareschal, 2005).
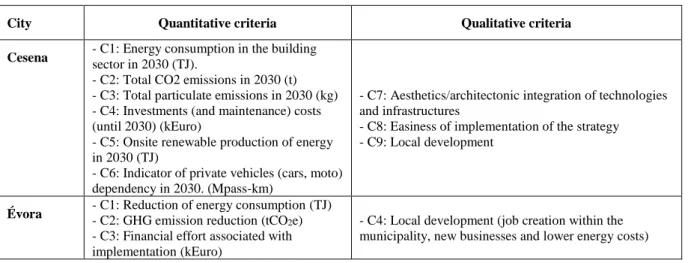
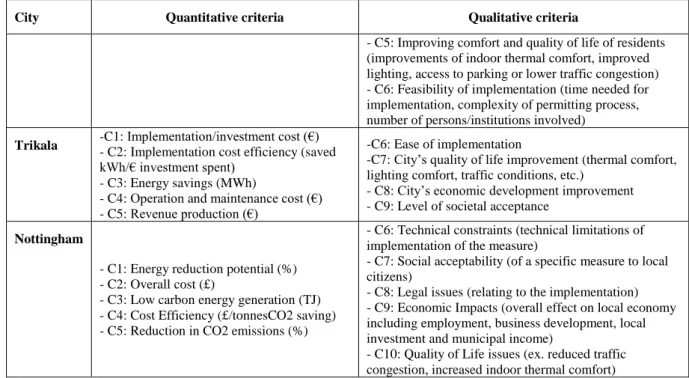
Table 1 - Overview of the criteria used in the MCDA for each city
City Quantitative criteria Qualitative criteria
Cesena - C1: Energy consumption in the building sector in 2030 (TJ).
- C2: Total CO2 emissions in 2030 (t) - C3: Total particulate emissions in 2030 (kg) - C4: Investments (and maintenance) costs (until 2030) (kEuro)
- C5: Onsite renewable production of energy in 2030 (TJ)
- C6: Indicator of private vehicles (cars, moto) dependency in 2030. (Mpass-km)
- C7: Aesthetics/architectonic integration of technologies and infrastructures
- C8: Easiness of implementation of the strategy - C9: Local development
Évora - C1: Reduction of energy consumption (TJ) - C2: GHG emission reduction (tCO2e)
- C3: Financial effort associated with implementation (kEuro)
- C4: Local development (job creation within the municipality, new businesses and lower energy costs)
9
City Quantitative criteria Qualitative criteria
- C5: Improving comfort and quality of life of residents (improvements of indoor thermal comfort, improved lighting, access to parking or lower traffic congestion) - C6: Feasibility of implementation (time needed for implementation, complexity of permitting process, number of persons/institutions involved)
Trikala -C1: Implementation/investment cost (€) - C2: Implementation cost efficiency (saved kWh/€ investment spent)
- C3: Energy savings (MWh)
- C4: Operation and maintenance cost (€) - C5: Revenue production (€)
-C6: Ease of implementation
-C7: City’s quality of life improvement (thermal comfort, lighting comfort, traffic conditions, etc.)
- C8: City’s economic development improvement - C9: Level of societal acceptance
Nottingham
- C1: Energy reduction potential (%) - C2: Overall cost (£)
- C3: Low carbon energy generation (TJ) - C4: Cost Efficiency (£/tonnesCO2 saving) - C5: Reduction in CO2 emissions (%)
- C6: Technical constraints (technical limitations of implementation of the measure)
- C7: Social acceptability (of a specific measure to local citizens)
- C8: Legal issues (relating to the implementation) - C9: Economic Impacts (overall effect on local economy including employment, business development, local investment and municipal income)
- C10: Quality of Life issues (ex. reduced traffic congestion, increased indoor thermal comfort)
The quantitative criteria were calculated using the results of the city-ESM, while the qualitative criteria where assessed based on the input from the stakeholders. In this way stakeholders participated in the definition of the scenarios which were modelled, but also on the ranking of the scenarios based on: (i) the quantitative outputs of the ESMs and (ii) on their perception of the qualitative characteristics of each scenario.
As a result, a ranking of alternative scenarios was produced which prioritized the actions from the one with the best to the one with the worst compromise among the evaluation criteria. As previously mentioned, this ranking was discussed with the stakeholders in all cities during a second workshop looking for the necessity to change the criteria’s weights. Having considered feedbacks from most important stakeholders involved in the decision-making problem, the 1st in ranking options provided the most appropriate and applicable solution for each municipality.
2.3.1 Weight allocation to MCDA criteria
Regarding the weigh allocation to the MCDA criteria a short overview is presented in this section regarding the different outcomes for the four cities. The weights of the different criteria were found to substantially affect the ranking of different alternatives and scenarios and this is why they are here briefly discussed.
The final results of the two stakeholder groups in Cesena are depicted and the individual preferences are compared to the “average” (nineteen stakeholders in the left case and four stakeholders in the right case). Both charts show the different shapes of the preferences across the criteria. For example, on the left chart, stakeholder “P2” assigns a high weight to criterion 3 (and a much minor relevance to criterion 8, which is very important for stakeholder P1 though.
Figure 4- Individual preferences on criteria allocation across stakeholders for the two stakeholder groups considered in Cesena during the first (left) and second workshops (right)
Based on this data, the overall weight of the qualitative criteria in Cesena was 1/4 of the total as stakeholders allocated more weight to quantitative criteria.
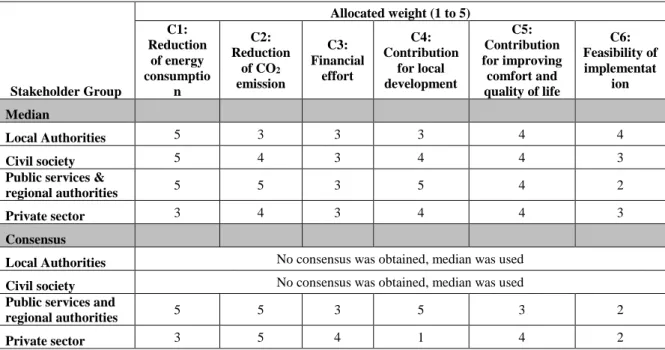
10 For the case of Évora, the criteria weight allocation from the stakeholders’ workshops is presented in Error! Reference source not found.. A value from 1 to 5 was allocated for each criterion, where 1 stands for “Very Low Relevance Criterion” and 5 for “Highly Relevant Criterion”.
Table 2 - Results of the criteria weight allocation made during the stakeholder workshop in Évora
Stakeholder Group Allocated weight (1 to 5) C1: Reduction of energy consumptio n C2: Reduction of CO2 emission C3: Financial effort C4: Contribution for local development C5: Contribution for improving comfort and quality of life C6: Feasibility of implementat ion Median Local Authorities 5 3 3 3 4 4 Civil society 5 4 3 4 4 3
Public services &
regional authorities 5 5 3 5 4 2
Private sector 3 4 3 4 4 3
Consensus
Local Authorities No consensus was obtained, median was used
Civil society No consensus was obtained, median was used
Public services and
regional authorities 5 5 3 5 3 2
Private sector 3 5 4 1 4 2
As can be seen from the table, different stakeholder groups were found to attribute substantially different weights to the different criteria, especially regarding reduction of CO2 emissions, contribution for local development and feasibility of implementation. As previously explained, there was a process of trying to reach consensus on the weights which was not possible for all stakeholder groups, in which case a median of weights was used.
Regarding Nottingham, the four stakeholder groups went through the MCDA sub-processes (weighting of criteria, ranking of qualitative criteria and definition of threshold functions and P and Q values) individually. The normalised weights for criteria for each group and the final consensus are shown in Table 3. The mean average of the group scores is also included to demonstrate how the consensus result reached often differs from simply taking the group average.
Table 3 - Criteria weighting by group and consensus for the Nottingham MCDA process
Criterion Allocated weight (Normalised)
Code Description Group
1 Group 2 Group 3 Group 4 Average Consensus C1 Energy reduction potential (%) 11.9 8.9 14 10 11.1 13.3 C2 Overall cost (£) 7 13.3 11.6 0 8 8.9
C3 Low carbon energy
generated (GWh) 11.6 6.7 7 6.7 8 8.9
C4 Cost efficiency (£/tonnes
CO2) 9.3 17.8 11.6 16.7 13.8 17.8
C5 Reduction in CO2
emissions (tonnes CO2) 18.6 11.1 18.6 16.7 16.2 15.6
C6 Technical constraints 11.6 2.2 2.3 3.3 4.9 2.2
C7 Social acceptability 4.7 4.4 7 13.3 7.4 4.4
C8 Legal issues 0 0 0 0 0 0
C9 Economic impact 11.6 15.6 7 10 11 8.9
C10 Quality of Life Issues 14 20 20.9 23.3 19.6 20
The lowest ranked criteria are qualitative (C6, C7, C8) and Legal Issues (C8) were not considered to be a significant factor by any of the groups. Quality of Life issues were considered to be the most important factor overall and by all but one of the groups.
11 For Trikala, the evaluation criteria were organized into a stakeholder-oriented matrix to better engage and facilitate decision-makers to provide reliable preferences. Thereinafter, the evaluation criteria were oriented in the grid-form requesting from the identified stakeholders to score the criteria. The results obtained from each stakeholder scoring and corresponding normalized values are presented in four figures in Table 4 below (one per stakeholder group).
Table 4 - Scores for the qualitative criteria for each criterion in Trikala
Stakeholder group - Municipality Stakeholder group – Technical chamber
Stakeholder group - Commercial Stakeholder group – Trikala chamber
The different criterion weights allocated by each stakeholder group alter the top-ranked scenarios / measures as briefly outlined in the next section.
3 Results and discussion
This section presents the main results obtained from the implementation of the presented approach. The results are structured according to the three steps previously identified: quantitative results from the TIMES city-ESM, the obtained rankings in scenarios for improving the sustainability of the urban energy system via the MCDA, and finally the options considered in the action plans for each city.
3.1 Results from the integrated city-ESM
For each city, a few key variables were selected to be tracked in the model and explored in the scenario analysis. The overview covers the several modelled scenarios reflecting the options for sustainable energy promotion in the municipalities presented before. These key indicators for a new action plan were selected to be able to support the MCDA to prioritise the different modelled scenarios. Most indicators are identical across the four cities, especially regarding energy savings, CO2 emission reduction and costs.
3.1.1 Cesena
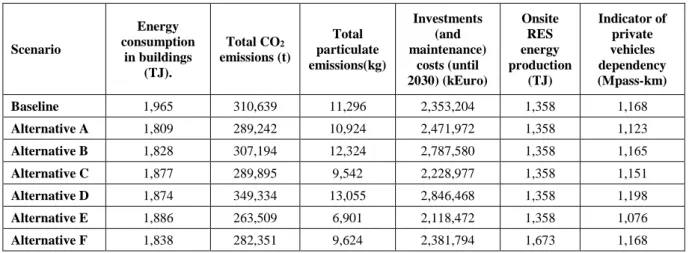
Table 5 shows the outputs of the city-ESM for Cesena for the Baseline scenario and six alternatives according to the six quantitative criteria to be used in the MCDA. Alternative E (Transport - New transport infrastructures & Moderate regeneration of existing building stock & Moderate info campaigns.) is the most economic option available, with also the highest reduction in both particulate and CO2 emissions. This alternative also has a better performance regarding lower dependency on private vehicles. More detailed information can be found in (Miglio et al., 2016).
12
Table 5 – Performance of scenarios modelled in city-ESM for Cesena in 2030
Scenario Energy consumption in buildings (TJ). Total CO2 emissions (t) Total particulate emissions(kg) Investments (and maintenance) costs (until 2030) (kEuro) Onsite RES energy production (TJ) Indicator of private vehicles dependency (Mpass-km) Baseline 1,965 310,639 11,296 2,353,204 1,358 1,168 Alternative A 1,809 289,242 10,924 2,471,972 1,358 1,123 Alternative B 1,828 307,194 12,324 2,787,580 1,358 1,165 Alternative C 1,877 289,895 9,542 2,228,977 1,358 1,151 Alternative D 1,874 349,334 13,055 2,846,468 1,358 1,198 Alternative E 1,886 263,509 6,901 2,118,472 1,358 1,076 Alternative F 1,838 282,351 9,624 2,381,794 1,673 1,168
The only two criteria with poor performance is the city RES energy production where Alternative F - Renewables is the only one with improved performance, and energy consumption in buildings where Alternative A (Urban regeneration - Existing building stock: 10% from class E to class A and 30% from class E to class C & Simple measures on transport & Strong info campaigns) performs better than all other alternatives. Therefore, by considering solely the city-ESM results, possibly Alternative E would be considered as preferable.
3.1.2 Évora
For the city of Évora the results of the city-ESM are depicted in Table 6 and more detailed information can be found in (Simoes et al., 2016a). Looking at energy savings clearly the scenarios RSD7, RSD8 and RSD6 have the best performance (respectively, small scale insulation solutions to reduce infiltrations in 50% of dwellings, deploying wall & roof insulation in 60% of dwellings, and double glazing in 80% of dwellings). Regarding lowering CO2 emissions, it is the RSD4 scenario (solar PV corresponding to 30% of maximum feasible) that has the better performance, followed by TRAbus (all busses use biofuels). However, both RSD4 and TRAbus are the costliest measures. Although not included in the table, if a decarbonisation and energy savings cost efficiency (eur/tCO2 and eur/saved GJ) are calculated, the cheapest scenarios are PL1, PL2 (changing luminaires with more efficient lamps- 80% public lighting to LEDs by 2020 and change all public lighting to LEDs by 2030) and TRA7 (Construction of 3 parking lots for non-residents in the historic centre).
Therefore, by considering solely the city-ESM results for Évora, scenarios PL1, PL2, RSD4, RSD7, RSD8, TRAbus and TRA7 would be considered as most interesting to pursue in a city action plan (without considering any qualitative criteria).
Table 6 – Performance of scenarios modelled in city-ESM for Évora in 2030 (indicated as difference to Baseline). Negative values indicate that no reductions were achieved when compared to Baseline.
Scenario Reduction of energy consumption from Baseline values (GJ) Reduction of CO2 emissions from Baseline values (t)
Additional financial effort compared to Baseline costs
(kEuros2015a) Investment O&M PL1 525.08 56,163.31 624.51 920.33 PL2 525.08 56,163.31 624.51 920.33 RSD1 -58.01 -5,621.20 16.68 1.44 RSD2 11,128.42 1,981,304.08 41.23 3.42 RSD3 -112.53 2,984,843.21 3,869.48 357.70 RSD4 -148.95 8,962,242.45 12,696.72 1,173.71 RSD6 46,646.43 1,108,710.65 480.38 -0.37 RSD7 50,111.90 1,112,240.23 2,625.65 -0.41 RSD8 50,111.90 1,112,240.23 4,590.43 -0.38 R1 692.29 64,615.98 200.00 n.a. R2 950.87 89,661.35 300.00 n.a. R3 -54.52 - 1,000.00 n.a. R4 0.00 - 3,000.00 n.a. TRA1 2,958.89 197,633.11 1,190.00 n.a. TRA2 3,695.38 261,206.75 0.00 n.a. TRA3 1,617.27 109,703.48 15.00 n.a.
13 Scenario Reduction of energy consumption from Baseline values (GJ) Reduction of CO2 emissions from Baseline values (t)
Additional financial effort compared to Baseline costs
(kEuros2015a) Investment O&M TRA4 18,340.87 1,303,332.86 20.00 n.a. TRAelc 14,346.84 1,299,388.09 2,309.89 213.53 TRAbus -37,399.19 2,272,947.66 4,122,984.85 762,276.98 TRA7 901.77 58,467.00 7,000.00 n.a. TRA8 952.66 62,173.32 13.50 n.a. TRA9 9,217.64 657,772.23 10.00 n.a.
n.a. – not applicable. a All costs are normalised to euros of 2015 using the respective national GDP deflators.
3.1.3 Nottingham
Table 7 shows the outputs of the Nottingham ESM for the five quantitative criteria to be used in the MCDA. This is a summarised version of the detailed analysis in (Long and Robinson, 2016a). LL-Low Cost is the most economic option available (lowest decarbonisation cost efficiency), but also has the lowest energy savings and reduction in CO2 emissions. All the GG scenarios are significantly higher cost and lower cost efficiency than the LL scenarios but also have significantly higher low carbon energy generation potential. LL-Growth seems to be the optimal solution, assuming equal weight was applied to all the criteria shown. However, as mentioned for the other two cities this analysis excludes the potential qualitative impacts associated with each scenario.
Table 7 – Performance of scenarios modelled in city-ESM for Nottingham in 2030
Scenario Energy Savings
(%)
Overall Cost (£k)
Low Carbon energy generated (GWh) Decarbonization cost efficiency (£/tCO2) Reduction in CO2 emissions (%) Reference 0 0 104.2 n.a. 0 LL-Low Cost 7.13 319,876 104.2 4,046 9.28 LL-Engaged 8.28 517,546 234.9 5,442 11.37 LL-Full 8.81 767,111 234.9 7,376 12.57 LL-Growth 9.34 779,525 333.6 6,650 14.4 GG-West 9.1 1,024,861 540.2 8,693 14.5 GG-East 9.3 1,135,861 540.2 9,636 14.5 GG-All 9.34 1,403,928 560.0 11,575 15.0 3.1.4 Trikala
The quantitative results obtained from the city-ESM for Trikala (Giannakidis G., Siakkis P, 2016) show that as far as energy savings are concerned, the building sector (municipal and residential buildings) have the highest potential (scenarios 1 and 4). However, these interventions are also associated with a high implementation cost, since the main actions are building shell refurbishment. The estimated RES potential modelled in scenario 16 was found adequate to cover up to 10% of the local electricity consumption by 2030, with an implementation cost that is substantially lower than the one of scenarios 1 and 4, but with a higher operation and maintenance cost (due to the maintenance of the RES installations).
Looking only at the implementation cost efficiency, the most attractive scenario is scenario 12, where the efficiency of the sewage treatment plant is increased with the use of special bacteria, an action that has low implementation costs. This is followed by scenario 7 (green spaces), which can offer significant other benefits to the city apart from those related to energy use. Scenario 9 (replacement of existing small municipal vehicles with electric vehicles) and scenario 10 (promotion of hybrid and electric cars in the city centre) are both transport related scenarios with a high ratio of energy saved over money spent for the investment in new technologies, although the achieved energy savings is relatively low.
Therefore, from considering only a city-ESM perspective, the following scenarios would be selected for improving the sustainability of Trikala’s energy system: scenario 1, 4, 7, 9 and 10.
3.2 Results from the MCDA
As described in section 2, the quantitative results of the city-ESM were used as inputs in an MCDA participatory process with stakeholders organised in four functional groups for Évora and Trikala, as
14 four non-functional groups for Nottingham and in two non-functional groups for Cesena. The groups decided on the weight allocation for each quantitative and qualitative criterion.
The resulting MCDA rankings are made by means of the total cost-function value (Phi value) obtained for each scenario/measure from the highest to the lowest Phi value in its scaled form in the range from -1 (worst solutions) to +1 (best solutions), meaning that actions with positive Phi could be considered acceptable.
All scenarios were ranked for each different stakeholder group. The detailed rankings are available in (Long and Robinson, 2016b) for Nottingham, in (De Miglio et al., 2016) for Cesena, in (Stavrakakis et al., 2016) for Trikala and in (S. G. Simoes et al., 2016b) for Évora. The results of the MCDA for the cities of Évora and Nottingham are presented in more detail in this section to avoid making this a too long manuscript. Nonetheless. in the end of this section are summarised the selected scenarios / alternatives from applying the MCDA participatory process in all the four cities.
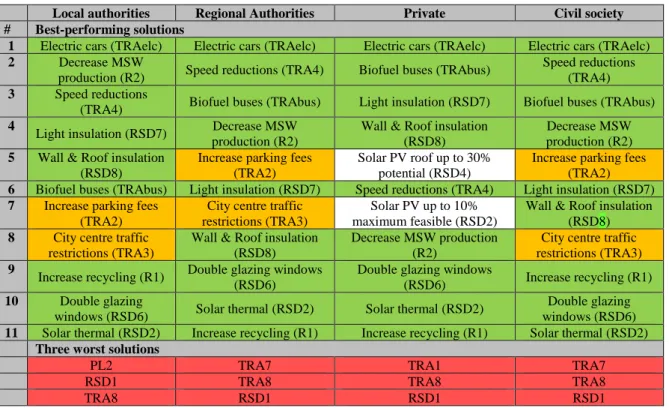
Table 8 illustrates the rankings for each stakeholder group together with the ones obtained by the compromise problem for Évora. Green coloured actions represent solutions acceptable by all stakeholder groups, also appearing in the compromise solution. White coloured actions represent solutions acceptable by at least 2 stakeholder groups also appearing in the compromise solution. Red coloured actions represent actions among the three worst ones for all stakeholder groups and for the compromise solution. Orange coloured actions represent actions reflecting at least two stakeholder groups’ preferences but also appearing in the compromise solution.
The scenario TRAelc is the top ranked in all stakeholder groups. However, the position in the rankings of the other scenarios varies depending on the weights allocated by the different stakeholder groups, especially for scenarios related to waste management and RES energy promotion, as can be seen in the table.
Table 8 – Summary of the alternatives per stakeholder group ranked per Phi value and only listing the three worst performing solutions for Évora
Local authorities Regional Authorities Private Civil society
# Best-performing solutions
1 Electric cars (TRAelc) Electric cars (TRAelc) Electric cars (TRAelc) Electric cars (TRAelc)
2 Decrease MSW
production (R2) Speed reductions (TRA4) Biofuel buses (TRAbus)
Speed reductions (TRA4) 3 Speed reductions
(TRA4) Biofuel buses (TRAbus) Light insulation (RSD7) Biofuel buses (TRAbus) 4
Light insulation (RSD7) Decrease MSW production (R2)
Wall & Roof insulation (RSD8)
Decrease MSW production (R2) 5 Wall & Roof insulation
(RSD8)
Increase parking fees (TRA2)
Solar PV roof up to 30% potential (RSD4)
Increase parking fees (TRA2) 6 Biofuel buses (TRAbus) Light insulation (RSD7) Speed reductions (TRA4) Light insulation (RSD7) 7 Increase parking fees
(TRA2)
City centre traffic restrictions (TRA3)
Solar PV up to 10% maximum feasible (RSD2)
Wall & Roof insulation (RSD8) 8 City centre traffic
restrictions (TRA3)
Wall & Roof insulation (RSD8)
Decrease MSW production (R2)
City centre traffic restrictions (TRA3) 9
Increase recycling (R1) Double glazing windows (RSD6)
Double glazing windows
(RSD6) Increase recycling (R1)
10 Double glazing
windows (RSD6) Solar thermal (RSD2) Solar thermal (RSD2)
Double glazing windows (RSD6) 11 Solar thermal (RSD2) Increase recycling (R1) Increase recycling (R1) Solar thermal (RSD2)
Three worst solutions
PL2 TRA7 TRA1 TRA7
RSD1 TRA8 TRA8 TRA8
TRA8 RSD1 RSD1 RSD1
The different stakeholder rankings were combined in a compromise solution and the following results were achieved for Évora:
• Acceptable measures: TRAelc – 5% of passenger cars are electric; TRAbus – All buses use biofuels; R2 – Decrease MSW production per capita in 20% from 2013 values; TRA4 – Speed limitation to 30km/h, for all vehicles in diverse zones; RSD7 – Small scale insulation solutions in 50% of dwellings; RSD8 – Wall & Roof insulation combined in 60% of dwellings; RSD6 – Double glazing
15 in 80% of dwellings; RSD2 – Install solar thermal hot water panels in 40% of dwellings; TRA2 – Duplicate parking fees in historic centre; TRA3 – Interdiction for all type of vehicles to the Évora Acropolis.
• Worst measures: TRA8 – Increase historic centre parking disperse with 300 new disperse parking spaces for residents in the historic centre; RSD1 – Install solar thermal hot water panels in 10% of dwellings; PL2 – Change all public lighting to LEDs.
For Nottingham, the results of the MCDA process are illustrated using a Promethee rainbow chart (Figure 5) instead of a table. Criteria with positive and negative contributions/flows (Phi+ and Phi-) for each action are illustrated in the rainbow’s bars by means of their colour pre-set for criteria’ categories (e.g. energy, social, decarbonisation, logistical). The ranking of the scenarios is shown from left to right (best to worst alternative). The criteria were categorised into five groups represented in the figure with different colours: Energy (C1) shown in red, Economic (C2, C4, C9) in blue, Decarbonisation (C3, C5) in yellow, Logistical (C6, C8) in grey and Social (C7, C10) in green. The groups shown at the top of the chart have positive Phi scores and those shown beneath the axis have negative phi scores. The area of chart for each grouping represent its value.
Figure 5 - Promethee Rainbow for the Nottingham MCDA process. Colours refer to the type of scenarios assessed: energy scenarios are red, economic are blue, decarbonisation in yellow, logistical are shown in grey and social in green
The top ranked scenario, LL-Growth, has only one negative phi score relating to logistical criteria, which were low-weighted by the stakeholders. Other scenarios have higher scores for some criteria groups (e.g. high decarbonisation scores for GG scenarios) but have larger negatives which bring down their overall result. Interestingly the lowest cost scenario LL-Low Cost is the lowest ranked scenario due to its low scoring for social and decarbonisation-based criteria.
Table 9 summarizes the best performing scenarios for the four cities considering solely the city-ESM or the MCDA process. With the exception of Nottingham, the scenarios resulting from the MCDA are not the ones that would have been selected if only the city-ESM would have been used, since the qualitative criteria also play an important role in the ranking.
Table 9 – Summary of the performance of the scenarios from the city-ESM and MCDA for the four cities
City Best performing scenarios from
city-ESM Top ranked scenarios from the MCDA
Cesena Alternative E Alternative F and A
Évora PL1; PL2; RSD4; RSD6; RSD7; RSD8;
TRAbus; TRA7
Scenarios not best-performing from city-ESM: TRAelc; R2; TRA4; TRA2; TRA3. Scenarios best performing
from city-ESM: RSD7; RSD8; RSD6; TRAbus
Nottingham LL-Growth LL-Growth
Trikala Scenario 1, 4, 7, 9 and 10 Scenarios not best-performing from city-ESM: 1, 2, 5 and
6. cenarios best performing from city-ESM: 4, 7, 8 and 9
3.3 From energy modelling to a city action plan
The results of the city-ESM allowed identifying and characterising quantitatively both stand-alone measures (for Évora and Trikala) and combinations of measures (for Cesena and Nottingham) for
16 promoting a more sustainable urban energy system. These were then ranked according to both quantitative and qualitative criteria in the MCDA according to the preferences of city stakeholders. The ranked measures were then reviewed and further selected to be included in a realistic city action plan. This process is summarised in Table 10, as well as the main expected achievements of these city plans. For comparison purposes, the table also shows values for the base year in each city and information on its area and population.
For the case of Cesena, from the six alternatives modelled in the city-ESM, two (A and F) were identified in the MCDA as performing “best”. These were combined and led to a selection of the 10 the most interesting options that were included city plan: refurbishment of a fraction of the existing building stock, the speed reduction and modal shift from private car transport to cycling, the production of a certain amount of renewable energy, and the promotion of strong “information campaigns” to support and inform citizens about objectives and opportunities of “rational” (energy-related) “rational” behaviours. These measures should allow to reduce the 2030 CO2 emissions in the city by 31% below the base-year values. The results of the city-ESM led to reductions in 2030 between 3-27%.
For the city of Évora, by applying the city-ESM for the 23 considered scenarios it became clear that not all options contributed equally to energy savings or lowering carbon emissions (the scenario with higher energy savings is not necessarily the scenario with higher emission reductions). The scenarios considered for Évora were very sector specific and did not combine measures as in the case of Cesena and Nottingham. In terms of energy savings, residential buildings have the highest potential and compared with the other modelled measures, these interventions are not the most expensive ones. However, the municipality has limited capacity of investing in private residential buildings. Through the application of the MCDA analysis it was found that the best performing options were shifting 15% from private cars mobility to public transportation; fostering use of biofuels in city buses; decrease MSW production per capita; restricting traffic and parking in the city centre, installing insulation and solar thermal water collectors in residential buildings. Consequently, in the Évora action plan the following actions were considered: review existing municipal programs for private building renovation in the historic centre and provide access to credit schemes for residential owners towards passive energy efficiency measures in the building envelope; increase bike lanes and parking fees, negotiate with the bus company to change fleet to buses running exclusively on biofuels and to increase their frequency, increase the share of MSW collected for recycling via information campaigns and replacement of all street lighting with LED lamps. These measures should allow to reduce the 2030 CO2 emissions in the city by 21% below the base-year values. The stand-alone results of the city-ESM led to reductions in 2030 between 0.3-5.0%.
Table 10 – Overview of the four case-study cities and main results
Units Cesena Évora Trikala Nottingham
Area km2 250 1 307 69 75
Population in base-year
No.
inhab. 96 758 56 596 62 154 314 300
Situation in Base Yeara Energy residential building consumption in base-year GJ / dwelling 53.20 16.73 58.42 49.95
Private and public urban mobility energy needs in base-year
GJ /
dwelling 89.85 38.21 54.08 80.06
Energy use in city support sectors in base-year GJ / capita 1.05 1.83 1.45 0.42 Direct CO2 emissions in base-year t CO2 / capita 3.71 3.71 1.12 3.60
Implementation of the approach Scenarios modelled
in City-ESM No.
6 (each combines different measures)
23 (each is one measure for one
sector)
17 (each is one measure for one
sector) 8 (each combines different measures) Quantitative / qualitative criteria in MCDA No. 6 / 3 3 / 3 5 / 4 5 / 5
17
Units Cesena Évora Trikala Nottingham
No. of measures in
city action plan No.
10 (4 residential buildings, 2 transport,
3 energy supply & 1 information campaign) 14 (1 residential buildings, 8 transport, 4 other sectors & 1 municipal buildings) 9 (1 private buildings, 5 transport, 2 other sectors & 1 municipal buildings) 10 (3 residential buildings, 4 transport and 3 energy supply) Main Expected Achievements by 2030 with the adopted Energy Action Plans in 2030
Saved energy (vis-à-vis the reference case) in residential buildings
GJ / yr.
inhab. 1.40 0.11 0.82 0.13
TJ/yr 135.00 5.92 51.10 650
Saved energy (vis-à-vis the reference case) in transport GJ / yr. inhab. 1.45 0.65 0.13 0.60 c Reduction of CO2 emissions b from base year % 31 22 9 21 Direct CO2 emissionsb t CO2 / capita 2.50 3.45 0.95 2.57 Overnight costs of measures in the city action plan
Million euros 120 (58% for refurbishment of buildings) 15 (48% for parking to improve mobility) 4.296 (annualized costs, 53% for connecting buildings to natural gas grid)
881 (total cost of the plan over the time horizon)
n.a. – not applicable; a Base year is 2012 for Trikala, 2013 for Cesena and Évora, and 2014 for Nottingham; b only for the following sectors
(i.e. transport, buildings, water, wastewater & waste management); c does not include travelling to work outside the city.
In Nottingham, 7 scenarios were modelled in the city-ESM and the LL-Growth scenario was selected as the preferred alternative. The MCDA process identified this same scenario as the top ranked one, representing the maximum level of local engagement for the city of Nottingham. It was decomposed in a set of measures, whose applicability was verified and (if applicable) were included in the city action plan, as follows: improve efficiency in both the existing and the new residential building stock; to shift from a private car-based mobility towards public transport and cycling; and the highest level of local engagement with ‘forced’ inclusion of biomass fuelled CHP generation, plant scale PV and low carbon housing. These measures should allow to reduce the 2030 CO2 emissions in the city by 22% below the base-year values. The stand-alone results of the city-ESM led to reductions in 2030 between 9.3-15.0%. Finally, for Trikala, the analysis of the quantitative results obtained from modelling 17 scenarios in the city-ESM highlighted the energy savings of the building sector. However, these interventions are also associated with a high implementation cost. Although, energy efficiency plays a major role in achieving the city CO2 emission reduction targets for 2030, Trikala also has a substantial RES potential that could cover up to 10% of the local electricity consumption by 2030 at a lower implementation cost than of the building refurbishment actions. Despite of these results of the city-ESM, the options that came forward from the MCDA analysis (and included in the city plan) were different: improved and extended cycling routes and extension of the ring road (with indirect effects on the quality of life in the city centre), implementation of green spaces within the city, refurbishments of all municipal buildings and connection of 80% of the buildings to the natural gas grid. Actions that need to be taken by the municipality include the replacement of all street lighting with LED lamps, the replacement of municipal vehicles and the introduction of incentives for the promotion of hybrid/electric vehicles in the city centre. These measures should allow to reduce the 2030 CO2 emissions in the city by 9.0% below the base-year values.
4 Conclusions
This paper presents a novel approach for urban energy planning decision support that combines quantitative modelling with qualitative analysis in an integrated and participatory process for the whole urban energy system. The proposed approach combines energy system modelling and a MCDA process for a more thorough, realistic and participated assessment of the sustainable energy options to be implemented by the cities. The approach was implemented for four European cities: Cesena in Italy, Nottingham in the UK, Évora in Portugal and Trikala in Greece. It was found that for the four cities the most preferable measures resulting from the optimisation modelling done in the TIMES city model are not always the most preferred measures when combined with qualitative criteria in the MCDA. In other words, by considering only quantitative technology energy system modelling results for supporting
city-18 planning, it was not possible to fully address the concerns and decision-making factors relevant for both the municipalities and the other public and private city stakeholders. The same also seems to apply (albeit to a less extent) when considering also qualitative criteria for the ranking of scenarios. The higher-ranking scenarios / measures from the MCDA are not the exact same ones that are deemed more fit to be included in the city action plans by the municipalities. The difference between the MCDA and city action plans is due to the fact that the municipalities (who will be responsible for the plans) take the final decision regarding measure selection. While doing so, other criteria play a role, such as lowering municipalities’ energy bills or complying with existing municipal political targets. This seems to highlight a limitation of this study and the need to include more criteria in the MCDA than the ones used. Other limitations of the proposed approach regard the fact that building a TIMES model (or any other energy system model) for a city can be very time consuming and require large sets of data inputs that are not always available. This in turn leads modelers to make assumptions, which have their own associated errors. Furthermore, other intrinsic limitations of bottom-up optimization models are that such tools do not consider limited capital availability to replace technologies nor consumer preferences, and assume perfect foresight, among other.
Nonetheless, using energy modelling complemented with a MCDA allows for a more thorough assessment of the measures than if only an energy system model is used. The interactions between stakeholders during the MCDA criteria weigh allocation were proven very useful for a more common understanding of the city energy system and of the different views of each stakeholder. These processes, albeit more time consuming as mentioned, can possibly increase the ease of adoption of some of the measures, as they will increase the engagement of local public and private stakeholders. The usage of the MCDA allows for a more realistic and feasible selection of measures to implement. On the other hand, by using a city-ESM it is possible to provide more robust quantitative inputs into the MCDA and to have a holistic view of the urban energy system.
The four cities addressed in this paper have different area and population, different socio-economic contexts and different levels of organisational capacity regarding their level of experience envisioning and implementing sustainable energy solutions. As a consequence, their approach to generate the modelled scenarios is also different. While Cesena and Nottingham are cities with higher population, with municipalities more experienced in implementing sustainable energy measures and in dealing with more or less complex decision models, Évora and Trikala are smaller and less experienced. Therefore, while Cesena and Nottingham selected urban development alternatives to be modelled in the city-ESM, each of these combining several stand-alone energy measures, Évora and Trikala preferred to test only stand-alone measures. Regardless of these differences, it was possible to implement successfully the developed approach for the four cities, generating added value for them.
Therefore, the presented approach can be replicated to other cities and can be integrated into the process of developing a Sustainable Energy Action Plan or a Sustainable Energy and Climate Action Plan by municipalities participating in the Covenant of Mayors for Climate and Energy. To do so the authors advise making use of more simplified TIMES modelling for urban energy systems, as is being developed within the SURECITY project2.
The combination of TIMES with MCDA is relatively easy and straight forward to implement. In this study it was found that the usage of such complex modelling tools was in fact a good platform for capacity building, both of the modelers on urban energy planning and of the city technicians and decision-makers on their integrated urban energy system and on more innovative sustainable energy options. The experience gained through this learning process may facilitate and support the deployment of local sustainable solutions and decision-making in cities, contributing to the realization of the Paris Agreement.
5 Acknowledgements
The research work underlying this paper was funded by the European Commission under the 7th Framework Programme for Research and Technological Development. For brevity, the authors list of this manuscript contains only the people involved directly in the development of this manuscript. However, the authors acknowledge the Nottingham City Council, Municipalities of Évora and Cesena, the Municipal Water Supply-Sewage Enterprise of Trikala (DEYAT); the technical partners Systra