RESTISTANCE TO CHANGE
A STUDY ON HOW TO IMPLEMENT AN EFFECTIVE CHANGE MANAGEMENT STRATEGY WITHIN SCEPITICAL ENVIRONMENTS
MARTINA NAVARRA, #2231
A Project carried out on the CEMS MIM Program, under the supervision of: Prof. Constança Casquinho
BUSINESS PROJECT
Leveraging Data Analytics within ENGIE DARCI
DATE May 30th, 2016
2 RESTISTANCE TO CHANGE
A STUDY ON HOW TO IMPLEMENT AN EFFECTIVE CHANGE MANAGEMENT STRATEGY WITHIN SCEPITICAL ENVIRONMENTS
ABSTRACT
This study investigates the reasons behind the scepticism of implementing data analytics solutions observed during the Business Project with the energy company ENGIE. The aim is to illustrate the relevance of identifying the motives behind the resistance to change to define a tailored change management strategy. Only adopting this approach, it is possible to effectively engage the workforce, thus successfully implement changes within resistant environments. Renowned behavioural economics theories, such as the Prospect Theory by Kahneman and Tversky, and Kotter’s 8-Steps for Leading Change model are presented and analysed to support the main thesis of this work.
3
TABLE OF CONTENTS
ABSTRACT ... 2 1. BRIEF CONTEXT ... 4 a. Client ... 4 b. Market overview ... 4c. Current client situation ... 6
d. The Business Project challenge ... 7
2. REFLECTION ON THE WORK DONE AND INDIVIDUAL CONTRIBUTION .. 7
a. Problem definition ... 7
b. Methodology ... 8
i. Hypothesis ... 8
ii. Methodology & Analysis... 8
c. Recommendations to the company ... 11
d. Concerns (shortcomings, implementation problems expected) ... 13
e. Individual contribution ... 14
3. ACADEMIC DISCUSSION ... 18
a. Possible links with your MSc field (Economics, Finance, Management) ... 18
b. Relevant theories and empirical studies ... 19
c. Implications for theory and future research ... 25
4. PERSONAL REFLECTION ... 26
a. Personal experience ... 26
i. Key strengths & weaknesses observable during the project ... 26
ii. Plan to develop of your areas of improvement ... 27
b. Benefit of hindsight ... 27
APPENDIX ... 29
4
1. BRIEF CONTEXT
a. Client
ENGIE is a global actor in the energy industry operating in 70 countries on 5 continents. The company has experienced a series of changes in the last years, such as the merger of Suez and the gas-supplier Gaz de France (GDF) in 2008 (GDF Suez, renamed ENGIE in 2015) and the recent reorganization in January 2016.1 ENGIE’s core businesses comprise power, natural and
liquefied gas and energy services. Its mission is to focus on sustainable value and responsible growth, to counteract the major challenges of energy transition to a low-carbon economy. ENGIE’s global strategy focuses on becoming the leader in energy transition in Europe, promoting energy-efficient services to clients and developing new businesses exploiting the latest digital innovations. Furthermore, through the enforcement of its position as independent power producer and the increase of its presence in the gas value chain, the company aims to be considered a benchmark for energy utility in emerging countries. ENGIE operates along the entire energy value chain and offers energy efficiency solutions increasingly digital-based, that range from home and corporate services to the development of smart cities.2
b. Market overview
To date, as presented by the “Global Energy Architecture Performance Index Report 2016”, the transition towards low-carbon economy and renewable energies has opened the energy market to new business opportunities. These include the emergence of “smart cities”, the increasing importance of services related to energy efficiency and distribution across dispersed areas, the development of new industrial sectors and new mobility solutions. However, new challenges have arisen, such as the need of new regulations, the increased competition in terms of technology and cost-structure and the growing complexity of business solutions3. Analysing
1 Marliot, Emmanuelle. 2016. “Active Data Analytics Cell – ADAC Presentation for CEMS”. Internal Presentation for the CEMS Team. 2 ENGIE Group. 2015. “A global actor in energy transition”. Internal ENGIE Report.
3 World Economic Forum. 2016. “Global Energy Architecture Performance Index Report 2016”.
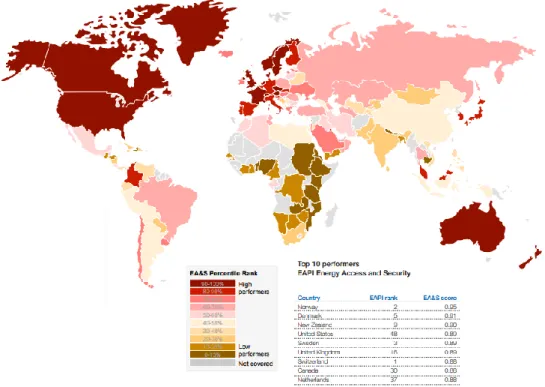
5 in detail the global weaknesses and strengths, the EAPI 2016 has shown that major economies are struggling to achieve balanced high performance in their energy systems. Except for France, none of the 12 largest countries by GDP has made into the top 10 performers list4 (Refer to Appendix, Figure 1 for an Outlook of the highest and lowest global performers). The podium is occupied by Switzerland (1st), Norway (2nd) and Sweden (3rd) and overall only three of the top ten countries are located outside the European area. This proves that the standards and targets set by the EU are producing the expected results5. Another key finding regards the impact of digital technologies within the energy security. Big data contributes significantly to mitigate risks by identifying vulnerable areas, enabling the creation of new forms of insights and control. However, today’s more complex and interconnected energy structure requires a more advanced risk protection system. Europe, United States and New Zealand are the areas currently showing the highest performances in energy access and securities6 (Refer to Appendix, Figure 2 for an Outlook of the highest and lowest global performers in the energy access and security). A final crucial factor is the oil price. As addressed by the Commissioner Arias Cañete in the G7 Energy Ministers, the “failing of the oil and gas prices make energy investments more challenging for the energy sector, both globally and in Europe”7.This situation is forcing or
accelerating subsidy reforms to restore fiscal balance in countries reliant on oil revenues. Considering also that by 2030 renewables are expected to become the dominant source of power and that smart technologies will be the norm, a close cooperation between EU and the other global partners (e.g. USA) is considered essential to ease this transition process.
4 World Economic Forum. 2016. “Global Energy Architecture Performance Index Report 2016”.
http://reports.weforum.org/global-energy-architecture-performance-index-report-2016/#frame/11c3b
5 European Commission. 2010. “Energy 2020 A strategy for competitive, sustainable and secure energy.” Communication from the
Commission to the European Parliament, the Council, the European Economic and Social Committee and the Committee of Regions, European Commission, Brussels.
6 World Economic Forum. 2016. “Global Energy Architecture Performance Index Report 2016”.
http://reports.weforum.org/global-energy-architecture-performance-index-report-2016/wp-content/blogs.dir/97/mp/files/pages/files/energysecuritymap.pdf
7 European Commission. 2016. “Energy diplomacy: Climate Action and Energy Commissioner Arias Cañete at G7 Energy Ministers meeting
in Kitakyushu, Japan.” Communication from the Commission to the European Parliament, the Council, the European Economic and Social Committee and the Committee of Regions, Kitakyushu, Japan.
6 c. Current client situation
Starting from January 2016, ENGIE has adopted a simpler and more agile architecture. This consists of 5 transverse Métiers (Gas chain, Centralised production of electricity, Decentralised Solutions for Cities and Territories, Solutions for Businesses and Solutions for Residentials and Professionals) and 24 Business Unites8. The Métiers ensure overall coordination and coherence across the Group whereas the BUs perform business activities according to the local clients’ needs. As of today, ENGIE is the European’s top importer of liquefied gas, the largest supplier of natural gas, the continent’s leading supplier of multitechnical energy services and a leading global supplier of water and waste management services. In 2015, the company reached a net recurring income of EUR 2.6 billion, which considering the difficult market price environment is a good result. However, the net income has suffered remarkably from the EUR 8.7 billion of deterioration, closing 2015 with a negative Group share of EUR -4.6 billion. Looking at the cash generation, the Group closed with EUR 18 billion of liquidity and EUR 9.8 billion in Cash Flow from Operation, almost 2 billion more than in 20149. ENGIE’s main competitors are E.ON SE ($125,074Mil), Electricié de France SA (EDF) ($83,648Mil) and Enel SpA ($79.009Mil)10. E.ON.SE is one of Germany’s top power companies and the first supplier of natural gas in the country11. EDF is one of the world’s top electric utilities, providing a large range of services for more than 38 million customers in the world12. Enel SpA is Italy’s second gas distributor and serves more than 61 million customers, offering electricity, gas and renewable power generation assets13.Considering the financial performance, ENGIE’s current ROI is -4.98%, higher than E.ON.SE (-7.43%) but still lower than EDF (0.58%) and Enel SpA (3.32%)14. In terms of Market Capital, ENGIE records EUR 33.81bn, over 10bn more than EDF (EUR
8 Marliot, Emmanuelle. 2016. “Active Data Analytics Cell – ADAC Presentation for CEMS”. Internal Presentation for the CEMS Team. 9 ENGIE Group. 2016. “An ambitious 3-year strategic transformation plan to become leader of the world energy transition”. Official 2015
annual report. https://www.engie.com/wp-content/uploads/2016/02/engie-fy-2015-results-press-release.pdf
10 Morningstar. 2016. Morningstar. http://www.morningstar.com/stocks/LTS/0LD0/quote.html [Retrieved 28.05.2016]
11 Hoovers. 2016. Hoovers. http://www.hoovers.com/company-information/cs/company-profile.eon_se.fb752ecfef2a2c86.html [Retrieved 28.05.2016] 12 Hoovers. 2016. Hoovers. http://www.hoovers.com/company-information/cs/company-profile.electricite_de_france.274a4c37b4e74df9.html [28.05.2016] 13 Hoovers. 2016. Hoovers. http://www.hoovers.com/company-information/cs/company-profile.enel_spa.8645e910f3fc6385.html [Retrieved 28.05.2016] 14 Financial Times, ENGIE SA http://markets.ft.com/research/Markets/Tearsheets/Summary?s=ENGI:PAR [Retrived 29.05.2016]
7 23.49bn), still registering a lower value than Enel S.p.A (41.66bn)15. On the European level,
ENGIE can be considered as the third key player in the energy market, before Enel SpA. However, in the global landscape, among those previously mentioned EDF is ENGIE’s main competitor, given its wide range of services and its spread presence.
d. The Business Project challenge
The increasing complexity of the business environment, the exponential growth in volumes of both structured and unstructured data and the emergence of new risks make Data Analytics (DA) increasingly relevant for the Internal Audit (IA) function.16 DA can improve and support the audit process by facilitating auditors’ work, limiting time on the field and expanding the audit analysis possibilities and perspectives. To seize this opportunity, ENGIE has established the DARCI Active Data Analytics Cell (ADAC), a project focused on the short-term on the IA department and on the long-term on the Risk Management (RM) and Internal Control (IC) areas. First, target pilots and trainings will be launched to prove the benefit of DA and then, the success of the IA’s implementation will enable the spread of the project in RM and IC. The CEMS Business Project challenge is to develop a business case for ENGIE to identify current and future good practices for the deployment of DA solutions in the DARCI areas. The ultimate goal is to find a team, a tool and a customized approach focused on improving the efficiency of IA that would contribute to have the same successful results afterwards in IC and RM.17
2. REFLECTION ON THE WORK DONE AND INDIVIDUAL CONTRIBUTION
a. Problem definition
After the latest reorganization in January 2016, ENGIE’s approach to DA needed to be revised. In fact, previously the company counted a higher number of BUs, which collected data for their
15 Financial Times, ENGIE SA http://markets.ft.com/research/Markets/Tearsheets/Business-profile?s=ENGI:PAR [Retrived 29.05.2016] 16 Deloitte. 2013. “Adding insight to audit – Transforming Internal Audit through data analytics”.
http://www2.deloitte.com/content/dam/Deloitte/ca/Documents/audit/ca-en-audit-adding-insight-to-audit.pdf
8 own analysis’ purposes without sharing information that might have benefit the whole organization. This inevitably resulted in missing opportunities, drawbacks and failures that could have been avoided. The direct consequence has been an increase in the overall profit loss that has deteriorated the company’s financial situation along with its market competitiveness. To recover this situation, leveraging on the new structure, a unified approach to exploit the knowledge collected by each BUs has to be designed.
b. Methodology i. Hypothesis
In the context of the Business Project, no specific hypothesis were stated with the company, however two have been implicitly defined. The first one is that the specific tools selected by the team, once implemented, would improve remarkably the auditors’ performances in terms of time management, accuracy and quality of the outcome. The second one asserts that, by executing the ADAC target pilot first in the IA department, given its supportive role to the whole organization, the success of the project within this area would guarantee an easier overall implementation. It is worth mentioning that none of these hypothesis could have been verified since the project is still ongoing.
ii. Methodology & Analysis
To find a customized strategy to enhance ENGIE’s performance, a multi-method approach divided in three phases was developed: (1) analysis of the good practices in the market, (2) propose possible solutions on different pre-defined scenarios and (3) provide recommendation for the implementation of a strategy plan through practical steps and training content.
In the first phase, the objective was to determine the best performance tools in the market considering the restructured corporate condition, the already implemented analytics tools and the employees’ level of familiarity with DA. For this purpose, a benchmark study on
9 analytics tools applied to IA has been conducted using three different approaches: a Global Market Survey, a Tool Map benchmark analysis and In-Depth Interviews.
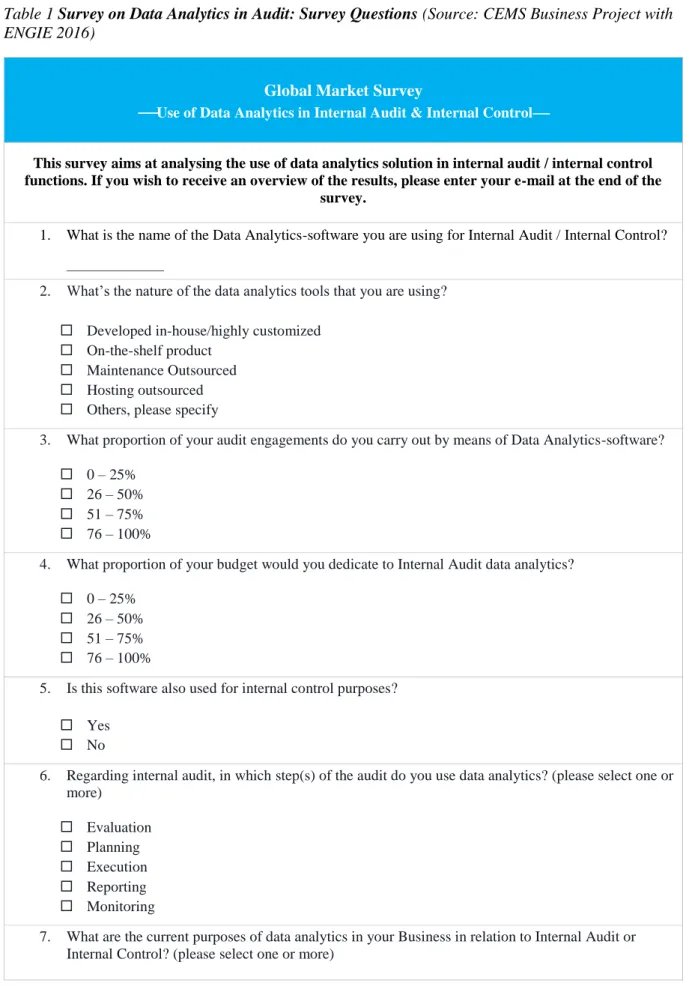
Global Market Survey. The survey on the use of DA in IA and IC aims to investigate the internal auditors’ preferences and experiences with auditing tools. It was conducted online through a LinkedIn Group composed by IA professionals from various industries across the world and resulted in 13 final responses. The survey contains in total 18 questions (both multiple-choice and open questions) that are proposed with an increasing level of detail. (Refer to Appendix, Table 1 for a detailed list of the survey questions). Due to the relatively low number of responses, the final result suffers from statistical significance and representativeness. However, some key findings have raised a particular interest, supporting more specific results obtained in other analysis. To mention some of them, considering the top features an ideal tool should have, respondents cited visualization options (61.5%), multiplatform-system (46.2%), the possibility of customization (38.5%) and the complex analytics possibilities (38.5%). Regarding advantages and disadvantages of the tools respondents are currently using, all those mentioned process large volume of data very good, except for MS Excel. Even if it is the most implemented tool for its user friendliness, it is also the one that received the worst feedback. Tool Map. To give ENGIE an intuitive sense on the performances of different analytics tools, an MS Excel file displaying 24 different tools according to 25 relevant assessment criteria has been created. The criteria have been selected according to ENGIE’s suggestions and each team member’s personal research. Primary research sources included the results of the Global Market Survey, In-Depth Interviews with users and researchers’ personal practical experiences with the tools (interactive demos, YouTube demos and tutorials). The secondary sources were official websites, to gain knowledge about the tools’ technical and functional features, and online review platforms, to obtain a more reliable overview on the performance of each tool. The Tool Map has been designed to allow ENGIE to access rapidly to all the necessary
10 information when looking for the best tool for a specific need. An overview of the overall performance of the tools is provided in the “Toolmap” sheet, using a traffic light colour system to allow a quick comparison for each specific criteria. Hyperlinks and Macro functions have been placed to redirect the user to a dedicated tool sheet, which contains detailed information about its performance in each criteria along with a summary of the key benefits and drawbacks. Furthermore, each tool has been categorized as Data Storage, Modelization, Visualization or Add-on according to its nature and capability. The five key players in each of the four categories have been illustrated through a bubble graph, to compare their performance in specific criteria respect to the other tools within the same category. The overall score of the tool (bubble size) and the criteria chosen to display each category (x- and y-axis), have been selected after having analysed the tools’ different features and each category’s requirements. (Refer to Appendix, Graphs 1-4 for the graphical illustration of the top five data analytics tools for each category). In-Depth Interviews. A list of companies outperforming in IA was provided to ENGIE at the beginning of the project. However, due to time-constraints from both the client and interviewees' side, the team only took part in one exchange. Lacking of a comparison measure, this output has been incorporated only indirectly in the final recommendations.
In the second phase, four different scenarios were defined and depicted by ENGIE: (1) Process reviews within a SAP environment, (2) Process reviews in a non-SAP environment, (3) Fraud Management and Ethics reviews and (4) Continuous Auditing and Monitoring. To select the best tools for each scenario, both primary and secondary information were gathered through the Survey, the Tool Map, personal experience through demos and online researches. It is worth mentioning that the outcomes and related recommendations are based on the analysis and personal perception of the CEMS Team. For each setting, six of the most relevant assessment criteria among the ones mentioned by the Survey’s respondents and the ones displayed in the Tool Map, have been selected to recommend three to four tools (Refer to Appendix, Table 2 for
11 the description of the selected tools and corresponding reasons for each scenario). User-friendliness has been included in the analysis being considered by ENGIE an essential performance indicator given the level of expertise of its General Auditors.
c. Recommendations to the company
The third phase aims to provide recommendations for a strategy plan implementation. Despite the original roadmap defined with the company included also their practical development, ENGIE’s internal complications have brought to a remarkable delay in the project. Thus, the suggestions made are still of rather conceptual nature, including few detailed operative measures. Considering the time-constraints, a flexible and easy to understand approach, Kotter’s 8-Steps process for leading change, was selected. Besides being a renowned change management model, the main reason for this choice was that I personally had already studied it for the purpose of this Work Project. Therefore, the suggestions’ elaboration for each of the 8 Steps was eased by my personal theoretical knowledge18.
1. Establishing a sense of Urgency. This step aims to create a sense of urgency by crafting and using a significant opportunity as a mean for exciting people to join the change. Managers need to have an open conversation about where the company stands, providing compelling reasons to what has to be done to ensure the longevity of the organization. To increase motivation and engagement, ENGIE could show the best practices in the market and relative benefits. Moreover, change tools such as the “Resistance Radar” and Kick-Off Workshops could be deployed to display resistance to change, helping to define counteracting measures.
2. Forming a Powerful Guiding Coalition. This step shows the need to assemble a group of volunteers belonging to different hierarchy levels and departments to drive the change. It is fundamental to create a diverse group, including few exceptional leaders and managers, to offset any of the team members’ weaknesses with the strengths of others. ENGIE’s ADAC
18 Kotter, John P . 2012. “Accelerate!.” Harvard Business Review. November, 17.
12 Team is currently composed only by IT Auditors, which represent a minimum percentage of the whole IA department. Therefore, to understand and satisfy the needs of the majority, few General Auditors need to be included in the team to contribute with their different point of view. 3. Creating a Vision. An easy to communicate and feasible vision has to be designed to help steering the change effort. Having a strategic vision means identifying an emotionally appealing destination for the company and elaborating the related initiatives to reach it. ENGIE has already created its new vision but its communication has not been as effective as desired. 4. Communicating the Vision. To communicate effectively the vision, it is essential to understand what the change means to the employees personally, to proactively engage them in the process. Therefore, ENGIE could organize workshops, trainings and events held by charismatic individuals to spread the new vision. Regular updates regarding the Group’s projects should be shared via Intranet, print media, email and newsletters. An example could be a custom-made video or a pop-up ad on all the relevant intranet pages for Internal Auditors presenting the benefits of the tool incorporated. A constant review and practice of the vision, through personal feedback interviews, a Change Readiness Assessment or a Change Impact Analysis19, is essential to assess the level of commitment of the Internal Auditors at each stage.
5. Empowering others to Act on the Vision. At this stage, senior leadership and the GC empower broad based action encouraging non-traditional ideas, activities and risks taking. Key is the focus on removing obstacles that do not support the change vision. This might include the possibility to adopt new approaches and tools providing the workforce with the right qualifications and training. ENGIE could try the “Train-the-Trainer” format, where instructors incentivize their own motivation while teaching the material. In this way, each party is involved proactively in the process. Another proposal is to develop or hire change leaders, whose role would be to focus solely on the implementation of changes.
13 6. Planning for and Creating Short-Term Wins. To ensure success, short-term wins have to be consistently produced, tracked, evaluated and celebrated independently from the size of the accomplishment and the length of the project. To motivate employees while decreasing resistance towards change, ENGIE could publicly recognize and reward the ones that have contributed significantly to the milestones’ reaching. The “Great Achievement E-mail Award”, an email sent to the entire organization mentioning the achievements and who contributed to them, would reinforce the value of positive behaviours and foster further engagement.
7. Consolidating Improvements and Producing Still More Change. This step focuses on removing or adjusting all the structures, systems and policies that do not fit the vision. New initiatives and projects should be undertaken along with the existing ones, to enhance the overall competitive position. Hiring, promoting and developing should be three key actions for ENGIE to take to reinvigorate the whole change process, bringing new ideas and perspectives to the ADAC Project. Moreover, after having implemented the most suitable tools and achieved the short-term target, ENGIE should conduct an analysis on both successful and failed parts, to prove the feasibility of the change and further improve the existing strategy.
8. Institutionalizing New Approaches. The final step requires continuous efforts in developing the tools to ensure that the change is embedded in the organization and supported by future leadership. Regarding this aspect, ENGIE could formulate a roadmap of future ongoing trainings/feedback-talks and develop a symbolic agreement to seal the Management’s commitment to continue the change process. These solutions might encourage future leaders to develop new policies and processes that will reinforce the changes made so far.
d. Concerns (shortcomings, implementation problems expected)
The set of recommendations presented aims to provide ENGIE with a solid structure for their change strategy when implementing the chosen data analytics methods and tools in IA. Nevertheless, some shortcomings and problems can be already spotted at the current stage. As
14 shown, Kotter’s 8-step process for leading change has as main focus the engagement and motivation of the employees. However, ENGIE’s internal dynamics especially concerning corporate culture related issues, might be too damaged for the measures suggested to be effective. The main problem is linked to the scepticism of the workforce in the validity of the ADAC Project and the wrong mind-set of the executives regarding its priorities. Focusing on the numbers of tools to implement or the percentage of economic growth they will contribute to reach next year, will not lead to success. In fact, ENGIE is still unaware about the actual needs and concerns of the auditors and the reasons for the resistance to change. The most likely consequence of this attitude will be the selection and implementation of the wrong tools, which will not meet the real necessities of the users, thus wasting time and resources. Additionally, the lack of the General Auditors’ point of view limits the effectiveness of the measures adopted, especially since the solutions selected will not probably consider the level of expertise nor the actual needs of these users. Considering the company’s current situation, this might be a fatal error.
e. Individual contribution
From the very beginning, I was appointed as team leader by my colleagues mainly because of my ability to interact effectively and efficiently, especially during the meetings with the managers. For example, during the Kick-Off meeting, my direct way of approaching the team’s knowledge limitation, hence requesting for support and training, enabled the establishment of a cooperative relationship with the company. As team leader, after having set the goals and deadlines with the company for the first phase, I gathered the team and initiated a brainstorming session to decide together the best way to approach it. While waiting for the company’s representative to give us further instructions for the development of the Tool Map, the other two tasks, develop a Global Market Survey and search for international companies for the In-Depth Interviews, were carried out. To optimise the time, I suggested to focus on defining
15 together the structure of the Global Market Survey and doing separately the research for the In-Depth Interviews. Many difficulties were encountered while processing this task. First, the target was very busy professionals who most likely would have not wasted too much time in filling in a long survey, additionally none of the team members had the expertise in the topic to be sure the right questions have been formulated. Therefore, after looking for clarifications regarding the focus of the company, I asked each member to do a research online and offline to understand the topics that needed to be addressed. Personally, I scanned information over the internet, consulting articles, reading specific magazines and reviews on blogs to understand which fundamental aspects users were considering when evaluating data analytics tools. Moreover, I contacted professionals working with data analytics tools belonging to my personal network for informative brief interviews. After having gathered all the required information, I developed and finalized the Survey and sent it to the company’s representative together with the list of companies for the In—Depth Interview to have feedback. Especially concerning the Survey, which was supposed to be spread through the LinkedIn Group created by the company’s representative, time was crucial to get more responses possible to have statistically relevant results to analyse. However, due to internal problems linked to the project, the company’s representative did not reply within a short timeframe. Adjustments and specifications were required once the feedback was given and despite the prompt corrections made, once the Survey was approved, the LinkedIn group was not ready. To try to recover the time, I proposed to start spreading the Survey within the company and to professionals the team could have found online. The company’s representative agreed and created the LinkedIn Group right afterwards. Unfortunately, this situation resulted in almost two weeks of delay respect to the original date set for the spread of the Survey. Stalling phases due to delay in the answer of the company have been a recurring factor during the project. Often the company’s representative was not available, rescheduled the weekly meetings or calls or simply did not
16 acknowledge the group about holidays or days off scheduled. The main issue was that the team was not informed promptly about the problems or news linked to the ADAC Project, resulting in a good amount of time spent reviewing and incorporating information in already completed tasks instead of proceeding with the following ones. Well aware that working in a consulting project involves this type of situations, I tried to keep the motivation of my team up, encouraging to start working on the upcoming task independently. This proactive approach allowed the group to respect the deadlines while mitigating the possible negative effects of the company’s delays, resulting in a stated appreciation by the company’s representative. The part that required more research and was carried out for the whole project was the development of the Tool Map. After having received the company’s representative’s instructions on the possible tools to explore, I divided them among each member. As my colleagues, I analysed each one of my six tools considering the benchmark criteria defined by the team and approved by the company. I acquired information mainly online from official webpages and multiple review websites (e.g. G2 Crows) to be able to have a good comparison metrics. To evaluate it accurately, I tested it in first person through demos when they were available for free trial. To gain additional expertise, I also watched YouTube video tutorials and conferences. During this process, each member of the group encountered difficulties in finding information regarding specific criteria, mainly because some of the tools analysed were less used than others. Therefore, I made sure to support them in their researches, establishing an environment of full cooperation and collaboration. This resulted in an efficient time management and a better understanding of all the tools by the whole team. The deadline for the delivery of the Tool Map was respected and being already halfway with the total duration of the project, it was crucial to proceed with the second phase. However, this was linked to the results of the first one; therefore, the team had to wait for the company’s feedback before being able to proceed. Unfortunately, despite some initial exchange of emails, delays from the company’s side occurred and for
17 almost a week, no feedback was given. When the company’s representative called to update the team, the level of depth of the analysis and the completeness of the work was highly appreciated and remarked as a very good result for students who are not experts in the field. The Project Advisor shared this opinion, congratulating the team during the Intermediate Presentation for the work done so far. The second phase of the project was approached as the first one in terms of organization (brainstorming session, division of the four scenarios between the team members and finalization of the work within a meeting setting). Regarding the scenario planning development, my task was to analyse a potential Fraud case. The objective was to find the best detecting tools that also included features for managing compliance and ethical issues. As for the first phase, I conducted a thorough research on the best tools, considering also the ones analysed in the Tool Map. Once completed this task and submitted to the company for a final feedback, the focus shifted to the development of the final recommendations. It is in this final phase that I could significantly add value to the project. This task was initiated a week before the delivery of the Business Project report, so the time available to search for specific solutions was short. Aware of the necessity to develop a strategy that had solid base and record of success, I proposed my colleagues to use a renowned change management model, Kotter’s 8-Steps for Leading Change. For the purpose of this Work Project, I had already studied the model being one of the main theories presented in my academic discussion. The suggestion was accepted with enthusiasm, especially given its simple and focused structure. Being the only one with the required theoretical and practical knowledge, I divided the 8 steps among each team member, me included, and took time to explain individually the focus of the assigned specific stages. Afterwards, each member developed a set of change tools and I was in charge of supervising and selecting the most relevant ones for each step. The whole team than revised the recommendations to make sure everyone approved the tools selected and understood the reasons behind that specific choice. Given the time constraints, the company was able to discuss
18 the proposed solutions only during the final presentation. ENGIE was positively impressed by the approach selected and would have appreciated to be able to extent our collaboration for its further development. Overall, the company and especially the Internal Audit Director, were amazed by the quality of the work done. Admitting his difficulty in following long presentations, he congratulated for the excellent presentation skills and stated that the team managed to make very appealing something that by nature it is not. Moreover, he highlighted his appreciation for the high quality consulting-style Power Point slides, which template and structure were realised by me and then used as reference by my colleagues. As a conclusion of the final presentation, he offered the team to travel to Paris in July and present the work to the whole Audit team during an official event.
For the whole duration of the project, I made sure that the objectives were clearly stated and understood by everyone as well as the deadlines, both internal and with the company, were met. Being the team leader, I left my colleagues working independently according to their availability and work-style, always monitoring the progress and quality of their work as well as asking if they were having issues or needed any help to complete their task. As it happens in any project, unforeseen situations occurred risking to compromise the development of the work. Nevertheless, my colleagues recognized me as a point of reference to turn to in case of difficulty. This ensured a prompt reallocation of the work to carry out all the tasks on time and with high quality. Moreover, all the delays and setbacks with the company strengthened my role as facilitator and motivator within the team, allowing me to improve my management skills within under pressure situations.
3. ACADEMIC DISCUSSION
a. Possible links with your MSc field (Economics, Finance, Management)
As observed during the Business Project, despite the benefits that customised data analytics would have brought to ENGIE’s IA department, Internal Auditors seemed to be reluctant to its
19 implementation. Driven by the willingness to provide ENGIE with an effective strategy to change their perception, thus engage them to assure the success of the project, I conducted a thorough research to identify the possible causes of this behaviour. The following paragraphs will present an analysis based on key findings and validated behavioural economics theories that prove how knowledge and perception can influence the individual’s choices, thus their feeling towards change. The results obtained have contributed to support the main thesis, for which the definition of a tailored strategy considering these drawbacks is key to the successful integration of changes. A practical example using Kotter’s 8 Step for Change Management model, has been provided to prove this theory.
b. Relevant theories and empirical studies
As clearly stated by James Guszcza in the article “Why Some CEOs are so sceptical of Analytics”, today’s biggest obstacle to the integration of analytics in business realities is the executives’ dilemma in the shift from “Man vs. Machine” to “Man and Machine” 20. Despite
operating in a world increasingly depending on digital sources, too often seniors are hesitant about adopting these new solutions within their operation processes. One of the implications that both senior managers and their staff fear is that the “machines” will replace the human skills, entailing a potential downsize in the workforce21. Additionally, executives do not want to risk incurring into failures for having based their decisions over data provided by a mathematical model, which might not be 100% correct. In fact, as pointed out by Guszcza, the main hindrance CIOs find in displaying the benefits of data analytics is that CEOs expect these tools to predict risks and opportunities flawlessly. This misconception over the real purpose of analytics - support the work of the users allowing descriptive, predictive or prescriptive analysis to enhance the overall performance22- may arise due to several reasons. First, despite the
20 Guszcza, James. 2012. “Why Some CEOs Are So Skeptical of Analytics”. Deloitte CIO Journal, Wall Street Journal, June 5.
http://deloitte.wsj.com/cio/2012/06/05/403/ [Accessed 11 Apr. 2016].
21 Marliot, Emmanuelle. 2016. “Active Data Analytics Cell – ADAC Presentation for CEMS”. Internal Presentation for the CEMS Team. 22 Analytics. 2016. BusinessDictionary, http://www.businessdictionary.com/definition/analytics.html [Accessed 16 May 2016].
20 common belief, in times of uncertainty executives tend not to react in a controlled, rational and logical way. As analysed by Amos Tversky and the economics Nobel laureate Daniel Kahneman in the paper “Prospect Theory: an analysis of decision under risk”, under specific uncertain conditions individuals do not behave following the expected utility model formally elaborated by von Neumann and Morgenstern in 194423. The expected utility model states that, under uncertain prospects, when choosing among a lottery composed by all the possible preferences, the rational individual (defined as the one whose decisions satisfy the four axioms of completeness, transitivity, continuity and independence) will always select the option that maximizes the expected value of the utility function. Considering this definition, the model implicitly states that only those individuals whose preferences do satisfy the axioms can be considered reasonable, therefore make reasonable choices. As also affirmed by Kahneman and Tversky“… most of the people actually do, most of the time”24. However, by exploring the cognitive thinking process through different classes of choice problems, the authors have proved that the individuals’ preferences violate systematically the expected utility’s axioms. The Prospect Theory developed by Kahneman and Tversky, aims to propose an alternative approach that explains some of the dilemmas and paradoxes observed in the expected utility theory. This theory states that there are two phases in the decision making process: the editing phase and the evaluation phase. During the first phase, information are coded, organised and reformulated to make the valuation face, hence the final choice, easier. The individual selects the outcomes that he/she considers equivalent and sets a reference point, which can be the individual’s current status quo or the one he/she aspires to achieve. Outcomes are then defined as losses or gains according to their value respect to the reference point (e.g. if the outcome has a lower value than the reference point it is considered a loss; vice versa for a gain). With regard to this aspect, Kahneman and Tversky have shown through empirical evidence that the context
23 Neumann, John von and, Oskar Morgenstern. 1944. Theory of Games and Economic Behavior. Princeton, NJ. Princeton University Press. 24 Kahneman, Daniel, and Amos Tversky. 1979. “Prospect Theory: an analysis of decision under risk”. Econometrica, 47(2): 263-292
21 in which decisions are made and the expectations of the individuals, have a fundamental impact on the decision itself (framing effect) (Refer to Appendix, Practical Example Nr.1 for a specific example). Additionally, Kahneman and Tversky have demonstrated that, in condition of uncertainty, people tend to overweight outcomes that are certain respect to those that are solely probable (the certainty effect). In fact, the feeling of a loss affects deeper the individual leading to the adoption of a risk-averse behaviour25. As proven through practical examples, when
outcomes are presented in a negative prospect the individual’s preferences are reversed (Refer to Appendix, Practical Example Nr.2 for a specific example). This effect has been defined the reflection effect and entails that if in the positive domain the decision-maker was showing risk aversion, in the negative prospect the behaviour is mirrored, thus he/she would present a risk seeking attitude26(Refer to Appendix, Table 3 for a numerical representation of the reflection
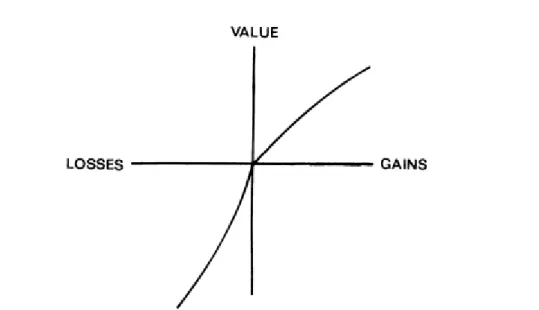
effect). After having coded, combined, segregated the different options, they are valued based on the change of wealth or welfare and not on the final state as it happens in the expected utility theory. What influences the individual’s final choice is the estimation of how relevant is the change respect to his/her reference point. For example, in the case of the implementation of DA within ENGIE, while for the ADAC Team the change is a great opportunity of improvement that would lead to a more promising future, for the IA staff it is perceived as a waste of time and resources that could also end in their termination. The value of a particular change can be described as a function with two arguments: the magnitude of the change and the asset position that works as reference point27. The value function proposed by Kahneman and Tversky considers losses and gains as negative or positive deviations from the reference point, which is the zero of the graph. Moreover, it is generally convex for losses and concave for gains and presents a steeper trend for losses rather than for gains (Refer to Appendix, Figure 3 for a
25 Kahneman, Daniel, and Amos Tversky. 1979. “Prospect Theory: an analysis of decision under risk”. Econometrica, 47(2): 266 26 Kahneman, Daniel, and Amos Tversky. 1979. “Prospect Theory: an analysis of decision under risk”. Econometrica, 47(2): 268 27 Kahneman, Daniel, and Amos Tversky. 1979. “Prospect Theory: an analysis of decision under risk”. Econometrica, 47(2): 277
22 graphical representation of the Value Function). Linked to this representation, the authors also elaborated a weighting function, for which each outcome is valued with a different weight. As discussed, multiple elements such as ambiguity and vagueness can influence an individual’s decision. As when deciding whether to undertake a project or not, the success or failure of the outcome is not the only factor considered by the individual. Therefore, the weighting function considers weights as functions of given probabilities and not as mere probabilities like in the expected utility model. As demonstrated also by Richard Thaler28, without uncertainty the value of an asset that could be acquired is lower than the value of something that could be lost. Through this theoretical digression, it is already possible to understand that the reason why CEOs are sceptical about implementing analytics might be influenced by factors like the context in which the decision is asked to be made or by the personal attitude towards risk.
On the base of the prospect theory, Kahneman has explored further the decision making process, discovering that despite making rational decisions most of the times, people make systematic errors. As analysed in his work “Thinking, Fast and Slow”, these errors are not the result of the contamination by emotions but more a consequence of the construction of the cognitive system. As pointed out by John List, if it is true that the context in which a choice is made influences the outcomes, it is also true that individuals often use their experience - and not emotions associated with acquiring or losing belongings - to make long-term decisions29. Kahneman affirms that the mental operations that allow individuals to understand the world are run by two Systems. System 1, “automatic, effortless, often conscious, and associatively coherent”, proposes a draft of the reality based on intuitions and perceptions of the moment whereas System 2, “controlled, effortful, usually conscious, tends to be logically coherent, rule-governed”, disposes more rationally the logical reasons for which that particular choice has to
28 Kahneman, Daniel, Jack L. Knetsch and Richard H. Thaler. 1991. “Anomalies: The Endowment Effect, Loss Aversion, and Status Quo
Bias”. The Journal of Economic Perspectives. 5(1): 193-206
23 be made30. Although System 2 might seem the part of the cognitive reasoning that drives
decisions, it also tends to tires easily. Its laziness leads it to endorse heuristic answers given by System 1 without examining the logic behind that information31. This approach clearly explains why in complex decision settings biases affect more the executives’ thinking process, thus leading to a final choice not supported by data evidence. Considering their authority and power, the narrative created contributes in making the decision taken appear to be coherent and consistent to employees and shareholders, thus being accepted without questioning. Moreover, managers, especially those running more mature businesses, have built their success relying mainly on personal experience and instincts. Therefore, it is reasonable to accept that rather than relying their choices on models that still do not guarantee impeccable results, they trust more their own judgement. Nevertheless, decisions cannot be based solely on past experience. Integrating changes within a company has always represented a remarkable challenge. However, today has become imperative to develop an organizational structure that promptly addresses new opportunities, undertakes risks and elaborates agile strategies able to outperform in a changing environment. As observed by Kotter, while in the past change could have been planned and executed in years without major consequences, today this is no longer an option32.
For this purpose, in 2012 the author updated his renowned 8-Steps for Leading Change model, introducing some “accelerating” factors. The main differences respect to the model developed in 1995, previously described in this paper, are that (1) while the steps respond to episodic change and are used in finite, sequential and rigid ways, the accelerators are continuously working; (2) not a small core group but a “volunteer army” should be formed when leading change and (3) a flexible and agile network is essential when using accelerators33. As stated by the author and criticized by many others, the 1995 model presented many features that do not
30 Kahneman, Daniel. 2011. “Thinking, Fast and Slow”. New York. Farrar, Straus and Giroux 31 Kahneman, Daniel. 2011. “Thinking, Fast and Slow”. New York. Farrar, Straus and Giroux 32 Kotter, John P . 2012. “Accelerate!.” Harvard Business Review. November, 17.
24 fit anymore the current business environment. In fact, the 8-Steps process was designed to outperform in more hierarchical businesses, where it was implemented only within a specific occasional change. In this context, the network was considered as a relevant element that, however, needed to report to the hierarchy. Although today businesses still have hierarchical structures, they are more flexible and opened to communication than before. The workforce engagement has been increasingly relevant, being their cooperation essential to implement successfully changes across the organization. As stated by Kotter, appealing to the employees’ emotions, enhancing the importance of their contribution and giving a greater meaning and purpose to their work is the key to drive change34. The 2012-updated model takes this aspect particularly in consideration, proposing the hierarchy and the network as two systems that need to cooperate continuously. The main concept that Kotter defines is that while the hierarchy system purpose is to perform all the regular daily tasks, the strategy network system runs autonomous operations focused on continually formulating and developing strategies. Through this significant innovation, businesses can identify and adapt faster to changes, developing the right measures to maximize their benefits. Despite the updated model seems to be most suitable for a fast-changing environment, companies should not underestimate the relevance of identifying first the nature of their resistance to change and consequently select an approach. Analysing ENGIE’s case, the development of the ADAC Project was the result of an opportunity identified after having implemented the new more agile structure, introduced to perform faster and better in a mutable environment35. Considering this aspect, ENGIE could adopt the 2012-updated model, being elaborated specifically to rapidly and successfully implement changes. However, as remarked in this paper, the company is struggling to engage its workforce within this project due to the spread scepticism towards the actual benefit of DA. Being a rather new entity, ENGIE clearly lacks of a strong corporate culture, which is a key
34 Kotter, John P . 2012. “Accelerate!.” Harvard Business Review. November, 17.
25 element to motivate and encourage employees to proactively join the challenge. Thus, building a volunteer army as suggested by the updated model, instead of starting with a small Guiding Coalition as proposed in the 1995 version, is not a feasible option given the current status of the company. Moreover, despite being only the second relevant change after the reorganization in January 2016, ENGIE is already encountering multiple difficulties and consequent delays with the ADAC project. As observed in detail in the first part of this argumentation, the unclear display of the urgency of change or the wrong framing of the real added value that analytics could bring, lead executives and staff to endure. Facing already such a difficult situation, ENGIE would not able yet to formulate and implement changes continuously as the updated model proposes. Therefore, the 1995 model is again a better solution. Concluding, for ENGIE’s current situation, it can be stated that regardless of the validity of the 8-Steps updated model, the 1995 approach seems more suitable. However, in the long term, a transition towards a more dynamic approach such as the updated model, might be essential to exploit fully the capability of the new organization.
The main conclusion that could be drawn by this study is that, independently from the relevance of the model chosen and its stated success, enterprises should always focus first on identifying the reasons behind the resistance to change. Once these have been clearly determined, a tailored model to support the engagement of the workforce and therefore successfully implement the change can be selected. Nevertheless, a golden rule should always be kept in mind: models are not sets of strict directions to follow. They are guidance tools and should be considered as such when using them to implement any kind of change.
c. Implications for theory and future research
Considering possible future implications, researchers might investigate deeply whether this thesis is proven to be statistically verified or not. As of today, many success stories can be consulted to demonstrate the efficacy of the model previously mentioned. However, no specific
26 quantitative or qualitative study including a significant number of companies has been elaborated. Regarding the specific case of DA, CIOs could elaborate researches proving how predictive models can, for example, visibly increase the profitability or improve considerably the workforce attitude towards change, to convince easily sceptical CEOs.
4. PERSONAL REFLECTION
a. Personal experience
As a management student with an academic background in marketing, at the beginning the topic assigned really intimidated me. The fear of failure for lacking the knowledge and expertise in the field overwhelmed me, making me wonder if I would have been able to develop the required technical skills to perform the specific tasks. Yet, as Martin Luther King said “the ultimate measure of a man is not where he stands in moments of comfort and convenience, but where he stands at times of challenge and controversy”. Being optimistic by nature, I was ready to take this challenge, overcoming my limits to deliver the best result to the client.
i. Key strengths & weaknesses observable during the project
During the last years, feedback has been a powerful tool to improve my overall performance, since personal evaluations can often be biased by the individual’s perception. To have an objective and honest assessment of my strengths and weaknesses, I asked my colleagues to assess my performance within the project. A positive characteristic emphasised is that my structured work style has contributed significantly to the development of the project. My positive and strategic approach always based on open communication and feedback has been considered as the key to the efficiency of our meetings. My personal values of honesty, exchange of ideas and embracement of different points of view have become more salient during the whole project. Moreover, my leading role as motivator and facilitator has been perceived as fundamental to stick to the deadlines and deliver a greater output, adding noticeable value to the overall work. Considering my weaknesses, my colleagues asserted that
27 I have improved greatly during the project. Although I struggled in the beginning to explain concisely my ideas, supporting them with additional facts, I learned through feedback to be more straight-to-the point. This has helped me especially when dealing with difficult situations, becoming more efficient in my contribution and more effective in my role as facilitator.
ii. Plan to develop of your areas of improvement
My colleagues’ feedback has been decisive to identify a weakness I have never perceived to have. This encouraged me to pay more attention and work on exposing thoughts clearly and with fewer words. To improve further in this area, I have started reading specific articles and books to learn the best way to structure and present my ideas, such as “The Pyramid Principle, Logic in Writing and Thinking” by Barbara Minto.
b. Benefit of hindsight
Looking back at my journey today, I am able to say that being part of this project really helped me growing personally and professionally more than I could ever expected. Knowing how much I would have learned, probably starting again I would have worried less and have approached the whole project with a different spirit from the very beginning. However, I strongly believe that challenges are put on our path because we are able to face them. They are opportunities of evolution and growth to shape our best selves. Therefore, seeing how much this experience has enriched me, I would not change a single step of it. Being pulled out of the comfort zone is always very intimidating and challenges the individuals to learn how to show their value despite the adverse conditions. This experience allowed me to discover a completely new world linked to the business environment that otherwise I would have never had the chance to explore. Business schools provide us with all the tools to understand what we are best at, what is that we really love and would like to do in our future careers. However, what I have learned is that you never know what you might or might not love until you actually try it. Through this tough yet inspiring experience, I have realised that to become the best version of yourself it is essential
28 to be really open-minded and willing to learn something different. I still am convinced about building my career in the marketing area, but as of today I can enter the market with a more complete knowledge, a wider perspective and a better understanding of my strengths and weaknesses that will allow me to show my true value to my future employers.
29
APPENDIX
FIGURES
Figure 1 Outlook of the Highest and Lowest global performers according to EAPI 2016 (Source: World Economic Forum, EAPI 2016)
Figure 2 Outlook of the Highest and Lowest global performers in the energy access and security according to EAPI 2016 (Source: World Economic Forum, EAPI 2016)
30 PRACTICAL EXAMPLES
Practical Example Nr.1
When comparing a sure gain with a probable one in a positive domain, individuals will choose the certain one despite the fact that the mere probable one gives a larger benefit. However, when proposing the same options but both in condition of uncertainty (e.g. reducing of the same amount the probability of loss for both outcomes), the alteration of the certain prospect to a probable one shows a greater reduction in desirability then when both the original and the reduced prospect are uncertain36. This case shows that individuals do violate the expected utility theory, especially the axiom of transitivity (or substitution), which says that if A is preferred to B, than any probability mixture of A must be preferred to the mixture of B.
Practical Example Nr.2
To make this concept clearer, it is possible to consider the same example proposed for gains earlier, analysing now losses. When comparing a loss with no variance respect one with a larger variance, individuals will choose the former despite the fact that the outcome could be lower in value. However, when proposing the same options both reduced of the same probability of gaining, the alteration of the prospect with no variance might lead the decision maker still to desire it more than the option that already originally had variance included. This behaviour shows that “certainty increases the aversiveness of losses as well as the desirability of gains”.
36 Kahneman, Daniel, and Amos Tversky. 1979. “Prospect Theory: an analysis of decision under risk”. Econometrica, 47(2): 265-266
Figure 3 An Hypothetical Value Function (Source: The Prospect Theory, D. Kahneman & A. Tversky)
31 TABLES
Table 1 Survey on Data Analytics in Audit: Survey Questions (Source: CEMS Business Project with ENGIE 2016)
Global Market Survey
Use of Data Analytics in Internal Audit & Internal Control
This survey aims at analysing the use of data analytics solution in internal audit / internal control functions. If you wish to receive an overview of the results, please enter your e-mail at the end of the
survey.
1. What is the name of the Data Analytics-software you are using for Internal Audit / Internal Control? –––––––––––––
2. What’s the nature of the data analytics tools that you are using? Developed in-house/highly customized
On-the-shelf product Maintenance Outsourced Hosting outsourced Others, please specify
3. What proportion of your audit engagements do you carry out by means of Data Analytics-software? 0 – 25%
26 – 50% 51 – 75% 76 – 100%
4. What proportion of your budget would you dedicate to Internal Audit data analytics? 0 – 25%
26 – 50% 51 – 75% 76 – 100%
5. Is this software also used for internal control purposes? Yes
No
6. Regarding internal audit, in which step(s) of the audit do you use data analytics? (please select one or more) Evaluation Planning Execution Reporting Monitoring
7. What are the current purposes of data analytics in your Business in relation to Internal Audit or Internal Control? (please select one or more)
32 Increase productivity and reduce operating costs in Internal Audit/-Control, establishing more
automated approach
Obtain independence from IT-departments to perform analysis Increase coverage of risks by Internal Audit/-Control looking Better identify trends, quantify exceptions and root causes Identify potential fraud alerts
Provide an in-depth analysis of key issues and root cause analysis Dive deeper into organizational data to reach more complex problematic Identify process efficiency drivers and cost optimisation sources Implement continuous audit and/or control
Identifying additional insights from data, e.g. emerging risks Provide predictive or prescriptive analysis
Others, please specify
8. Who is using the tool in your company? (multiple answers possible) General Auditors
IT Auditors Risk officers
Dedicated team internal to audit / internal control Dedicated team internal to the company (IT department) Outsourced to third-party
Others, please specify
9. Which type of training did you have to learn how to use the tool? (multiple answers possible) Demo training included in the tool
Formal training sessions organized by the company Formal training sessions organized by the tool editor Professional external events
Lunch-and learns with industry leaders Others, please specify
10. What are the main advantages regarding your data analytics-software? (please select one or more)
User-friendliness (also for non IT-auditors) Possibility of customization
Efficient processing, even with high volumes of data Existence of library of pre-set queries per risk Preservation of source data
Traceability of data treatments Repeatability of queries Visualization options
Complex analytics possibilities
Multi-platform system (in connection with e.g. SAP, Oracle) Web-based deployment
Security of data
Training available (documentation, webinars, online, in Person, etc.) Support (online, support-service, etc.)
Cost
33 11. What are the main challenges/disadvantages that you encounter in using your data analytics
software? (please select one or more) Lack of clarity around the process Lack of expertise - lack of training Incomplete/inaccurate input data
Difficulty to repeat queries from one environment to another Large amount of false positives
Sheer data volume slows processing
Budget limitations to improve data analytics capabilities Difficulties of sharing information among business units
12. What feature are you still missing in your data analytics software?
–––––––––––––
13. Please, select 5 top features the ideal tool should have (multiple answers possible)
User-friendliness (also for non IT-auditors) Possibility of customization
Efficient processing, even with high volumes of data Existence of library of pre-set queries per risk Preservation of source data
Traceability of data treatments Repeatability of queries Visualization options
Complex analytics possibilities
Multi-platform system (in connection with e.g. SAP, Oracle) Web-based deployment
Security of data
Training available (documentation, webinars, online, in Person, etc.) Support (online, support-service, etc.)
Cost
Others, please specify
14. If applicable, what tool would you specifically recommend to use for internal audit or internal control respectively?
–––––––––––––
15. What industry do you work in? Banking & capital markets Communications
Consumer goods Energy
Entertainment & Media Government
Healthcare Insurance Manufacturing Mining
34 Power & Utilities
Retail Technology
Others, please specify 16. In which area do you work?
Internal audit Risk management Internal control Others, please specify
17. What is the size of your company? 0 – 250 employees
251 – 1,000 employees 1,000 – 10,000 employees More than 10,000 employees
18. What is the main system used in your company? (please select one) SAP
Oracle
Others, please specify
If you wish to receive an overview of the results, please enter your e-mail address
–––––––––––––
Thank you for taking the time to complete this survey and your input is greatly appreciated!
Table 2 Scenario Planning - Recommendations (Source: CEMS Business Project with ENGIE 2016)
1st Scenario – Process Review In A SAP Environment.
For this specific scenario, we recommend ACL Analytics as the most suitable and efficient tool for ENGIE Internal Audit. It is a very performant software that is particularly suited for audit-related tasks. Its overall performance on the selected criteria places it on the top of our ranking. Indeed, it is easy to learn (even for non IT auditors), it contains pre-set criteria and KPIs that are relevant for audit-specific queries (e.g. matching of transactions, missing transactions, etc.) and gives the
possibility to expand the set of analyses through scripting, it has the ability to process millions (even billions) of records from different types of data and it can be seamlessly connected to SAP.
Alternatively, CaseWare IDEA is another user-friendly data analytics tool that meets all
requirement to complete complex audit-related tasks. However, it requires the purchase of a secure connector such as SmartExporter to work effectively in SAP environments. Oracle GRC is a modular suite of applications that offers interesting features. However, it is less focused on audit than the first two tools, since it also encompasses governance, risk and controlling. Finally,
Microsoft Power BI is a highly user-friendly tool and offers great visualization options but it is not audit-specific and does not provide complex analytics possibilities by itself. Moreover, it struggles with huge data volumes.