Universidade de Aveiro Ano 2018
Departamento de Engenharia Civil
BÁRBARA CARINA
GONÇALVES
MARINHO
ALIMENTAÇÕES ARTIFICIAIS COMO SOLUÇÃO DE
DEFESA COSTEIRA: ABORDAGENS DE
MONITORIZAÇÃO E MODELAÇÃO
ARTIFICIAL NOURISHMENTS AS A COASTAL
DEFENSE SOLUTION: MONITORING AND
MODELLING APPROACHES
Universidade de Aveiro Ano 2018
Departamento de Engenharia Civil
BÁRBARA CARINA
GONÇALVES
MARINHO
ARTIFICIAL NOURISHMENTS AS A COASTAL
DEFENSE SOLUTION: MONITORING AND
MODELLING APPROACHES
Tese apresentada à Universidade de Aveiro para cumprimento dos requisitos necessários à obtenção do grau de Doutor em Engenharia Civil, realizada sob a orientação científica do Doutor Carlos Coelho, Professor Auxiliar do
Departamento de Engenharia Civil da Universidade de Aveiro, e coorientação científica do Doutor Magnus Larson e do Doutor Hans Hanson, Professores Titulares do Departamento de Engenharia e Recursos Hídricos da Universidade de Lund.
Apoio financeiro da FCT e do FSE no âmbito do III Quadro Comunitário de Apoio, através da bolsa de
I dedicate this work to my entire family, who has unconditionally supported me along the way, especially to my parents and sisters. May this work inspire my nephew and nieces to pursue their dreams and transcend further goals beyond this one.
o júri
presidente Prof. Doutor João Carlos de Oliveira Matias
professor catedrático da Universidade de Aveiro
Prof. Doutor Carlos Daniel Borges Coelho
professor auxiliar da Universidade de Aveiro
Prof. Doutor José António Jiménez
professor catedrático da Universitat Politècnica de Catalunya
Prof. Filipa Simões de Brito Ferreira de Oliveira
Investigadora auxiliar do Laboratório Nacional de Engenharia Civil
Prof. Doutor Rui Pires de Matos Taborda
professor associado com agregação da Faculdade de Ciências da Universidade de Lisboa
Prof. Doutor Paulo Manuel Cruz Alves da Silva
agradecimentos Chegado o momento de retrospeção, defino estes últimos arredondados quatro anos de academia, inteiramente dedicados à investigação científica, como uma verdadeira montanha russa de trabalhos e emoções, marcados por altos e baixos, momentos de maior e menor inspiração, que finalmente culminam no fecho de mais um ciclo de estudos. Deste trabalho emergiram múltiplos desafios, oportunidades, projetos, colaborações, apoios e amizades, aos quais eu não poderia deixar de expressar os meus mais profundos agradecimentos.
Em primeiro lugar, ao meu orientador e professor, Carlos Coelho, que durante todos estes anos cultivou em mim todo o entusiasmo, interesse e curiosidade pelas zonas costeiras e pelo mar, servindo-me de inspiração e modelo real de profissionalismo. A ele, agradeço de forma genuína toda a partilha de saberes e experiências, incentivo, disponibilidade, oportunidades de progresso, e claro, toda a orientação científica materializada por inúmeras críticas construtivas atempadas, sugestões pertinentes de melhoria e revisões minuciosas.
Em segundo lugar, agradeço aos meus coorientadores, Prof. Magnus Larson e Prof. Hans Hanson, por me terem convidado e acolhido na Divisão dos
Recursos Hídricos da Universidade de Lund. A eles, agradeço o apoio direto prestado durante o meu período de mobilidade, mas também todas as
contribuições de caracter científico que foram fluindo, mesmo à distância, para levar todo o trabalho desenvolvido a bom porto, bem como a participação ativa de cada um nas decisões mais importantes que acabaram por talhar o meu percurso doutoral.
Gostaria de igualmente agradecer à Fundação para a Ciência e Tecnologia pela concessão de uma bolsa de doutoramento mista, a qual me deu
oportunidade de alargar significativamente os meus conhecimentos e explorar novas ambiências profissionais para além-fronteiras, nascendo
involuntariamente em mim a preocupação por causas sociais e tornando-me numa embaixadora de programas de intercâmbio. Agradeço a todos os meus colegas, tal como eu, voluntários da associação Erasmus Student Network, pelo companheirismo neste projeto. À Fundação Luso-Americana agradeço o apoio financeiro concedido e que me possibilitou cruzar o Atlântico para disseminação do meu trabalho no âmbito de um dos melhores congressos na área da engenharia costeira. À Administração do Porto de Aveiro, em especial à Eng. Maria Manuel, gostaria de agradecer a disponibilização dos dados de campo que têm vindo a ser recolhidos pelo Porto de Aveiro e que constituíram um dos principais instrumentos deste trabalho.
Por fim mas não menos importante, gostaria de agradecer a todos aqueles que me apoiaram ao longo deste percurso e que indiretamente contribuíram para a conclusão deste trabalho: os meus colegas e amigos da equipa de
gambozinos da UA, que cultivaram em mim a paixão pelo ultimate frisbee, em especial ao Joaquim, aos meus colegas e amigos do TVRL e do innebandy, em especial ao Clemêncio, Pondja, Denis, Miguel, Yhieng, Dong, Jie, Jing, Palalane, Kamshat, Maria, Cintia e Randi, aos meus colegas do NEFEC e do DECivil, em especial ao António, aos meus buddies Pasquale e Luca, pelo imenso apoio nesta fase final, à Mané, amiga e english teacher, ao Jorge, por todo o companheirismo, incentivo e amizade, e por fim, à minha família, pais, irmãs e sobrinhos que sempre acreditaram em mim!
acknowledgements Coming the time for retrospection, I define my last four years of academy, entirely dedicated to the scientific research, as a true roller coaster of hard-working and emotions, marked by ups and downs, loops made of moments of greater and lesser inspiration that finally culminate with the end of another cycle of studies. From this work, multiple challenges, opportunities, projects, collaborations, supports and friendships have emerged, to who I could not fail to express my deepest thanks.
First of all, to my supervisor and professor, Carlos Coelho, who during all this period has cultivated in me all the enthusiasm, interest and curiosity for the coastal zones and the sea, serving me as inspiration and real model of professionalism. To him, I genuinely would like to thank all the sharing of knowledge and experience, encouragement, availability, opportunities of progress, and obviously, all the scientific guidance materialized by numerous timely constructive inputs, pertinent suggestions for improvements and rigorous reviews.
Secondly, I thank to my co-supervisors, Prof. Magnus Larson and Prof. Hans Hanson, for inviting me to the Water Resources Engineering Division at Lund University. I want to thank all the support kindly provided by them during my period of mobility, but also all the relevant scientific contributions that flowed, even from distance, to highly raise the value of this work, as well as the active participation of each one in the most important decisions taken over the course of my PhD studies.
I would also like to thank the Foundation for Science and Technology for the mixed grant, which has given me the opportunity to significantly extend my knowledge and explore new professional ambiences across borders, involuntarily arising in me the concern for social causes and turning me an ambassador for exchange programs. Thanks to all my colleagues, like me, volunteers of the Erasmus Student Network, for the companionship in this project. I also thank to the Luso-American Foundation for the financial support granted, allowing me to cross the Atlantic to disseminate my work in the context of one of the best conferences in the area of coastal engineering. To the Aveiro Harbor Administration, especially to Eng. Maria Manuel, I would like to thank for making available a set of monitoring data collected by the AHA, which has constituted one of the main instruments of this work.
Last but not least, I would like to thank to the people who supported me along the way and who indirectly contributed to the conclusion of this work: my colleagues and friends from Gambozinos team, who have cultivated in me the passion for the ultimate frisbee , especially to Joaquim; to my colleagues and friends from TVRL and innebandy, especially to Clemêncio, Pondja, Denis, Miguel, Yiheng, Dong, Jie, Jing, Palalane, Kamshat, Maria, Cintia and Randi, to my NEFEC and DECivil colleagues, especially to António, to my buddies Pasquale and Luca, for the great support in this final stage, to Mané, friend and english teacher, to Jorge, for all the companionship, encouragement and friendship, and finally, to my family, parents, sisters and nephews, who have always believed in me!
palavras-chave trecho costeiro Barra-Vagueira, dragagem, actividades de deposição, evolução do perfil de praia, CS-model, resposta submersa, sistema de duas barras, tomada de decisão
resumo Atualmente verifica-se um crescente interesse internacional por soluções de engenharia ambientalmente sustentáveis, capazes de combater a erosão, aumentar a largura da praia e manter a segurança das zonas costeiras. Ao longo das últimas décadas, tem-se assistido a uma mudança de paradigma no que toca à política de proteção da costa, que tem cada vez mais privilegiado o recurso às alimentações artificiais em detrimento das tradicionais estruturas de defesa costeira pesada.
Esta dissertação começa com uma revisão da literatura sobre a passada vs
presente evolução do litoral português, dando ênfase a aspetos relevantes da gestão costeira (estruturação e processo de tomada de decisões politicas), bem como as principais estratégias de proteção que têm sido discutidas no contexto das futuras propostas de adaptação para as zonas costeiras, servindo para destacar os principais desafios e problemas de algumas regiões do litoral português. Como tentativa de disseminação do conhecimento científico
acumulado sobre o comportamento das alimentações artificiais, este estudo foi direcionado para análise de um conjunto de dados de campo recolhidos no âmbito de um programa de monitorização estabelecido para cumprir com a legislação portuguesa e a política nacional de gestão para controlo dos impactos ambientais associados ao uso combinado de operações de dragagem e deposição na vizinhança de portos marítimos. Considerando o melhoramento da capacidade de modelação numérica, um objetivo igualmente importante para se garantir uma boa previsibilidade da evolução de praias alimentadas, nesta dissertação, um foco especial é também dado ao estudo da evolução do perfil transversal de praia, uma vez que a resposta das
alimentações estão intrinsecamente relacionadas com a dinâmica sedimentar natural. Foi apresentado e aplicado um modelo numérico recente e inovador, que segue uma descrição simplificada da evolução do perfil transversal de praia (incluindo a erosão/recuperação da duna, galgamento e troca de material entre a porção emersa/submersa) ao caso de estudo da costa de Aveiro e para uma análise de sensibilidades no contexto de múltiplos cenários hipotéticos de alimentações artificiais. Este modelo foi posteriormente explorado via um dos módulos que o integra – a sub-rotina da troca de material entre a berma e a porção submersa – conduzindo a uma versão melhorada do modelo. Atenção foi dada à modelação numérica do comportamento submerso do perfil, a fim de realisticamente descrever os efeitos do transporte dos sedimentos das barras em direção à praia e vice-versa, envolvendo evolução de barras naturais e artificiais (de alimentação). Os desenvolvimentos teóricos foram testados e validados através de dados de campo disponíveis para três casos de estudo nos EUA. No geral, resultados desta aplicação mostraram-se prometedores, demonstrando o potencial de modelos simples e robustos para reproduzir as principais tendências no transporte transversal de sedimentos a longo-prazo. Esta tese constitui um contributo no sentido do aumento do conhecimento sobre as alimentações artificiais de praia, servindo como suporte aos órgãos gestores do litoral na tomada de decisão.
keywords Barra-Vagueira coastal stretch, dredging, disposal activities, beach profile evolution, CS-model, subaqueous response, two-bar system, decision-making
abstract A growing-interest for sustainable environmental engineering solutions able to combat erosion, enhance coastal safety and increase beach width is currently undergoing worldwide. Portugal is one of the countries that follow this pattern. Over the past few decades, a paradigm shift from “fighting” the forces of nature via hard engineering structures to “working with nature” solutions has emerged. Artificial sand nourishments have been in focus and regarded as a preferred method to mitigate erosion and maintain the coastline.
This dissertation starts with a literature review about the past vs present evolution of the Portuguese littoral, giving emphasis to relevant aspects concerning its management (legal status and policy making), as well as to the coastal adaptation strategies that have been under discussion in the context of the future proposals for coastal protection, serving also to highlight the main problems and challenges currently faced by many coastal regions in Portugal. As an attempt to disseminate knowledge regarding the behavior of artificial nourishment operations, this study was further directed to assess a set of monitoring data, originally established to meet the Portuguese legislation and national policy on coastal management for controlling of the environmental impacts associated to the combined use of dredging and disposal activities, in the vicinity of harbors.
Considering the improvement of the numerical modelling capacity, an equally important goal for achieving good predictability of the nourished beaches evolution, in this dissertation special focus was also given to the study of the beach profile change, as the beach fill responses are intrinsically related to the natural beach sediment dynamics. A recent and innovative numerical model with a simplified long-term description of the beach profile evolution, accounting for dune erosion and recovery, overwash/breaching, and the exchange of material between the bar and the berm has been herein applied for the Aveiro coast and targeted for a sensitivity test in the context of hypothetical
nourishment interventions undertaken on an open sandy beach. This model was later explored via one of its integrated modules – the bar-berm material exchange sub-routine – yielding to an improved CS-model. Emphasis was given to the numerical modelling of subaqueous beach profile behavior in order to realistically describe the effects of the sediment release from longshore bars towards the beach and vice-versa, encompassing bar evolution, response of feeder mounds and the coupling between the subaerial and subaqueous changes. The theoretical developments were tested and validated against existing high-quality data from different field sites in USA. Overall, outputs of the application of the model to these three US case studies, look promising, demonstrating the potential for using rather simple models to quantitatively reproduce the main trends in the cross-shore sediment exchange taking place for longer timescales. This thesis constitutes a step forward the increase of knowledge in the topic of artificial nourishments, serving to support coastal engineers and managers at the decision-making.
Artificial nourishments as a coastal defense solution: monitoring and modelling approaches
xvii
RISCO – Aveiro Research Center of RIsks and Sustainability in Construction
Appended papers
The development of this doctoral dissertation has resulted in four manuscripts that have been submitted/published in four distinct scientific international journals. The papers are appended at the end of this document.
Paper I. Palalane, J., Fredriksson, C., Marinho, B., Larson, M., Hanson, H., Coelho, C. (2016); Simulating Cross-shore Material Exchange at Decadal Scale. Model Application; Coastal Engineering, Elsevier, 116, 29-41 pp.
http://dx.doi.org/10.1016/j.coastaleng.2016.05.007
Author’s contribution: The author has implemented the model for one of the study sites (Aveiro, Portugal) and was the main contributor to the writing of the corresponding section, providing also comments and participating in the review of the whole article.
Paper II. Marinho, B., Coelho, C., Larson, M., Hanson, H. (2017); Short- and Long-Term Responses of Nourishments: Barra-Vagueira Coastal Stretch, Portugal. Journal of Coastal Conservation, Springer, 22(3), 475-489 pp. http://dx.doi.org/10.1007/s11852-017-0533-5
Author’s contribution: The author was the main contributor to the writing of all manuscript sections and to the discussion regarding the main findings of the paper.
Paper III. Marinho, B., Coelho, C., Larson, M., Hanson, H. (2018); Monitoring the Evolution of Nourished Beaches Along Barra-Vagueira Coastal Stretch, Portugal. Ocean & Coastal Management Journal, Elsevier, 157, 24-29 pp. https://doi.org/10.1016/j.ocecoaman.2018.02.008
Author’s contribution: The author developed a data processing analysis, contributing to the writing of all sections of the manuscript as well as to the discussion of the main findings and final revision of the paper.
Artificial nourishments as a coastal defense solution: monitoring and modelling approaches
xviii
RISCO – Aveiro Research Center of RIsks and Sustainability in Construction Paper IV. Marinho, B., Coelho, C., Larson, M., Hanson, H. (2017); Cross-shore
modelling of nearshore bars at a decadal scale. Marine Geology, Elsevier (under review).
Author’s contribution: The author participated in the model development ant its implementation at all the study sites, in the discussion, writing, and final review of the whole article.
Artificial nourishments as a coastal defense solution: monitoring and modelling approaches
xix
RISCO – Aveiro Research Center of RIsks and Sustainability in Construction
Other related publications
Conference ProceedingsIn parallel to the development of the previous manuscripts, distinct parts of the present dissertation have been disseminated by the coastal community in international scientific meetings around the world. The main scientific contributions to these international research meetings are described below:
Marinho, B., Larson, M., Coelho, C., Hanson, H. (2018); Long-term Coastal Evolution Modelling of Longshore Bars; ICCE’18 - Proceedings of 36th International Conference on
Coastal Engineering, Baltimore, USA, 30th July to 3rd August (abstract).
Marinho, B., Larson, M., Coelho, C., Hanson, H. (2018); Overview of the Coastal Zones and Its Management in Portugal; EGU’18 – European Geosciences Union, Vienna, Austria, 8th to 13th April (abstract).
Marinho, B., Larson, M., Coelho, C., Hanson, H. (2017); Modelling Multi-Bar System at Decadal Scale; RCEM 2017 – 10th Symposium on River, Coastal and Estuarine
Morphodynamics, Trento, Italy, 15th to 22nd September (abstract and poster).
Marinho, B., Coelho, C., Larson, M., Hanson, H. (2017); Simulating Cross-Shore Evolution Towards Equilibrium of Different Beach Nourishment Schemes; Proceedings of the Coastal Dynamics 2017, Working with Nature, Helsingør, Denmark, Paper 121, 1732-1746.
Marinho, B., Coelho, C., Larson, M., Hans, H. (2016); Short- and Long-Term Responses of Nourishments: Barra-Vagueira Coastal Stretch, Portugal, Littoral 2016 – The Changing Littoral. Anticipation and Adaptation to Climate Change, 25th to 29th October, Biarritz,
France, p. 139 (abstract and poster).
Marinho, B., Coelho, C., Larson M., Hanson, H. (2015); Monitorização da Evolução Morfológica, Sedimentar e Batimétrica do Trecho Costeiro Barra-Vagueira: Correlação com a Agitação e Intervenções Costeiras, VIII Congresso sobre Planeamento e Gestão das Zonas Costeiras dos Países de Expressão Portuguesa, 14th to 16th October, Aveiro,
Artificial nourishments as a coastal defense solution: monitoring and modelling approaches
xx
RISCO – Aveiro Research Center of RIsks and Sustainability in Construction
Marinho, B., Coelho, C., Larson, M., Hanson, H. (2015); Aplicação da Análise EOF ao Trecho Costeiro Barra-Vagueira; VIII Symposium on the Iberian Atlantic Margin, Málaga, Spain, 21st to 23rd September, 2015 (extended abstract, in portuguese).
Chapters in National Books
Marinho, B., Coelho, C., Larson, M., Hanson, H. (2018). Modelação Numérica da Aplicação de Dragados no Reforço do Perfil Transversal de Praia, Chapter III.3, 131-151 pp. ISBN 978-972-789-535-9.
Artificial nourishments as a coastal defense solution: monitoring and modelling approaches
xxi
RISCO – Aveiro Research Center of RIsks and Sustainability in Construction
List of Contents
Appended papers ... xvii
Other related publications ... xix
List of Contents ... xxi
List of Figures ... xxv
List of Tables ... xxxi
List of Abbreviations ... xxxiii
List of Symbols ... xxxvii
1. INTRODUCTION ... 3
1.1. Background and problem statement ... 3
1.2. Objectives ... 7
1.3. Methods ... 8
1.4. Structure of the dissertation ... 9
2. OVERVIEW OF THE COASTAL ZONES AND ITS MANAGEMENT IN PORTUGAL 13 2.1. Coastal evolution: past vs present ...16
2.2. Geomorphology and sediment transport ...18
2.3. Coastal protection interventions ...21
2.4. Vulnerability and risk of the Portuguese coastal areas ...25
2.5. Coastal management and planning ...28
2.5.1. Administration, legislation and regulation ...28
2.5.2. Policy tools for coastal zone management ...29
2.5.3. Management plans for the Portuguese coastal zones ...30
2.5.4. Coastal protection and decision-making process ...31
2.6. Monitoring at an institutional and public level ...32
Artificial nourishments as a coastal defense solution: monitoring and modelling approaches
xxii
RISCO – Aveiro Research Center of RIsks and Sustainability in Construction 2.6.2. Portuguese information systems infrastructures ...34 2.6.3. Portuguese monitoring priorities ...36 2.6.4. Monitoring program of the Portuguese coastal zones (COSMO) ...37 2.7. Data collection approaches ...39 2.7.1. Laboratory approach ...40 2.7.2. Field approach ...41 2.8. Coastal adaptation strategies ...42 2.9. Summary ...45 3. ARTIFICIAL SAND NOURISHMENTS ... 49 3.1. Objectives ...50 3.2. Behavior/performance ...53 3.3. Costs, benefits and impacts ...54 3.4. Fill placement techniques and re-nourishment requirements ...57 3.5. Borrow sources and transportation for deposition ...60 3.6. Examples of past nourishment interventions in Portugal ...62 3.7. International cases studies ...67 3.7.1. Sand Engine, Netherlands ...67 3.7.2. Nerang Sands Bypass System, Australia ...69 3.8. Summary ...72 4. MONITORING CASE STUDY ... 77
4.1. Field site: Barra-Vagueira coastal stretch, Aveiro, PT ...79 4.1.1. Dredging/dumping operations and related harbor activities...81 4.1.2. Wave climate ...84 4.1.3. Monitoring program...86 4.2. Methodology ...87
4.2.1. Cross-shore profile analysis ...87 4.2.2. Bathymetric analysis ...89 4.2.3. EOF analysis ...91
Artificial nourishments as a coastal defense solution: monitoring and modelling approaches
xxiii
RISCO – Aveiro Research Center of RIsks and Sustainability in Construction 4.3. Monitoring results ...92
4.3.1. Cross-shore profile variability ...93 4.3.2. Evolution of dumping areas ...99 4.3.3. EOF Analysis ... 107 4.4. Discussion ... 109 4.5. Summary ... 112 5. BEACH PROFILE CHANGE MODEL ... 119 5.1. Numerical modelling limitations and capabilities ... 122 5.2. CS-model: model description ... 124 5.2.1. Dune erosion and overwash ... 125 5.2.2. Wind build-up... 126 5.2.3. Berm-bar material exchange: theory for one-bar system ... 128 5.3. Model application: Barra-Vagueira coastal stretch ... 130 5.3.1. Data ... 131 5.3.2. Model set-up and calibration ... 134 5.3.3. Results ... 135 5.4. Sensitivity analysis to model performance ... 137 5.4.1. Methodology ... 138 5.4.2. Model set-up ... 139 5.4.3. Results of simulated scenarios ... 140 5.5. CS-model: additional settings ... 145 5.5.1. Theory for two-bar system ... 145 5.5.2. Hypothetical bar equation for nearshore placements ... 150 5.6. Summary ... 153 6. MODEL VALIDATION AND APPLICATION ... 159
6.1. Duck, North Carolina, USA ... 160 6.1.1. Background and data employed ... 160 6.1.2. Model set-up and calibration ... 165
Artificial nourishments as a coastal defense solution: monitoring and modelling approaches
xxiv
RISCO – Aveiro Research Center of RIsks and Sustainability in Construction 6.1.3. Results and discussion ... 166 6.2. Silver Strand, California, USA ... 168 6.2.1. Background and data employed ... 168 6.2.2. Model set-up and calibration ... 171 6.2.3. Results and discussion ... 172 6.3. Cocoa Beach, Florida, USA ... 174 6.3.1. Background and data employed ... 174 6.3.2. Model set-up and calibration ... 177 6.3.3. Results and discussion ... 178 6.4. Summary ... 179 7. FINAL REMARKS ... 183 7.1. Conclusions ... 183 7.2. Future developments ... 191 REFERENCES ... 197
Artificial nourishments as a coastal defense solution: monitoring and modelling approaches
xxv
RISCO – Aveiro Research Center of RIsks and Sustainability in Construction
List of Figures
Chapter 1
Figure 1.1. Triangle describing the coastal development process. ... 5 Figure 1.2. Structure of the dissertation. ... 9
Chapter 2
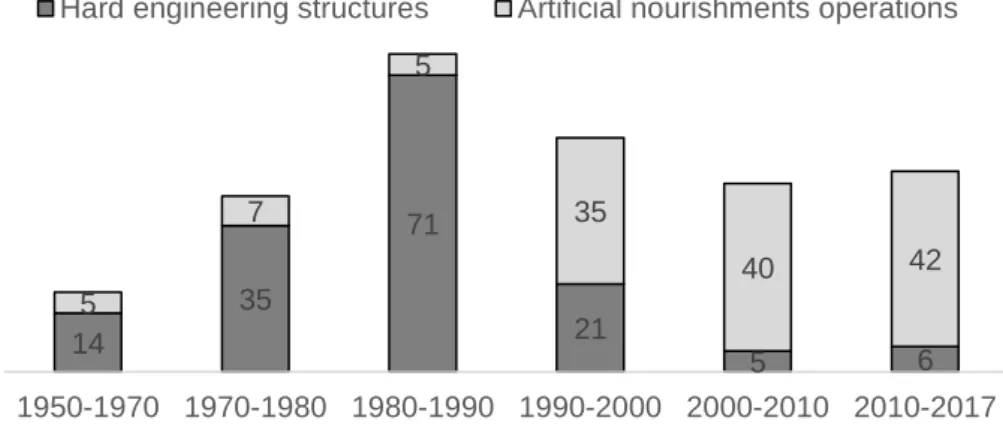
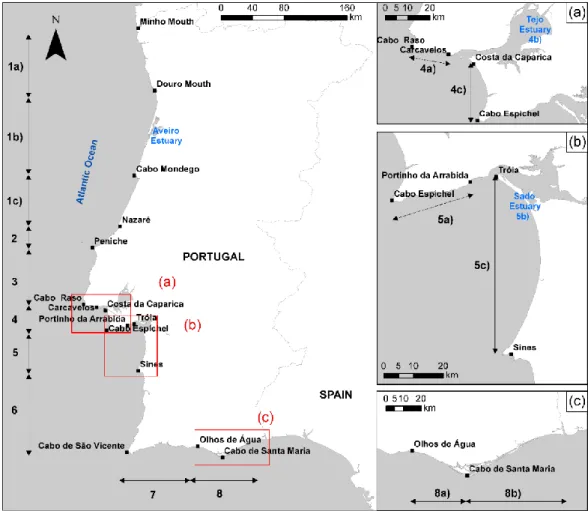
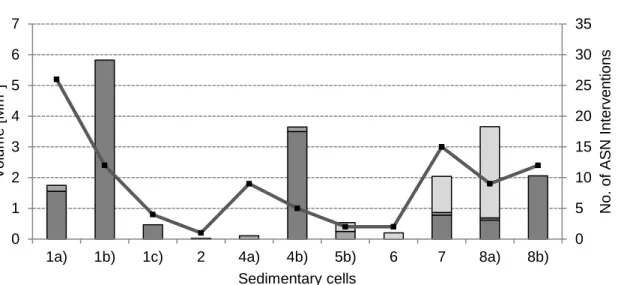
Figure 2.1. Shoreline evolution scheme. ...14 Figure 2.2. Number of coastal interventions in Portugal, since 1950 until 2017 (information based on Abecasis, 2014 and Pinto et al., 2018). ...15 Figure 2.3. Geomorphology of the Portuguese littoral and corresponding partition in 8 distinct sedimentary cells (based on Santos et al., 2017). ...18 Figure 2.4. ASN interventions and volumes performed during the past two decades (1998-2017). ...24
Chapter 3
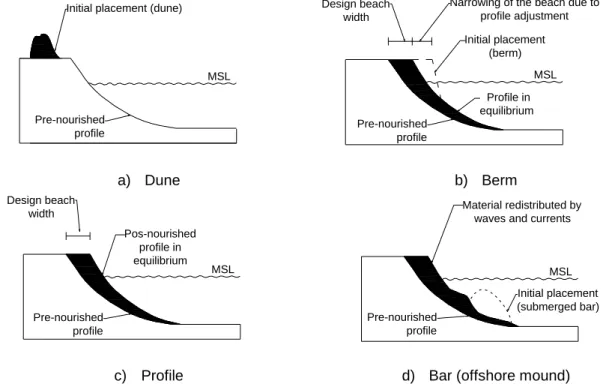
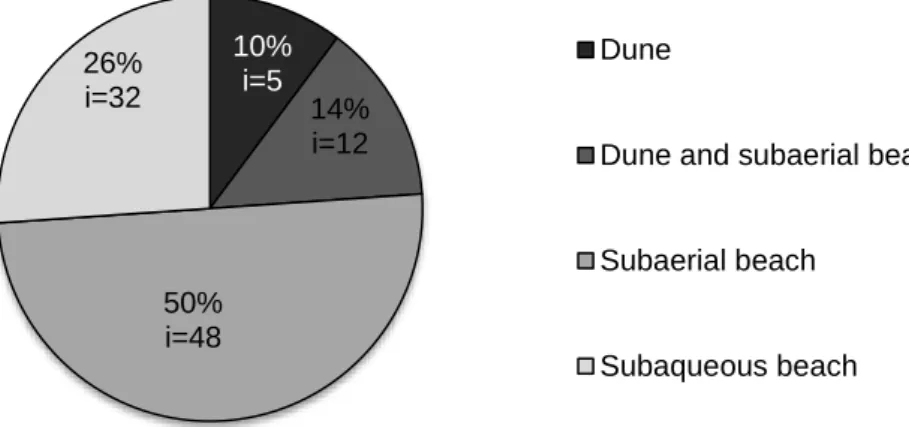
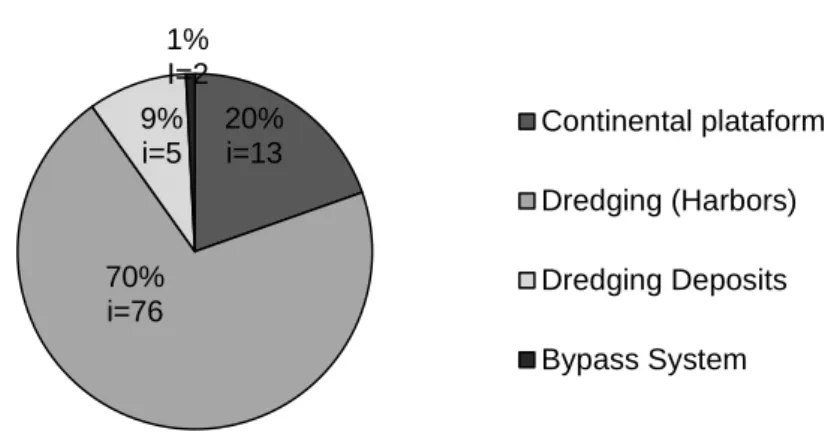
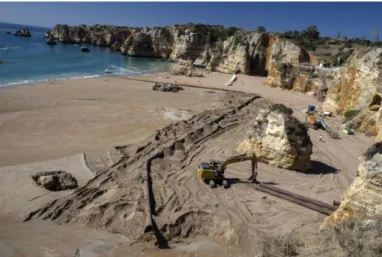
Figure 3.1. Artificial sand nourishments projects. ...50 Figure 3.2. Distribution of the number of artificial nourishment interventions according to the specific design objective (time series 1998-2017), based on Pinto et al. (2018). ...52 Figure 3.3. Designs of artificial sand nourishment schemes (adapted from Gravens et al., 2003 and Marinho et al., 2018b). ...58 Figure 3.4. Distribution of the nourishment volumes and intervention number, i, according to the disposal technique (time series 1998-2017). ...59 Figure 3.5. Distribution of the nourishment volumes in Portugal and intervention number, i, according to the type of borrow source (time series 1998-2017). ...61 Figure 3.6. Nourishment intervention in D. Ana beach (Algarve). ...63 Figure 3.7. Ria Formosa (Algarve). ...63 Figure 3.8. Nourishment operations in Costa da Caparica beach, in 2008. ...64 Figure 3.9. Beach nourishment in Tróia. ...65 Figure 3.10. Dredging operations of the Aveiro inlet...66 Figure 3.11. Entities responsible for carrying out the nourishment projects in Portugal, between 1998 and 2017 (Pinto et al., 2018). ...67 Figure 3.12. Sand Engine pilot project (mega-nourishment approach). ...69 Figure 3.13. The Nerang Sand Bypassing System. ...71
Artificial nourishments as a coastal defense solution: monitoring and modelling approaches
xxvi
RISCO – Aveiro Research Center of RIsks and Sustainability in Construction Chapter 4
Figure 4.1. Location of the study site: (a) Portugal; (b) Aveiro district; (c) Barra-Vagueira coastal stretch; (d) Aveiro harbor navigation channel (zoom in the Aveiro inlet). ...80 Figure 4.2. Location plan of the dredging and deposition areas and surveyed cross-sections (P1 to P12). ...83 Figure 4.3. Wave rose with energy based on significant wave height, Hs, measured at
Leixões (2009-2015). ...85 Figure 4.4. Monthly significant wave height and respective wave direction dominant sector. Bars represent the percentage of wave occurrence...86 Figure 4.5. Timeline of the surveys performed at the study site (monitoring campaigns) and filling volumes at dumping areas. ...87 Figure 4.6. Surveyed cross-shore profiles for representative transects of the updrift region (P2), dredged and nourished areas (P3 and P7, respectively) and southern region (P9). 88 Figure 4.7. Common areas of the bathymetry surveys, for dumping areas DA1 (CA1) and DA2 (CA2A and CA2B). ...90 Figure 4.8. Scheme of morphological changes to the beach profile during a seasonal cycle. Definition sketch of bar properties: bar crest, bar volume (VB) and bar crest distance
to the shoreline (XBar,crest)...93
Figure 4.9. Shoreline position (MSL) variation over time relative to Sep-09 shoreline, obtained at surveyed profile lines P1 to P12. ...95 Figure 4.10. Sandbar characteristics (volume and position), along profiles P1 to P12 and over time. ...96 Figure 4.11. Cumulative volumetric changes. Volumes relative to Sep-09 for profiles P1 to P12. ...98 Figure 4.12. Sediment balance for the dumping areas between Sep-09 and Apr-15. The bars correspond to the fill volumes and the symbols (triangles, circles and squares) to survey events... 100 Figure 4.13. Short-term bathymetric evolution at DA1 (bed elevation change between surveys). ... 100 Figure 4.14. Medium-term bathymetric evolution at DA1 (bed elevation change between surveys). ... 101 Figure 4.15. Short-term bathymetric evolution at DA2 (bed elevation change between surveys). Arrows represent cross-shore material exchange and longshore sediment transport predominant direction. ... 102
Artificial nourishments as a coastal defense solution: monitoring and modelling approaches
xxvii
RISCO – Aveiro Research Center of RIsks and Sustainability in Construction Figure 4.16. Medium/long-term evolution at DA2 (bed elevation change between surveys). Arrows represent CS material exchange and LS sediment transport predominant direction. ... 103 Figure 4.17. First three spatial EOFs for each profile around DA2 (data from Oct-09 to Feb-15). Red squares point out the cross-shore location of the fills. ... 108
Chapter 5
Figure 5.1. Temporal scales of beach morphology change (Marinho et al., 2018b). ... 120 Figure 5.2. Scheme of the profile given by the model. The angles βL and βS correspond to
the landward and seaward dune face slope, respectively, and βF to the foreshore slope
(constant parameters). DB and DC represents the berm height (related to MSL) and the
depth of closure, respectively. ... 125 Figure 5.3. Scheme of dune erosion and overwash processes. qL represents the overwash
transport rate and qS and qD the seaward transport resulting from erosion of the dune
(backwash transport) in cases of overwash and no overwash, respectively. ... 126 Figure 5.4. Scheme of dune recovery by wind processes. VD represents the dune volume
variation and qWL and qWS to the wind-blown transport on the landward and seaward side
of the dune, respectively. ... 127 Figure 5.5. Scheme for one-bar theory. The variables qB and βF denote the subaqueous
transport rate between the bar and berm and foreshore slope, respectively. ... 128 Figure 5.6. Wave rose with energy based significant wave height, Hs, at Leixões
(2009-2013). ... 131 Figure 5.7. Topo-bathymetric surveys of profile, between 2009 and 2013 (elevation relative to mean sea level). ... 133 Figure 5.8. Comparison between simulated and observed values for seaward dune foot and berm positions and dune and bar volumes. ... 136 Figure 5.9. Different types of nourishment schemes investigated (varying the placement location). ... 138 Figure 5.10. Simulation results varying the placement of the nourishment. The continuous and dashed lines represent the modeled berm and seaward dune foot positions in a) and the dune and bar volume in b), respectively. ... 141 Figure 5.11. Simulation results varying the fill placement schedule. The continuous and dashed lines represent the modeled berm and seaward dune foot positions in a) and the dune and bar volume in b), respectively. ... 143
Artificial nourishments as a coastal defense solution: monitoring and modelling approaches
xxviii
RISCO – Aveiro Research Center of RIsks and Sustainability in Construction Figure 5.12. Simulation results varying the sectional fill volume. The continuous and dashed lines represent the modeled berm and seaward dune foot positions in a) and the bar and dune volume in b), respectively. ... 144 Figure 5.13. Scheme for the evolution processes for a two-bar system... 148
Chapter 6
Figure 6.1.Volumes for inner and outer bar and monthly average of the measured wave height. Yellow shaded areas correspond to periods when the inner bar has migrated seaward to become the outer bar. Green shaded areas represent the periods when the outer bar has become flat, but reappearing after that at the same location. Numbers 1 and 2 highlight the periods of profile surveying that are further down displayed in Figure 6.3 and Figure 6.4, respectively. ... 161 Figure 6.2. Depth of the bar crest for inner and outer bar. Yellow shaded areas correspond to periods when the inner bar has migrated seaward to become the outer bar. Green shaded areas represent the periods where the outer bar has become flat, but reappearing after that at the same location. ... 162 Figure 6.3. Surveyed profiles for Line 62 during the offshore progression of the inner bar to become the outer bar (28-Sep-81 to 07-Oct-82). ... 163 Figure 6.4. Surveyed profiles for Line 62 during the outer bar formation offshore (5-Jan to 23-Apr, 1985). ... 164 Figure 6.5. Total, inner, and outer bar volumes and wave climate (Duck, N.C.). Numerical simulations without considering sediments exchange between the inner and the outer bar. ... 167 Figure 6.6. Total, inner, and outer bar volumes and wave climate (Duck, N.C.). Numerical simulations considering sediment exchange between the inner and the outer bar. ... 168 Figure 6.7. Surveyed profiles at Line 5 (during first year after berm construction). ... 169 Figure 6.8. Evolution of the offshore mound properties with time. Minimum depth refers to MLLW (= MSL - 0.85 m). ... 170 Figure 6.9. Nourishment evolution simulation by adding extra volume to the existing bar (Silver Strand, Coronado). ... 172 Figure 6.10. Nourishment simulation using a hypothetic inner bar (Silver Strand, Coronado), where IP and EB are acronyms for Inshore Portion and Existing Bar (nourished with dredged material), respectively. Red line represents a threshold for the wave height that controls when sand is transported landward, from the inner portion of the profile to the berm (H1). ... 173
Artificial nourishments as a coastal defense solution: monitoring and modelling approaches
xxix
RISCO – Aveiro Research Center of RIsks and Sustainability in Construction Figure 6.11. Selected survey profiles intercepting the permitted disposal area (0 m to 2 895 m in the local alongshore coordinate system): (a) northern part and (b) southern part. ... 175 Figure 6.12. Average profile evolution at northern disposal area (0 m to 800 m). Distance along the profiles refers to an artificial baseline set at approximately the NGVD shoreline. ... 176 Figure 6.13. Results of the nourishment simulation using a hypothetic outer bar (Cocoa Beach) considering exchange of material with the inner portion of the profile. ... 178
Chapter 7
Artificial nourishments as a coastal defense solution: monitoring and modelling approaches
xxxi
RISCO – Aveiro Research Center of RIsks and Sustainability in Construction
List of Tables
Chapter 2
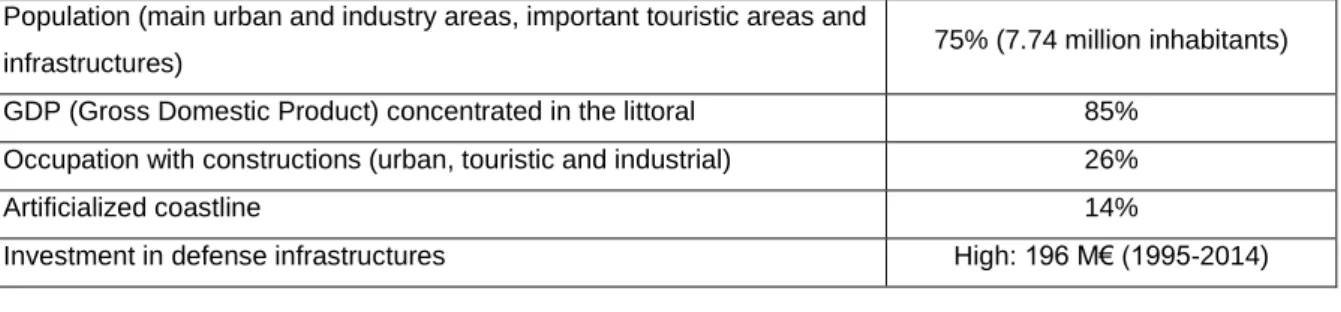
Table 2.1. Overview of the socio-economic indicators of the coastal zones (APA, 2016). 13 Table 2.2. Overview of the Portuguese littoral sectioned by 8 cells (GTL, 2014). ...19 Table 2.3. Planning tools (Taveira-Pinto, 2004; EUrosion, 2006). ...30 Table 2.4. POC's, the new management tools (APA, 2018). ...31 Table 2.5. Fill volumes affected to each coastal stretch (GTS, 2015). ...44
Chapter 4
Table 4.1. Details of the dredging/dumping operations performed during 2009-2015 (AHA, 2012; 2013). ...82 Table 4.2. Bathymetric comparisons undertaken for each surveyed dumping area. ...91
Chapter 5
Table 5.1. Morphological parameters, initial values of variables. ... 134 Table 5.2. Initial values of variables to characterize the main morphological features of the beach profile for hypothetical nourishment scenarios. ... 140
Artificial nourishments as a coastal defense solution: monitoring and modelling approaches
xxxiii
RISCO – Aveiro Research Center of RIsks and Sustainability in Construction
List of Abbreviations
AHA Aveiro Harbor Administration
APA Portuguese Environment Agency (Agência Portuguesa do Ambiente) ARH Administrative Hydrographic Regions
ASN Artificial Sand Nourishment
CA Common Area
CA1 Common area to all surveys collected for DA1
CA2A Common area to all surveys collected for DA2, with exception of the survey of Jan-14
CA2B Common area to all surveys collected for DA2, with exception of Dec-10, Nov-11, Nov-13 and Jan-14
CCDR Commissions of Coordination and Regional Development (Comissão de Coordenação e Desenvolvimento Regional)
CD Chart Datum
COSMO Monitoring Program of the Portuguese Coastal Zones (Programa de Monitorização da Faixa Costeira de Portugal Continental)
CS Current Situation
CS Cross-Shore
DA1 Dumping Area 1 DA2 Dumping Area 2
DGAM General Direction of the Maritime Authority (Direção Geral da Autoridade Marítima)
DGPM General Direction of the Sea Policy (Direção Geral de Política do Mar) DGRM General Direction of the Natural Resources, Security and Maritime Services
(Direção Gerald de Recursos Naturais, Segurança e Serviços Marítimos) DGT General Directorate of the Territory (Direção Geral do Território)
DIA Environment Impact Statements (Declaração de Impacto Ambiental)
ENGIZC National Strategy for Integrated Coastal Zone Management (Estratégia Nacional de Gestão Integrada das Zonas Costeiras)
EOF Empirical Orthogonal Functions FRF Field Research Facility
GeoE Geographic Institute of the Army (Instituto Geográfico do Exército) GIS Geographic Information System
Artificial nourishments as a coastal defense solution: monitoring and modelling approaches
xxxiv
RISCO – Aveiro Research Center of RIsks and Sustainability in Construction GPD Gross Domestic Product
GPS Global Positioning System
GTL Littoral Working Group (Grupo de Trabalho do Litoral) formed in 2014 under the Legislative order nr. 6574/2014 of the Ministry of the Environment in 20th
May
GTS Sediment Working Group (Grupo de Trabalho para os Sedimentos) constituted in 2015 under the Legislative order nr. 3839/2015 of the State Secretary of the Environment in 17th April
HA’s Harbor Administrations
ICNF Institute of the Conservation of the Nature and Forests (Instituto da Conservação da Natureza e das Florestas)
ICZM Integrated Coastal Zone Management IDW Inverse Distance Weighting
IH Hydrographic Institute (Instituto Hidrográfico)
INE National Institute of Statistics (Instituto Nacional de Estatística) INSPIRE INfrastructure for SPatial InfoRmation in Europe
IPMA Portuguese Institute of the Sea and Atmosphere (Instituto Português do Mar e Atmosfera)
IS Information Systems
LG Longshore
LIDAR Light Detection And Ranging LMG Last Maximum Glacial
LNEC National Laboratory of Civil Engineering (Laboratório Nacional de Engenharia Civil)
LNEG National Laboratory of Energy and Geology (Laboratório Nacional de Energia e Geologia)
LWT Large Wave Tank MLLW Mean Lower Low Water
MSFD Marine Strategy Framework Directive MSL Mean Sea Level
NAOAA National Oceanic Atmospheric Administration NGVD National Geodetic Vertical Datum
P1-P12 Surveyed beach profiles covering the S. Jacinto-Vagueira coastal stretch PIANC Permanent International Association of Navigation Congresses
Artificial nourishments as a coastal defense solution: monitoring and modelling approaches
xxxv
RISCO – Aveiro Research Center of RIsks and Sustainability in Construction
POC Coastal Zone Management Program (Programa da Orla Costeira) – new portuguese management tool
POOC Coastal Zone Management Plans (Planos de Ordenamento da Orla Costeira) – old portuguese management tool
PS Past Situation
PT Portugal
RTK Real-Time Kinematic
SDSI Special Data Storage Infrastructure
SGPS Management Society of Social Participations (Sociedade Gestora de Participações Sociais)
SIARL Administration System of the Littoral Resources (Sistema de Administração do Recurso Litoral)
SLR Sea Level Rise
SNIG National Geographic Information System (Sistema Nacional de Informação Geográfica)
SWL Sea Water Level
USACE US Army Corps of Engineers WIS Wave Information Studies WwN Working With Nature
Artificial nourishments as a coastal defense solution: monitoring and modelling approaches
xxxvii
RISCO – Aveiro Research Center of RIsks and Sustainability in Construction
List of Symbols
A principal component scores from EOF analysis -
A empirical coefficient in the overwash model -
CB empirical coefficient in the longshore bar model -
Cc adjustment coefficient to bar response for offshore transport - Cc I adjustment coefficient to inner bar response for onshore
transport -
CcO adjustment coefficient to outer bar response for onshore
transport -
Ccoff adjustment coefficient to bar response for offshore transport - Ccon adjustment coefficient to bar response for onshore transport -
Cf coefficient for frictional losses over the berm -
CS impact formula empirical transport rate coefficient -
D data matrix from EOF analysis -
DB vertical distance from mean water level to the dune foot m
DC depth of closure m
d50 median sediment grain size mm
E principal components from EOF analysis -
Ho deep water wave height m
H1 wave height limit for the groups of waves that will break at outer
bar depths m
H2 wave height limit for the groups of waves that will break at inner
bar depths m
H’ modified wave height for runup calculations m
Hb breaking wave height m
Hc critical wave height m
Hs significant wave height m
Ht extreme tidal projection (before ht) m
hc depth-to-bar crest m
ht extreme tidal projection (after Ht) m
Artificial nourishments as a coastal defense solution: monitoring and modelling approaches
xxxviii
RISCO – Aveiro Research Center of RIsks and Sustainability in Construction
L0 deep-water wavelength m
m coefficient in the longshore bar model -
N number of observations -
qB subaqueous transport rate between the bar and the berm m3/s/m
qD
sediment transport rate eroded from the dune (divided into qL
and qS)
m3/s/m
qL overwash transport m3/s/m
qS
seaward transport resulting from erosion of the dune (backwash
transport) m
3/s/m
qWE equilibrium sand transport rate by wind m3/s/m
qWL wind-blown transport on the landward side of the dune m3/s/m
qWS wind-blown transport on the seaward side of the dune m3/s/m
R wave runup height m
s dune height m
smáx maximum dune height m
T wave period s
Tp peak wave period s
THs wave period corresponding to Hs s
Tt time period between Ht and ht s
t time interval between the previous extreme time and the
interpolation moment s
VB bar volume m3/m
VBI inner bar volume m3/m
VBO outer bar volume m3/m
VBE equilibrium bar volume (=VBETOT) m3/m
VBEI equilibrium inner bar volume m3/m
VBEO equilibrium outer bar volume m3/m
VD dune volume m3/m
w sediments fall speed m/s
XBar,crest bar crest distance to the shoreline m
yB location of berm crest (represents the shoreline position) m
yL location of landward end of the dune/barrier m
Artificial nourishments as a coastal defense solution: monitoring and modelling approaches
xxxix
RISCO – Aveiro Research Center of RIsks and Sustainability in Construction zD vertical distance from the dune foot level and the water level at
each time step m
zt sea water level at the moment after a high or low tide m
α ratio between the eroded dune volume going onshore
(shoreward side) and offshore (berm) -
ßF foreshore slope rad
ßL landward slope of the dune/barrier rad
ßS seaward slope of the dune/barrier rad
coefficient expressing the spatial growth of wind transport rate -
∆VD dune volume mobilized by the waves m3/m
∆VL volume of sediments mobilized by the waves over the dune
crest to the shoreward side of the dune m
3/m
∆VS volume of sediments mobilized seaward by the waves from the
dune to the berm m
3/m
∆t time step of the simulation s
ratio between the outer and inner bar volume at the equilibrium -
δ0 empirical coefficient in the two-bar model -
ε normalized least-square error -
θ offshore wave incident angle º
λ coefficient quantifying the rate at which the bar equilibrium
volume is approached s
−1
λ0 bar response coefficient in the one-bar model s−1
λ0I inner bar response coefficient in the two-bar model s−1
λ0O outer bar response coefficient in the two-bar model s−1
C
HAPTER
1
Chapter structure
1.1.
Background and problem statement
1.2.
Objectives
1.3.
Methods
Artificial nourishments as a coastal defense solution: monitoring and modelling approaches
3
RISCO – Aveiro Research Center of RIsks and Sustainability in Construction
1. INTRODUCTION
1.1. Background and problem statement
Erosion has become one of the biggest threats affecting the coastal zones worldwide, as 70% of the shorelines are retreating (Bird, 1985). Episodes of erosion-overtopping-breaching-inundation, causing destruction or threatening engineering walls, fields, roads, and even seaside villages, have been reported in several countries all over the world, e.g. Netherlands, Sweden, Denmark, U.K., Japan, Spain, Italy, Australia, China, USA and Portugal (Dean, 2002; Ojeda et al., 2008; Castelle et al., 2009; Yates et al., 2009; Kuang et al., 2011; Roberts and Wang, 2012; Pranzini and Williams, 2013; Anthony et al., 2014; Brown and Nicholls, 2015; Burcharth et al., 2015; Luo et al., 2015; Oliveira, 2015; De Leo et al., 2016; Luo et al., 2016; Schipper et al., 2016; Zhao et al., 2017). Many causes related to the coastal erosion phenomenon have been under discussion not only by the scientific community but also by coastal engineers and managers, representing government agencies, in order to solve problems and establish sustainable coastal adaptation strategies. Generalized sediment deficit, sea level rise and other associated climate change effects, storm surge and shoreline profiling imbalances caused by human-driven activities have been regarded as the main protagonists behind the observed changes along the coast (Nicholls and Hoozemans, 1996; Genua-Olmedo et al., 2016). All of these drivers allied to a generalized increasing population density towards the coastal zones as well as growing pressures from multiple industries have been resulting in a high level of risk for human beings, infrastructures and economical activities. This worldwide situation has instigated a general demand for working with nature solutions, i.e., sustainable coastal maintenance approaches able not only to cope with economic growth in urban areas, but also to preserve/maintain the ecosystem in which it operates, safeguarding this way future generations (Pranzini and Williams, 2013; Bergillos et al., 2018). Along the past few decades, less damaging techniques such as artificial beach nourishments have been in focus due to their potential benefits for mitigating erosion, ensuring flood safety and increased beach width, as well as providing opportunities for recreation and nature-based activities. Although sand nourishments are conventionally faced as a high-potential soft protection measure against erosion, there is still little solid knowledge concerning its efficiency and performance along the project life, for different physical environmental contexts. When in the absence of engineering
Artificial nourishments as a coastal defense solution: monitoring and modelling approaches
4
RISCO – Aveiro Research Center of RIsks and Sustainability in Construction
structures, the control over the nourished sand is minimal, and questions about the ultimate fate of the dump material still remain. This justifies the need to document and categorize effects of different natural actions and interventions carried out along the coast, enabling a learning-by-doing approach. The empirical knowledge is crucial for preliminary design of cross-shore and planform shape of the fills and their volumes to meet project design lifetime and minimize costs. Also, collecting field observations can shed light on the natural conditions that prompt the need for adapting the project design solution or developing potential alternatives (Capobianco et al., 2002; Castelle et al., 2009; Vacchi et al., 2012, Marinho et al., 2017a).
The establishment of monitoring programs in sandy shores is conventionally assumed as a starting point to understand present-day coastline evolution (Baptista et al., 2014). Although follow-up programs are essential and should be faced as a first order of priority, often they are not well established, producing limited information related to the processes behind the beach dynamics. The importance of such information relays also on the development, calibration and validation of numerical models, which are important tools for predicting the beach evolution in the neighborhood of planned or existing engineering projects. Although laboratory tests can also offer an option to anticipate the resulting effect of different coastal protection interventions, sometimes they are not feasible. This is because usually large amount of funding are required and, as in the case of beach nourishments, they may also not be effective as the process of beach change is primarily caused by irregularities in the wave regime, which are difficult to accurately model in a laboratory scale.
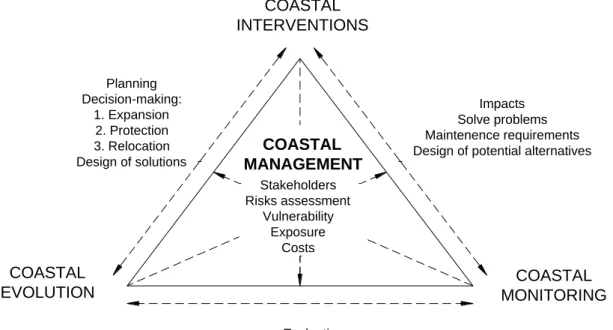
Figure 1.1 shows an idealized model for an integrated coastal zone management (ICZM) policy in the format of a relational and equilateral triangle. Basically, the core of the problem relays on how to analyze and put into practice the three strategic pillars, in which the coastal management structure should be based on – 1) Coastal Evolution; 2) Coastal Interventions; and 3) Coastal Monitoring. ICZM is a very dynamic and iterative process that requires a good articulation of these three main variables. It should then embrace the full cycle of data collection, planning (in its broad sense), decision-making and monitoring, by following a participatory approach that encourages the cooperation of all the involved actors and stakeholders to assess the societal goals established for a certain coastal zone and to take actions to meet such goals.
By undertanding the physical processes behind the natural evolution of the coastal zones, the risks, the vulnerabilities, the exposure level, the costs and impacts of the
Artificial nourishments as a coastal defense solution: monitoring and modelling approaches
5
RISCO – Aveiro Research Center of RIsks and Sustainability in Construction human-driven activities over the long-term, managers may be able to develop an integrated approach, safeguarding all aspects of the coastal zones, including geographical and political boundaries, in an attempt to achieve sustainability. The typical diagnosis, unique and objective, should no longer exist, arising in place a coastal adapation strategie built upon multi-criteria and cost-benefit analysis as a way to concilate multiple interests, within the limits set by the natural dynamics (Figure 1.1).
Figure 1.1. Triangle describing the coastal development process.
Aiming the dissemination of knowledge regarding the adaptation of coastal systems in the presence of artificial nourishment operations, this study started by assessing a set of monitoring data, originally established to meet the Portuguese legislation and national policy on coastal management (Paper II, Paper III), for controlling of the environmental impacts associated to the combined use of dredging and disposal activities in the vicinity of harbors. Taking as study case an intermediate to energetic hydrodynamic environment with a scarce natural sediment input, located on the northwest coast of Portugal, a set of correlated analysis are brought together as an attempt to assess the short- and long-term responses of several nearshore nourishments as well as the related-impacts to nearby sediment-starved beaches. COASTAL MONITORING COASTAL INTERVENTIONS COASTAL MANAGEMENT COASTAL EVOLUTION Impacts Solve problems Maintenence requirements Design of potential alternatives
Evaluation Identification of problems Predictability capacity Stakeholders Risks assessment Vulnerability Exposure Costs Planning Decision-making: 1. Expansion 2. Protection 3. Relocation Design of solutions
Artificial nourishments as a coastal defense solution: monitoring and modelling approaches
6
RISCO – Aveiro Research Center of RIsks and Sustainability in Construction Prior to data analysis, relevant aspects concerning the general evolution of the Portuguese littoral (past and recent coastal interventions, morphological change, etc.) and its management as well as the coastal adaptation strategies under discussion for the future coastal protection are summarized as a way to highlight the main problems and challenges currently faced by many coastal regions in Portugal.
Considering the improvement of the numerical modelling capacity, an equally important goal for achieving good predictability of the nourished beaches evolution, special focus was also given to the study of the beach profile change as the main beach fill responses are intrinsically related to the natural beach sediment dynamics. While short-term responses usually refer to the initial adjustment of the fill and the redistribution of the nourished sand during high-energy events, long-term responses are mainly associated to the evolution of the topography towards new equilibrium conditions and the effect of gradients in the longshore sediment transport (Larson et al., 1999).
Engineering and management needs are increasingly demanding sophisticated, robust, and reliable models able to reproduce faithfully the physical factors controlling the beach change at all time- and length-scales. In this context, a proper balance between physical descriptions from theoretical considerations and empirical information based on data and observations is the key for simulations addressing large areas and long time periods that will yield useful model results. Motivated by these facts, this thesis contributes also to the improvement of an innovative cross-shore numerical model, known as the CS-model, designed to simulate the beach-dune system evolution at a decadal scale (Larson et al., 2016; Marinho et al., 2017b). The CS-model was developed to fill the gap between a sediment budget approach and a detailed profile evolution model, in order to better account the main relevant cross-shore processes in a long-term perspective (Larson et al., 2016; Palalane et al., 2016). Emphasis was given to the numerical modelling of subaqueous beach profile behavior in order to realistically describe the effects of the sediment release from longshore bars towards the beach and vice-versa, encompassing bar evolution, response of feeder mounds and the coupling between the subaerial and subaqueous profile response. Efforts were made to expand the theory for the evolution of a single-bar to a two-bar system, where the volumes of individual bars and their response are modelled. The theoretical developments were tested and validated against existing high-quality data from different field sites in USA. The model was also employed to simulate the medium-term coastal evolution at the Aveiro coast and the behavior of multiple hypothetical artificial beach nourishment scenarios.
Artificial nourishments as a coastal defense solution: monitoring and modelling approaches
7
RISCO – Aveiro Research Center of RIsks and Sustainability in Construction
1.2. Objectives
The main objective of the present dissertation was to investigate the performance associated with artificial beach nourishments on the coastal environment, by taking as starting-point the monitoring scheme established by the Portuguese institutional board responsible for coastal zone management. To address this goal, the discussion of the adequacy of the monitoring plans becomes fundamental, and a significant part of the conducted research was redirected to the development of studies supported by coastal evolution numerical models. Aiming the improvement of the beach morphology change predictability in the presence or not of beach nourishments in a long-term perspective this dissertation intends to offer a tool to coastal engineers and managers in support of the decision-making.
Different development stages of this research encompassed data processing and analysis, numerical model development and application sustained by a set of field observations during monitoring campaigns.
To fulfill the main objectives, the following specific objectives were formulated:
1. Perform a short literature review to document coastal evolution in Portugal. Classify sediment dynamics and morphological change; summarize past coastal interventions and highlight observed problems and high-risk erosion areas.
2. Discuss the legal status and policy on coastal management in Portugal. Analyze administration responsibilities concerning coastal protection and their legal instruments. Describe the future measures and policies to improve the relation between land use and the coastal environment.
3. Compile and analyze available data concerning beach nourishments experiences, with special focus on the Portuguese littoral.
4. Examine the suitability of the monitoring programs built into the national legal coastal administrative system by taking as study case the Barra-Vagueira coastal stretch, located south of the Aveiro harbor.
5. Evaluate and interpret a set of monitoring data in order to relate morphological changes, evolution trends, sediment budgets, sediment transport gradients, and short- and long-term responses of nearshore nourishments to the incoming wave conditions.
Artificial nourishments as a coastal defense solution: monitoring and modelling approaches
8
RISCO – Aveiro Research Center of RIsks and Sustainability in Construction
6. Investigate the numerical approaches for simulating cross-shore sediment transport and long-term profile evolution, both for the subaerial and subaqueous portion of the profile.
7. Develop a subaqueous sub-model for simulating the evolution of a two-bar system, as well as the response of feeder mounds to incident waves and test it against available data.
1.3. Methods
As many engineering studies, the research methodology adopted to build knowledge presented in this dissertation falls largely into the empiricism, i.e., acquisition of knowledge through past experiences and data collection with regard to certain mechanisms, events or phenomenon. In order to achieve the main goals established in this dissertation, different methods were adopted to address all the specific objectives as described below:
o Literature review to collect relevant information concerning coastal evolution in Portugal and its management as a way to open to a discussion about potential weaknesses and strengths of the national coastal zone monitoring policy.
o Data analysis and processing through the use of ArcGis tools and application of multivariate statistical method (Empirical Orthogonal Functions) to investigate the temporal and spatial patterns related to the sediment dynamics of artificial nourishments (Paper II, III).
o Model development to improve calculation approaches regarding subaqueous cross-shore material exchange at decadal scale and its further incorporation in a long-term profile evolution model (Paper IV).
o Model application as a mean to objectively measure the predictably capacity of the developed numerical approaches and its validation at selected sites (Paper I, IV). A significant part of this research is built upon a set of field data, in connection with fill placements, as well as numerical studies which also require the availability of high-quality data sets for calibration and validation procedures. Although this thesis compiles several sets of available data for different sites around the world, the present study was somewhat subordinated to the quality of the instrumental collecting measurements, historical coastal evolution documentation, beach profile records and monitoring approaches adopted for spatial and temporal coverage.
Artificial nourishments as a coastal defense solution: monitoring and modelling approaches
9
RISCO – Aveiro Research Center of RIsks and Sustainability in Construction
1.4. Structure of the dissertation
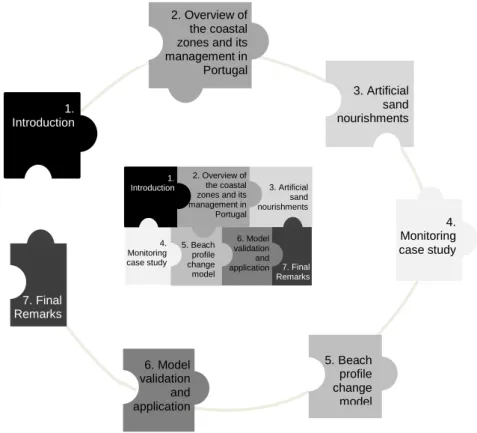
The present dissertation develops in a monography format and is organized in seven chapters supported by a set of appended papers (see Figure 1.2).
Figure 1.2. Structure of the dissertation.
Chapter 1 starts with a brief introduction, giving the background and stating the problems that highlight the importance of the study. The following chapters establish the connection to the main and specific goals defined for this thesis. Chapter 2 offers a general overview of the coastal zones and its management in Portugal, where special emphasis is given to the legal administrative structure, monitoring practices and the future coastal adaptation strategies that have been under discussion by the governmental agencies. Chapter 3 explores general cross-cutting issues related to artificial sand nourishments as a coastal protection measure, presenting some past and current applications along the Portuguese littoral as well as some discussion about costs, benefits and impacts. Chapter 4 is dedicated to the study of a regular-nourished coastal stretch with dredged sand (Barra-Vagueira coastal stretch, northwest coast of Portugal), where a set of correlated analyses are brought together in order to assess the morphodynamic evolution of the fills
1. Introduction 1. Introduction 2. Overview of the coastal zones and its management in Portugal 3. Artificial sand nourishments 4. Monitoring case study 5. Beach profile change model 6. Model validation and application 7. Final Remarks 1. Introduction 2. Overview of the coastal zones and its management in Portugal 3. Artificial sand nourishments 4. Monitoring case study 5. Beach profile change model 6. Model validation and application 7. Final Remarks
Artificial nourishments as a coastal defense solution: monitoring and modelling approaches
10
RISCO – Aveiro Research Center of RIsks and Sustainability in Construction
as well as their impacts related to nearby beaches. The study of the beach profile change is undertaken in chapters 5 and 6, by focusing on model development and application considering or not nourishment scenarios. Final conclusions are drawn in chapter 7, followed by potential recommendations for further research.
Some research results have been disseminated as follows in the appended papers: Paper I (Palalane et al., 2016) addresses the specific objective 6 by exploring an innovative simplified numerical approach based on a schematization of the beach profile shape that allows simulations of the beach-dune system evolution for large time-scales while keeping the model stability.
Paper II (Marinho et al., 2017a) and Paper III (Marinho et al., 2018a), in line with the specific objectives 4 and 5, analyze in deep a field dataset resulted from a national follow-up program established to control the impact of several dredging-disposal activities in the vicinity of a harbor – a symbiotic solution typically adopted to mitigate erosion in Portugal.
Paper IV (Marinho et al., 2017c), in response to the specific objective 7, describes the development of a sub-model to simulate cross-shore exchange of material, with focus on two-bar systems evolution and feeder response of artificial bars.
C
HAPTER
2
OVERVIEW OF THE COASTAL ZONES
AND ITS MANAGEMENT IN PORTUGAL
Chapter structure
2.1. Coastal evolution: past vs present
2.2. Geomorphology and sediment transport
2.3. Coastal protection interventions
2.4. Vulnerability and risk of the Portuguese coastal areas
2.5. Coastal management and planning
2.5.1. Administration, legislation and regulation 2.5.2. Policy tools for coastal zone management
2.5.3. Management plans for the Portuguese coastal zones 2.5.4. Coastal protection and decision-making process
2.6. Monitoring at an institutional and public level
2.6.1. Special data storage infrastructure (SDSI): gaps and good practices 2.6.2. Portuguese information systems infrastructures
2.6.3. Portuguese monitoring priorities
2.6.4. Monitoring program of the Portuguese coastal zones (COSMO)
2.7. Data collection approaches 2.7.1. Laboratory approach 2.7.2. Field approach
2.8. Coastal adaptation strategies