M
M
e
e
t
t
a
a
b
b
o
o
l
l
i
i
c
c
b
b
a
a
s
s
i
i
s
s
o
o
f
f
(
(
S
S
o
o
l
l
e
e
a
a
s
s
e
e
Mestrado em Aquacultura e Pe
Especialização em Aquacultura
Maria Filipa Bento de Oliveira Falcão Castanheira
f
f
g
g
r
r
o
o
w
w
t
t
h
h
v
v
a
a
r
r
i
i
a
a
t
t
i
i
o
o
n
n
i
i
n
n
e
e
n
n
e
e
g
g
a
a
l
l
e
e
n
n
s
s
i
i
s
s
,
,
K
K
a
a
u
u
p
p
1
1
8
8
Mestrado em Aquacultura e Pescas
Especialização em Aquacultura
Maria Filipa Bento de Oliveira Falcão Castanheira
Faro, 2009
n
n
j
j
u
u
v
v
e
e
n
n
i
i
l
l
e
e
s
s
o
o
l
l
e
e
8
8
5
5
8
8
)
)
scas
Maria Filipa Bento de Oliveira Falcão Castanheira
M
M
e
e
t
t
a
a
b
b
o
o
l
l
i
i
c
c
b
b
a
a
s
s
i
i
s
s
o
o
f
f
(
(
S
S
o
o
l
l
e
e
a
a
s
s
e
e
Universidade do Algarve
Faculdade de Ciências e Tecnologia
Mestrado em Aquacultura e Pescas
Especialização em Aquacultura
Maria Filipa Bento de Oliveira Falcão Castanheira
Faro, 2009
f
f
g
g
r
r
o
o
w
w
t
t
h
h
v
v
a
a
r
r
i
i
a
a
t
t
i
i
o
o
n
n
i
i
n
n
j
j
u
u
v
v
e
e
n
n
e
e
g
g
a
a
l
l
e
e
n
n
s
s
i
i
s
s
,
,
K
K
a
a
u
u
p
p
1
1
8
8
5
5
8
8
)
)
Dissertação orientada por
Doutor Luís Conceição, CCMAR
Doutora Sofia Engrola, CCMAR
Universidade do Algarve
Faculdade de Ciências e Tecnologia
Mestrado em Aquacultura e Pescas
Especialização em Aquacultura
Maria Filipa Bento de Oliveira Falcão Castanheira
v
v
e
e
n
n
i
i
l
l
e
e
s
s
o
o
l
l
e
e
)
)
Dissertação orientada por:
Doutor Luís Conceição, CCMAR
Doutora Sofia Engrola, CCMAR
ACKNOWLEDGEMENTS
It is a pleasure to thank the many people who made this thesis possible.
I would like to express sincere gratitude to my supervisors Doctor Luís Conceição and Doctor Sofia Engrola who accepted me in the Aquaculture Research Group.
A special thank to Doctor Sofia Engrola, which has been abundantly helpful and has assisted me in numerous ways. Thank you for the unreserved support, infinity patience, for revising, and for your optimism.
Thanks for being a great person as a human being, Doctor Luís Conceição you are the perfect example of a scientist. I am very glad for the chance provided by you for me to grow as a student in this unique research environment. The discussions I had with you were valuable. I specially thank for your warm support, for revision the manuscript and infinite patience. Thus, many, many thanks to you both. I am not sure that you realize just how important you have been to this phase of my life.
This work was financed by Project ECOAQUA, Programme POCTEP.
A special thanks and appreciation to João Reis, for your precious help concerning everything that you had to do in the rearing systems and all the technical solutions that you found to solve the problems. Many thanks for the conception of Oxilogger program.
I am very grateful to all my colleagues at the Ramalhete. The atmosphere was always been a perfect source of motivation. In particular very special thanks to Lena for constant help with hard work and also for the friendship. I also thanks to Miguel, his background work guaranteed that the experimental facilities were functioning perfectly. Thanks Rita for the help during the initial phase of the experiment. I also thank to all others who were always willing to help, discuss some topic, or just go out for a funny time.
Special thanks also to the Aquagroup Research Group, working with you all was an immense pleasure for me.
I am grateful to João Sendão for the office furniture. ☺
I must also acknowledge to Benjamím Costas for the cortisol analysis.
I would like to give thanks to my friends for making my spare time enjoyable and helping me when it was needed. Special tanks my friends the funny lunch time in the past months.
My deepest gratitude goes to my family. Thank you for all your strength, love and for always supporting me in following my dreams!
Finally, for Rui Alexandre. For everything! Your support, optimism, patience, understanding and endless love. Thank you SO MUCH.
À minha irmã,
Isabel
RESUMO
O objectivo geral deste estudo é compreender os factores intrínsecos responsáveis pela variação individual no crescimento de juvenis de linguado senegalês (Solea senegalensis). O Linguado senegalês é uma espécie de elevado valor comercial e com elevado interesse em Aquacultura na Europa, por isso seria importante perceber essa variação individual. Compreender as causas para a variação individual de crescimento e relacionar essas causas com o consumo de alimento, comportamento alimentar e resposta ao stress, contribui para maximizar a eficiência produtiva, reduzir os desperdícios alimentares e melhorar a qualidade da água. Isto poderá resultar no desenvolvimento de novas práticas de gestão e melhoramento produtivo, contribuindo para o desenvolvimento do sector da Aquacultura. De modo a identificar os possíveis factores responsáveis pela variação individual no crescimento do linguado, foi determinado o crescimento e a sua relação com o metabolismo, resposta ao stress e consumo de alimento. Doze peixes com peso inicial de 18.49 ± 2.94g foram mantidos em condições standard e alimentados uma vez por dia, durante um período de seis meses. As medições individuais do consumo de oxigénio em juvenis de linguado foram realizadas através de respirometria em condições standard, após o peixe ser alimentado e após stress por emersão. Foram também retiradas amostras de sangue para cortisol de todos os peixes no início da experiência (controle, indicativo das condições basais) e após exposição ao stress. A quantificação do consumo alimentar individual foi realizada por incorporação de ballotinis na ração que foi administrada aos peixes. Após a alimentação com ração contendo ballotinis foi feita uma radiografia para quantificar o número de grânulos ingeridos por cada peixe. Os linguados apresentaram individualmente uma variação acentuada do crescimento (peso final entre 30.45 a 67.53g), do consumo de oxigénio em jejum (entre 108.0 a 447.4 µmol / g / h), do consumo de oxigénio após alimentação (entre 174.7 a 813.5 µmol / g / h), do consumo de oxigénio após stress por emersão (186.8 a 376,7 µmol / g /h), e do cortisol plasmático após o stress por emersão (4.81 e 46.45 ng/ml). Neste estudo, as diferenças individuais na taxa metabólica não contribuiram para explicar as diferenças individuais no crescimento. No entanto, diferenças individuais na resposta após stress por emersão parecem desempenhar um papel relevante no esclarecimento das diferenças individuais de crescimento, talvez resultante dos peixes apresentarem diferentes estilos comportamentais. A medição do consumo de alimento pelo método de raio-X não parece ser um bom indicador da taxa de crescimento. O consumo de oxigénio em peixes alimentados e sob um stress por emersão aumenta, o que se deve a custos aditivos de crescimento e de stress, em relação ao custo de manutenção. Em conclusão, este estudo sugere que a variação individual de crescimento do Linguado senegalês é essencialmente devido a variação genética, e como tal programas genéticos devem ser adoptadas para diminuir a variação individual no crescimento. Um estudo com um maior número de peixes e durante um maior período de tempo seria importante para se verificar algumas das tendências encontradas nesta tese entre o potencial de crescimento, taxa metabólica e consumo de alimento no linguado.
Palavras-chave: Solea senegalensis, metabolismo, consumo de alimento, bioenergética, variação de crescimento.
ABSTRACT
The general aim of this study was to understand the underlying factors responsible for the individual variation in growth of juvenile Senegalese sole (Solea senegalensis). Senegalese sole is a species of high commercial value and high interest for aquaculture in Europe, therefore it would be important to understand these individual variations. Understanding the causes for individual variation in growth in relation with the feed intake, metabolic rate and response to stress contributes to maximize the production efficiency by reducing food waste and improving water quality. In order to identify the possible factors responsible for the individual variation in sole growth, its relationship with metabolic rate, stress response and feed intake was determined. Twelve fish with 18.49 ± 2.94g of initial weight were kept in standard conditions and feed once a day, during a period of six months. Individual oxygen consumption measurements in Sole juveniles were determined by flow-through respirometry at standard conditions, after the fish were fed a single meal and after a stressful condition. Blood samples for plasma cortisol, were taken from all fish at the start of the experiment (control, indicative of basal levels) and after stress exposure. Quantification of individual feed intake was performed by incorporation with radio-opaque ballotinis glass beads in a dry feed, followed by radiography to quantify the amount of ingested pellets. Individual fish exhibited pronounced variation in growth (final weight ranging from 30.45 to 67.53g), oxygen consumption of fasted fish (108.0 to 447.4 μmol/g/h), oxygen consumption of fed fish (174.7 μmol/g/h to 813.5 μmol/g/h), oxygen consumption after emersion stress (186.8 μmol/g/h to 376.7 μmol/g/h), and plasma cortisol after emersion stress (4.81 ng/ml to 46.45 ng/ml). Individual differences in metabolic rate do not contribute to explain individual differences in growth. However, after emersion stress individual differences in stress response seem to play a role in explaining individual differences in growth, what may result from different copying styles. Sole feed intake as measured by X-ray does not seem to be a good indicator of growth rate. The oxygen consumption increases both when fish are fed and after an emersion stress, as result of additive costs of growth and stress to the cost of maintenance. All together, this study suggests that individual variation of growth in Solea senegalensis is essentially due to genetic variation, and its reduction may accomplished when genetic selection programs are adopted. Furthermore, a study with a larger number of fish and over a larger time period would be important to check some of the trends found in this thesis between growth potential, metabolic rate and coping styles of Senegalese sole.
CONTENTS ACKNOWLEDGEMENTS ... iii RESUMO ... v ABSTRACT ...vi CONTENTS ... vii 1. INTRODUCTION ... 1 1.1. Production in aquaculture ... 1
1.2. Senegalese sole (Solea senegalensis)... 2
1.3. Individual variation in the growth of fish ... 3
1.4. Causes of Individual variation in growth ... 4
1.4.1. Feed intake ... 4
1.4.2. Feeding behaviour ... 5
1.4.3. Stress response ... 6
1.4.4. Social hierarchy ... 7
1.5. Metabolism and bioenergetics in fish ... 8
1.6. Objectives of the study ... 9
2. MATERIAL AND METHODS ... 10
2.1. Experimental procedures ... 10
2.1.1. Fish stocks and rearing conditions ... 10
2.1.2. Experimental design ... 11
2.1.2.1. Individual measurements at fasting conditions ... 12
2.1.2.2. Individual measurements in fish fed a single meal ... 13
2.1.2.3. Individual measurements after stressful condition ... 13
2.1.3. Sampling methods ... 14
2.1.3.1. Growth ... 14
2.1.3.2. Feed intake ... 14
2.1.3.3. Plasma cortisol levels ... 15
2.1.3.3.1 Cortisol analysis ... 16
2.1.3.4. Respirometry ... 17
3. RESULTS ... 20
3.1. Individual variation in growth performance ... 20
3.2. Individual variation in oxygen consumption ... 23
3.2.1. Oxygen consumption in fasted fish ... 23
3.2.2. Oxygen consumption in fed fish ... 24
3.2.3. Oxygen consumption in fish after Emersion stress ... 25
3.2.4. Comparison of oxygen consumption in different conditions ... 26
3.2. Feed intake ... 28
3.3. Stress indicators (Cortisol levels during emersion) ... 29
3.4. Correlations between variables ... 30
3.4.2. Correlation between oxygen consumption in Fasted and Fed fish ... 32
3.4.3. Correlation between oxygen consumption in Fasted and Stressed fish ... 34
3.4.4. Correlation between oxygen consumption and feed intake... 36
3.4.5. Correlations between cortisol levels and other variables ... 37
3.4.6. Correlations between feed intake and growth ... 40
4. DISCUSSION ... 41
4.1. How variable are individual growth, feed intake and metabolic rate of sole juveniles?.. 41
4.2. Does growth rate correlate with feed intake? ... 43
4.3. Does growth rate correlate with fish metabolic rate? ... 44
4.4. Does stress affect growth and feed intake of sole juveniles? ... 44
4.5. Does stress affect metabolic rate of sole juveniles? ... 45
4.6. How does individual variation relate with stress response? ... 46
5. CONCLUSIONS ... 47
6. REFERENCES ... 48
1. INTRODUCTION
1.1. Production in aquaculture
Aquaculture has seen a worldwide expansion over the past 20 years and it seems that growth is set to continue (Ashley, 2007). World total demand for fish and fishery products is projected to expand by almost 50 million tonnes to 183 million tonnes by 2015, and it is expected that out of this increase, 73% will come from aquaculture, accounting for 39% of global fish production (FAO, 2008).
In Europe, the aquaculture industry has expanded extensively in the last few decades, scientific and technical interests have focused on high value native species whose biological cycle can be reproduced using currently available breeding techniques (Imsland et al., 2003). The rapid increase in the production volume of some species, for example the gilthead seabream (Sparus aurata) and the European seabass (Dicentrarchus labrax), especially from the late 1980s, caused some market saturation and a lowering of the prices, which provided an incentive for diversification into new marine fish species (Shields, 2001).
Senegalese sole (Solea senegalensis) has been considered a promising candidate for marine aquaculture in Europe since the nineties (Dinis et al., 1999). The current market price in the EU is around 14,5 €/ kg (FAO, 2008). The high interest in this species has led to major achievements in larval nutrition and rearing techniques, despite weaning success still being highly variable (Conceição et al., 2007, Engrola et
al., 2007).
In sole culture, there are still obstacles in the development of feeding and ongrowing systems, which are mainly due to the peculiar feeding behaviour of this species (Engrola et al., 2001). Nonetheless, weaned sole presents high growth during ongrowing in earthponds. Therefore, ongrowing in outdoor ponds in policulture with gilthead seabream appears promising (Dinis et al., 1999).
Nevertheless, growth and survival from juvenile to market-size fish in intensive farming systems is often problematic, due to lack of knowledge with regard to rearing technology and husbandry conditions, feeding behaviour and nutritional requirements (Rema et al., 2007). Among the different factors that may induce high mortality during the juvenile stage, stress might be one of the key issues (Costas et al., 2008).
Furthermore, growth dispersion is also a problem (Imsland et al., 2003) as in many other species. Therefore, information of growth variation and its relation with the feed intake, feeding behaviour and response to stress needs to be clarified.
1.2. Senegalese sole (Solea senegalensis)
The Senegalese sole, Solea senegalensis, is a common fish in the Western Mediterranean and in the Southeast coast of the Atlantic. This species is a high value flatfish in the Southern Europe, commonly reared in extensive aquaculture production in Portugal and Spain (Dinis et al., 1999).
The Senegalese sole is a teleost fish and classified as:
Class: Actinopterygii Order: Pleuronectiformes Family: Soleidae
Genus: Solea
Species: Solea senegalensis (Kaup,1858)
Senegalese sole is a flatfish with oval and asymmetric body, eyes on the right side (dorsal side), dorsal fins from head to caudal fin and pectoral fin on the eye side. Its natural habitat is the sandy or muddy bottoms, off coastal areas up to 100m depth. The maximum length of this species is 60cm on Atlantic waters, however in Mediterranean waters is less than 35cm (Whitehead et al., 1986). Sole is a gonochoric species, and females normally mature at age 3 + with a total length around 32cm (Dinis, 1986, Ramos and Roures, 1983). In nature, Senegalese sole feeds mainly on benthonic invertebrate living in the sediment, such as polychaet larvae, bivalve molluscs, smalls fish and crustaceans (Vinagre and Cabral, 2008, Whitehead et al., 1986).
1.3. Individual variation in the growth of fish
Growth is a complex process and is defined as an increase in size over time. Growth can differ between different species, strains or populations within the same species and between individuals within the same population (Irwin et al., 1999b). Most of the fish species reared in aquaculture exhibit considerable growth (weight) variation within a given batch (Martins et al., 2005). Many research into the causes of such intraspecific variation in growth have been undertaken, particularly in commercially important species in aquaculture, where uniform sized fish groups are desirable (Irwin
et al., 1999b). As earlier suggest by Butts and Litvak (2007) in Winter flounder
(Pseudopleuronectes americanus), the parental effects on survival and growth in different populations may allow for selection of the most suitable broodstock for aquaculture production. Intraspecific variability in the size of fish is associated with spawning time with a seasonal decline in egg size having been described in marine fish (Bagenal, 2006).
Knowledge about the maternal age has recently been considered a factor of variability in growth. The older females of black rockfish (Sebastes melanops) had growth rates more than three times faster compared with fish from the younger females. The apparent underlying mechanism is a greater provisioning of larvae with energy-rich triacylglycerol (TAG) lipids as female age increases. The volume of the yolk lipid (composed primarily of TAG) present in larvae at spawning increases with maternal age and is correlated with subsequent growth (Berkeley et al., 2004).
Under aquaculture conditions, individual variation in growth can result from external factors (eg, time and frequency of feeding and social interactions) and internal factors (eg metabolic rate, digestibility, energy expended in swimming) (Martins et al., 2006a). For example in African catfish (Clarias gariepinus) the individual growth rate was significantly affected by feeding time and frequency. Day time feeding with three equal size meals a day gave the lowest growth and highest food wastage. The growth rates of fish fed continuously or during night time following their feed demand were significantly higher with lowest food conversion ratios and food wastage (Mostafa et
The pronounced inter-individual variations in food consumption, growth, and growth efficiency observed in juvenile hybrid sunfish have been associated with the establishment of social hierarchies (Wang et al., 1998). Dominant fish can monopolize a disproportionate share of available resources, resulting in faster growth of these fish compared to subordinates (Jobling and Baardvik, 1994).
However others factors are responsible for variation in growth. Information of dietary protein requirements for maximum growth in Solea senegalensis (Rema et al., 2007) is important in this respect. Response to stressors involves a series of biochemical and physiological responses, which may affect growth variation (Costas et
al., 2008). Some variation in growth has also been related to stocking density
(Ambrosio et al., 2008).
Studies evaluating growth potential have usually focused on feeding of the tank and the inherent changes in biomass, and do not take individual variation into account (Jobling and Baardvik, 1994). The scarceness of data on individual growth performance is sturdily related to difficulty in measuring it, usually a mean value is used to demonstrate the rank of the inter-individual variation in growth (Martins et al., 2005).
However, understanding the individual variation in feed consumption and growth contributes to maximize the production efficiency by reducing food waste and improving water quality (Millot et al., 2008).
1.4. Causes of Individual variation in growth
Variation in growth of individuals is a common feature of fish populations, and such variation is a drawback in commercial fish culture (Barki et al., 2004). In order to reduce this variation it is essential to have an understanding of the extent of the phenomenon and then to investigate how growth can be promoted and individual variation reduced.
1.4.1. Feed intake
growth dispersion in fish juveniles and larvae (Haylor, 1993). In many species, differential growth arises when food is a limiting factor and there is monopolization of food resources by a small number of dominant individuals (Irwin et al., 2002). Competition resulting in an inadequate food supply could persist in older fish even when food supply is adequate (Jobling and Baardvik, 1994). If feed supply is unlimited and competition reduced, increasing feeding frequency may increase growth and reduce dispersion by improving food intake of more individuals in a tank. Furthermore, (Dwyer et al., 2002) observed that when rainbow trout is feed at low frequency fish tend to eat more per meal and may develop a larger gut capacity over time. In addition, pellet size and the feed delivery rate within a meal may also promote a more efficient digestion (Andrew et al., 2004b). However, if feed is limited and competition for feed increases, fish consume as much feed as possible in a short period of time and conserve energy during feeding (Andrew et al., 2004a).
In short, optimising growth rates and feed efficiency, and reducing growth variation, in fish depends upon the way in which food is made available, the feeding method, feeding frequency, the duration of each feeding period, the amount of food delivered and the characteristics of the diet (Ambrosio et al., 2008).
1.4.2. Feeding behaviour
Pronounced variation in feeding behaviour within a population has been described for many fish species (Martins et al., 2006b, Qian et al., 2002, Wang et al., 1998). Some variations in growth can be attributed to genetic differences between individuals but social interactions, specifically competition for food are believed to be a important contributor to differential growth (Irwin et al., 2002). Moreover studies for several fish species showed differential growth arises where feed is restraining and there is monopolization of food resources by dominant individuals (Carter et al., 1992). Dominant individuals present differences in the ability to obtain the meal faster by eating faster and being at the most favourable areas of the tank. When there is more competition for food African catfish exhibited the highest swimming activities and waiting-in-feeding-area what may induce differences in individual growth (Martins et
al., 2005). Low and large inter-individual variability in feed intake seem related to
feeding motivation. Differences in feeding behaviour during first feeding could explain differences in growth between fast and slow growing strains (Sundström et al., 2003). Different fish species have distinct feeding behaviour associated with their life history and habits therefore, the importance of feeding behavior in growth variation varies from species to species (Wedemeyer, 2001).
1.4.3. Stress response
In intensive fish culture, environmental and physical stressors associated with stocking densities of fish can affect many physiological functions thereby affecting fish growth. In response to a stressor, a fish will undergo a series of biochemical and physiological changes in an attempt to compensate for the challenge imposed upon it, and so cope with the stress (Costas et al., 2008, Arjona et al., 2009). One of the most accepted primary indicators of stress is the increase in plasma cortisol levels (Van Weerd and Komen, 1998). Fish respond to a stress by several alterations (endocrine and physiological), which may influence the hability of fish to survive, increase the incidence of diseases, or limit growth (Pickering, 1998).
Stress in teleost fishes is manifested as primary, secondary and tertiary responses. The primary stress response of fish involves the realease of catecholamines into the circulatory system from chromaffin cells. This stress response also stimulates the hypothalamic-pituitary-interrenal (HPI) axis to release corticosteroids (e.g.,cortisol) from the interregnal tissue (Barton, 2002). In turn, these primary effects cause a number of physiological changes known as “secondary effects”. The secondary response as changes in range of biochemical, haematological and immunological factors (e.g., hight plasma glucose, low muscle protein and low potassium) (Frisch and Anderson, 2005)
The secondary responses may eventually advance to tertiary stress responses, which include reduced growth rate, reduced metabolic range for activity, decreased disease resistance, decreased reproductive capacity, changed behaviour and survivability (Barton, 2002, Barton and Iwama, 1991, Mommsen, 2001). The extend of
(Portz et al., 2006). Chronic stress, even at low levels may impair performance by diverting energy resources that might otherwise be used for routine activities, growth, immune function, and/or reproduction (Barton, 2002, Barton and Iwama, 1991). Environmental stress is often long-lasting (chronic) and therefore, non- adaptive. It is assumed that this must, in the long run, influence growth (Van Weerd and Komen, 1998). In addition, stress leads to an increase in metabolic requirement for maintenance leading to a reduction of the growth potential (Barton and Iwama, 1991). This results from increasing demands for defence and repair processes (e.g., heat-stock proteins, increased protein turnover) which require energy results in increased maintenance costs. Individual differences in the mobilization and allocation of energy under stress response are related to individual differences in growth (Maltby, 1999).
Under stress conditions cortisol may also influence amino acid metabolism, as suggested by the decrease in free amino acid concentrations in Senegalese sole under repeated handling stress (Aragao et al., 2008).
1.4.4. Social hierarchy
Social rank has great consequences for individual growth variation. Individual differences in competitive ability, aggressiveness and/or size can lead to the establishment of dominance hierarchies within groups of fish (Metcalfe et al., 1989). The variation in growth rates in groups of fish are related to dominance hierarchies and preferential access to food resources by dominant individuals (Carter et al., 1992). Aggressive behaviour as well as recordings of inter-individual variation in growth rate and food intake, suggest that in many species the social hierarchies become less distinct with increasing stocking densities (Cubitt et al., 2008).
Knowledge of social hierarchies under high stocking densities is scarce. However, such information would be relevant to understand species biology, to optimize production, and improve animal welfare (Martins et al., 2006a).
Furthermore, the traditional theory that individuals grow faster because they are dominant has been questioned (Wang et al., 1998). These authors suggest that genetic factors may be more important in explaining differences in individual growth
rate. In fact, individual differences in feed intake and feed efficiency were found in fish housed individually, thus in the absence of social interaction (Qian et al., 2002).
1.5. Metabolism and bioenergetics in fish
Growth is an energy demanding process and it accounts for a large portion of the energy expenditure (Jobling et al., 1989). The distinction between energetic costs of growth and maintenance is problematic, because costs of maintenance also include costs of synthesis of macromolecules to balance breakdown of body constituents, including turnover of proteins (Jørgensen, 1988). According to Conceição (1997) the cost of maintenance may be approximated by the oxygen consumption of a fasted fish with routine activity, and is mainly due protein turnover and cell volume regulation. In general, the cost of protein turnover accounts for around 40% of the cost of maintenance (Houlihan et al., 1995).
Growth rates per unit of body mass decrease as animals increase in size. In addition, increasing body mass gives rise to a diminishing mass-specific oxygen consumption (Conceição et al., 1998). The cost of growth, defined as the energy expenditure above the maintenance metabolism, was estimated to be 66 mmol ATP g-1 dry weight (DW) deposited for animals growing faster than 16.8% body dry weight (BDW) day-1 (Wieser, 1994), and generally increasing as growth rate diminishes. However, there is no evidence so far that the cost of growth changes in such a pattern for individuals within a given species growing at different rates.
Growth of an organism is based on the utilization of available energy to increase body tissue. Energy gained from food consumption may also be used for processes other than growth. Studies in bioenergetics at the individual level deal with the partitioning of ingested food energy based on a balanced energy budget:
C=G + R + E + F
where C =consumption of food energy, G =growth, R =respiration, E =excretion (nitrogenous wastes) and F =faecal output (Shearer et al., 1997).
There are three general metabolic states for which oxygen consumption has been defined: standard, routine, and active metabolism. The standard rate is when
there is no spontaneous fish activity, the routine rate is when spontaneous activity occurs, and the active rate is induced by forcing the fish to swim (Merino et al., 2009).
The cost of growth is defined by the energy expenditure above the maintenance metabolism. This cost includes the deposition of proteins and lipids, the protein turnover on the maintenance level and the cost of food search (capture and assimilation) that leads to an increase in oxygen consumption comparable to the increased in prostprandial metabolism. A significant part of cost of growth may be due to energy spent in control processes involved in the regulation of metabolism in general and of protein synthesis in particular (Pedersen, 1997).
A higher cost of growth is associated with reduced growth rates, and reflected in lower gross food conversion efficiencies. Decreasing growth rates are a result of reduction in relative rates of feed-intake and are accompanied by a reduction in oxygen consumption (Conceição et al., 1998).
1.6. Objectives of the study
The general aim of this study was to understand the underlying factors responsible for the individual variation in growth of juvenile Senegalese sole (Solea
senegalensis).
Most of the species reared in aquaculture exhibit considerable growth variation. Understanding the causes for individual variation in growth in relation with feed intake, feeding behaviour and response to stress contributes to maximize the production efficiency by reducing food waste and improving water quality. That may result in the development of new management practices and improved production, contributing to the development of the aquaculture sector.
In order to identify the possible factors responsible for the individual variation in sole growth, growth and it relationship with metabolic rate, stress response and feed intake was studied in a group of twelve animals.
2. MATERIAL AND METHODS
2.1. Experimental procedures
2.1.1. Fish stocks and rearing conditions
Twelve Senegalese sole juveniles (Solea senegalensis), with 18.49 ± 2.94 g of initial weight were kept at the Ramalhete facility at the CCMAR/University of Algarve (Faro, Portugal). Fish were obtained from natural spawning of wild broodstock and reared according to standard larval and juvenile rearing protocols (Dinis et al., 1999). Fish were maintained in a 21L flat-bottomed fibreglass tank (70cm length x 30cm width x 6cm depths) in a semi-closed recirculation system equipped with a biofilter and UV filter, at a constant flow rate in the tanks of 109 L/h, nearly five renovations per hour (Fig. 2). The water renewal in the recirculation system was 19.5% per day. The initial stock was divided in two tanks during the experiment, in order to avoid further disturbance of sole once most measurements were done in six fish per day. The tanks were covered with a net, and placed behind a black curtain, in order to avoid stress due to human presence. The sole were reared at 19.9 ± 1.3 ° C water temperature; dissolved oxygen was above 90% of saturation, and salinity around 36‰. The water parameters were monitored daily. The quality of water was determined by weekly measurements of nitrite and ammonia.
The photoperiod was maintained 14 h dark and 10 h light with a light intensity of 12 lux. During a period of six months, the fish were fed once a day a commercial diet (Aquagold 2mm, Sorgal SA, Ovar, Portugal; proximate feed analyses was 44% crude protein, 14% crude fat, 8% ash, 2.5% crude fibres, 1.0% phosphorus; starting at 9:30. The feed excess (feed not eaten) was removed from the tanks after three hours, around 12:30.
Fig. 2- Recirculation system and tanks used throughout the experimental period.
Fish were tagged with colour codes in order to be able to identify each fish individually throughout the experimental period. Before tagging, fish were randomly transferred to a 10L bucket filled with 5L of sea water and anaesthetic, 2-phenoxyethanol (Sigma-Aldrich, Germany; 1:150 v/v). Anaesthetized fish were tagged individually with colour marks in abdomen, weighted and distributed over two 21L flat-bottomed fibreglass tanks. Three different colours (blue, green and pink) of water-based paint (Acualux TITAN “al agua” colores satinados, Industrias TITAN, S.A., Spain) were used for colour marks. The colours were injected in order to form three lines placed on the blind side between skin and muscle and parallel to muscle direction. The paint was injected using sterile syringes (ONCE 1ml) and non-pyrogenic needles (Terumo Neolus 25G x 5/8’’; 0.5 x 16mm, Terumo Europe N.V., Belgium). This procedure was repeated four times during the experiment, as marks tended to become faint with time.
2.1.2. Experimental design
Individual fish growth was recorded during the whole experimental period. In addition, the experiment was divided into two distinct parts. A first part where fish were grown undisturbed in order to analyse the growth potential of individual fish,
R7 R9 Inlet Outlet 1 2 3 Reservoir Biofilter Mecanic filter 3 2 1 4 4 Pump R8
and a second part where
measurements of oxygen consumption, feed intake and/or plasma cortisol levels under different conditions: fasting fish, fed fish and fish subjected to a 3 min emersi stress.
Fig. 3- Chronogram of the experiment. The phases refer to treatment during the trial
(sampling) days. Sampling days are marked with blue arrows. The remainder of the (non sampling) days fish were let undisturbed and fed normally.
2.1.2.1. Individual measurements at fasting conditions
This phase aimed to quantify the individual differences in Senegalese sole juveniles, in terms of cortisol levels and routine metabolism. It was also intended to establish eventual relationships between th
performed in different days, with a minimum of one week interval, were performed for every fish. In each trial, oxygen consumption in individual Sole juveniles was determined by flow-through respirometry. Subsequently
were taken to determine the routine levels of cortisol. This phase lasted from day 59 to day 113 of the experiment and measurements were performed at days 85, 106 and 113 (Fig. 3). In the remaining
and a second part where repeated handling of fish occurred, in order to perform measurements of oxygen consumption, feed intake and/or plasma cortisol levels under different conditions: fasting fish, fed fish and fish subjected to a 3 min emersi
Chronogram of the experiment. The phases refer to treatment during the trial (sampling) days. Sampling days are marked with blue arrows. The remainder of the (non sampling) days fish were let undisturbed and fed normally.
. Individual measurements at fasting conditions
This phase aimed to quantify the individual differences in Senegalese sole juveniles, in terms of cortisol levels and routine metabolism. It was also intended to establish eventual relationships between those variables and growth. Three trials performed in different days, with a minimum of one week interval, were performed for every fish. In each trial, oxygen consumption in individual Sole juveniles was through respirometry. Subsequently, blood samples from all fish were taken to determine the routine levels of cortisol. This phase lasted from day 59 to day 113 of the experiment and measurements were performed at days 85, 106 and
. 3). In the remaining days fish were let undisturbed and fed normally.
repeated handling of fish occurred, in order to perform measurements of oxygen consumption, feed intake and/or plasma cortisol levels under different conditions: fasting fish, fed fish and fish subjected to a 3 min emersion
Chronogram of the experiment. The phases refer to treatment during the trial (sampling) days. Sampling days are marked with blue arrows. The remainder of the
(non-This phase aimed to quantify the individual differences in Senegalese sole juveniles, in terms of cortisol levels and routine metabolism. It was also intended to ose variables and growth. Three trials performed in different days, with a minimum of one week interval, were performed for every fish. In each trial, oxygen consumption in individual Sole juveniles was , blood samples from all fish were taken to determine the routine levels of cortisol. This phase lasted from day 59 to day 113 of the experiment and measurements were performed at days 85, 106 and
2.1.2.2. Individual measurements in fish fed a single meal
The goal of this phase was to quantify if feed consumption and metabolism of Senegalese sole juveniles were affected after a single meal. It was intended to establish the possible relationships between these variables and growth. Three trials performed in different days, with a minimum of one week interval, were performed for every fish. Quantification of individual consumption of food, was performed by offering feed incorporated with (radio-opaque) dense ballotini glass beads (rate of incorporation: 1%) to fish during a period of 30 minutes. After this period fish were removed from the tank, anaesthetized and exposed to X-rays in order to quantify the amount of ingested food. Subsequently the oxygen consumption in individual Senegalese sole juveniles was determined by flow-through respirometry. This phase lasted from day 114 to day 134 of the experiment and measurements were performed in days 120, 127 and 134 (Fig. 3). In the remaining days fish were let undisturbed and fed normally.
2.1.2.3. Individual measurements after stressful condition
This phase was designed to assess if an acute stressful condition could influence the Senegalese sole individual response in relation to oxygen consumption and cortisol levels. Two trials performed in different days, with twenty one days interval, were performed for every fish. The stress test consisted of holding each fish individually in a net outside the water for three minutes. One hour after the stress test, and before starting the oxygen consumption measurements, blood was collected from each fish for cortisol analysis. Subsequently, the oxygen consumption in individual Sole juveniles was determined by flow-through respirometry. This phase lasted from day 135 to day 163 of the experiment and measurements were performed in days 142 and 163 (Fig.3). In the remaining days fish were let undisturbed and fed normally.
2.1.3. Sampling methods
2.1.3.1. Growth
Growth was determined by weighting (g) all fish at the beginning of the experiment and at the end of each oxygen consumption measurement. Fish were individually weighed in a scale (KERN- EW 600-2M, 0.01 g).
2.1.3.2. Feed intake
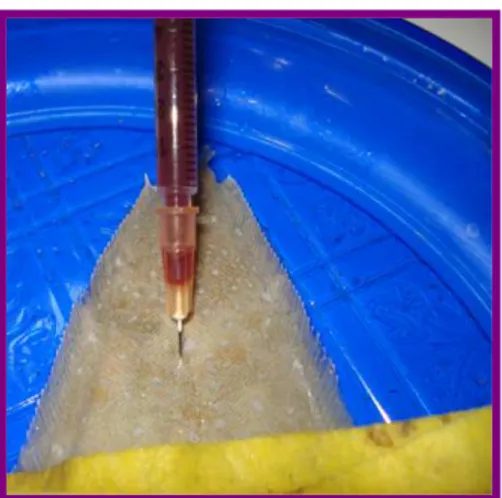
Feed intake was quantified by fish exposure to X-rays after a single meal, in order to determine the amount of ingested feed.
Fish were fed in excess during 30 minutes before the radiography determination. The feed was previously incorporated with known quantities of X-ray dense ballotini glass beads at 1% incorporation in feed dry matter. After the meal, the fish were taken out from each tank, three at a time and anaesthetized with 2-phenoxyethanol (Sigma-Aldrich, Germany; 1:300 v/v). The X-ray was taken with a Multimage X-ray (Microbloc 20, Italy) with a focus of 1.8mm; the time of exposure to X-ray was 2´´ (Fig. 4). Green film (Kodak, France) was used, and developed with (Kodak, France) developer.
The feed intake measurements were calculated using a calibration curve with ballotini-incorporated feed (Fig. 5). The different amounts of feed (0.25g; 0.5g; 1.0g; 1.5g; 2.0g; 3.0g and 4.0g), were weighed in triplicate samples. Radiography was done to the feed in order to quantify the number of ballotinis per gram of feed. The equation obtained was: y=92.36x-12.62; R2=0.98.
Fig. 5- Calibration curve of feed with incorporated ballotinis.
2.1.3.3. Plasma cortisol levels
Plasma cortisol levels were measured in fasted fish and after stressful condition (emersion for three minutes).
Blood sampling was performed in anaesthetized fish (2-phenoxyethanol, Sigma-Aldrich, Germany; 1:500 v/v). Blood was withdrawn from caudal vein (Fig. 6) using heparinised syringes (ONCE 1ml) and non-pyrogenic needles (Terumo Neolus 25G x 5/8″; 0.5 x 16mm, Terumo Europe N.V., Belgium).
Calibration curve
y = 92.36x - 12.629 R2 = 0.98 0 50 100 150 200 250 300 350 400 450 0 1 2 3 4 5Feed (g)
B
a
ll
o
ti
n
is
(
n
º)
Fig. 6- Withdrawing blood
(Benjamím Costas courtesy)
A heparin solution (1000U/mL; grade I-A: from porcine intestinal mucosa; Sigma- Aldrich, Germany) was prepared in NaCl 0.9% and used as anticoagulant in the syringes and needles. The blood collection lasted less than 3 minutes to avoid a cortisol increase due to manipulation during sampling.
After sampling, blood was centrifuged in a HERMLE centrifuge (Z 233 M-2) with HERMLE rotor (220.87 VO 5/6) at 1500G during 8 minutes at room temperature. Plasma was removed with micropipettes and stored in micro-tubes. Samples were stored at -80ºC until further analysis.
2.1.3.3.1 Cortisol analysis
Plasma cortisol levels were measured with a commercially available competitive binding Coat-A-Count
®
cortisol kit (SIEMENS Medical Solutions Diagnostics, Los Angeles, CA, USA) as described by (Irwin et al., 1999a). Briefly, 50 µl of each sample to be assayed was pipetted into an Ab-Coated tube and 1 ml of 125I Cortisol added. The tubes were then incubated for 45 min at 37 ºC in a water bath. The contents of all tubes were decanted, and allowed to drain for 5 min before being read on a gamma counter (2470 WIZARD/2 _TM , PerkinElmer, Turku, Finland) for 1 min. A calibration curve was constructed on logit-log graph paper and used to convert results from percent binding cortisol to concentration (ng/ml).2.1.3.4. Respirometry
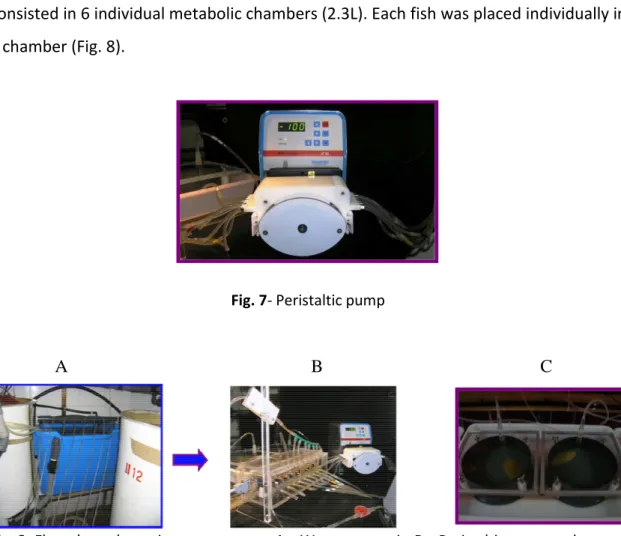
Oxygen consumption of individual Sole juveniles was determined by flow-through respirometry. The saturation level of oxygen was maintained in the water reservoir and a peristaltic pump (ISMATEC, model ISM920A, Switzerland) (Fig. 7), controlled the water flow of each chamber. The flow-through respirometry system consisted in 6 individual metabolic chambers (2.3L). Each fish was placed individually in a chamber (Fig. 8).
Fig. 7- Peristaltic pump
Fig. 8- Flow-through respirometry system. A – Water reservoir; B – Peristaltic pump and
magnetic valve system; C – Respirometry chambers
Each chamber had a water inlet and water outlet. Water inlet was always at oxygen saturation level and oxygen concentration at outlet was measured by a Poligraphic microelectrode model 8-730 (Microelectrodes Inc., USA). Each respirometry trial consisted in measurements from all the chambers. The magnetic valves determined in which chamber the oxygen consumption was being measured (Fig. 9). This was controlled by a PC using the Oxilogger 2009 software (João Reis, CCMAR, Faro, Portugal) which also registered the microelectrode measurements.
At the beginning of each cycle the oxygen dissolved in water was measured during a 30 seconds period in order to calibrate the software. This calibration was followed by a 120 seconds washing step of seawater from the next chamber be
start of the measurement period (30 sec). This step was always done before and after the measurement of each chamber. The data was collected through a dynamic mean of 6 measurements (5 sec each) during a total period of 30 sec. A complete cycle of measurements was done during an 18 minutes period, and comprised the calibration of the oxygen probe, a washing step, measurement of dissolved oxygen in the water chamber, washing step, and so forth for a total of six chambers. The water temperature was always measured in the outlet water of each chamber by a temperature probe.
Fig. 9- Flow-through respirometry system. Water inlet (A) and outlet (B), magnetic valves
The individual measurements
juveniles were monitored in 6 chambers containing one fish each. Measurements were taken in all the three distinct phases (Fasted, Fed and Emersion). Oxygen consumption was measured before the meal except in the Fed
C
At the beginning of each cycle the oxygen dissolved in water was measured during a 30 seconds period in order to calibrate the software. This calibration was followed by a 120 seconds washing step of seawater from the next chamber be
start of the measurement period (30 sec). This step was always done before and after the measurement of each chamber. The data was collected through a dynamic mean of 6 measurements (5 sec each) during a total period of 30 sec. A complete cycle of measurements was done during an 18 minutes period, and comprised the calibration of the oxygen probe, a washing step, measurement of dissolved oxygen in the water chamber, washing step, and so forth for a total of six chambers. The water lways measured in the outlet water of each chamber by a
through respirometry system. Water inlet (A) and outlet (B), magnetic valves (C) and oxygen microelectrode (D)
The individual measurements of oxygen consumption in Senegalese sole juveniles were monitored in 6 chambers containing one fish each. Measurements were taken in all the three distinct phases (Fasted, Fed and Emersion). Oxygen consumption was measured before the meal except in the Fed group. The Fed group was allowed to
A B
C D
At the beginning of each cycle the oxygen dissolved in water was measured during a 30 seconds period in order to calibrate the software. This calibration was followed by a 120 seconds washing step of seawater from the next chamber before the start of the measurement period (30 sec). This step was always done before and after the measurement of each chamber. The data was collected through a dynamic mean of 6 measurements (5 sec each) during a total period of 30 sec. A complete cycle of measurements was done during an 18 minutes period, and comprised the calibration of the oxygen probe, a washing step, measurement of dissolved oxygen in the water chamber, washing step, and so forth for a total of six chambers. The water lways measured in the outlet water of each chamber by a
through respirometry system. Water inlet (A) and outlet (B), magnetic valves
oxygen consumption in Senegalese sole juveniles were monitored in 6 chambers containing one fish each. Measurements were taken in all the three distinct phases (Fasted, Fed and Emersion). Oxygen consumption group. The Fed group was allowed to
feed for 30 minutes, and after transferred to the metabolic chambers. The oxygen calibration was performed each time a measurement cycle started.
2.2. Data analysis
Nearly three hours of measurements (11 cycles of 30 seconds of measurements per fish) were performed in each trial for quantification of the oxygen consumption in individual Senegalese sole juveniles. All measurements were done in the light phase of the photoperiod. The experimental units used were the mean values for each of the 11 cycles; however the values 15% or more above the mean were excluded from analyses (considered as outliers).
Growth, expressed as relative growth rate (RGR, %/day), was calculated using the formula: (eg-1) x 100, with g = [(ln final weight – ln initial weight)/time] (Ricker, 1958), where, W1 and W2 were the initial and final wet weight, respectively.
Feed intake (% body weight) was analysed by X-ray and expressed by the number of ballotinis per gram of feed.
The results were expressed as mean ± standard deviation (S.D.). Coefficient of variation was calculated as follows: CV = standard deviation / mean x 100.
Data was analyzed by t-test for dependent samples, two-way analysis of variance (ANOVA) and regression using the computer packages STATISTICA.
The level of significance used was P<0.05 for all statistical tests. For regression analysis, P values ranging from 0.05 to 0.15 were considered as showing a trend.
3. RESULTS
3.1. Individual variation in growth performance
At the beginning of the experiment,
senegalensis) juveniles had 18.49
significantly superior (t- test, P < 0.001
Fig. 10-Individual wet weigh (WW) (A) and relative growth rate (RGR) (B) juveniles during the 163 days of the experiment (n = 12).
-2.00
-1.00
0.00
1.00
2.00
3.00
4.00
0
40
R
G
R
(
%
/
d
a
y
)
AAA
AAV
AVA
RRR
B
A
3.1. Individual variation in growth performance
he beginning of the experiment, the Senegalese sole ( ) juveniles had 18.49 ± 2.94g of wet weight, the mean weight
test, P < 0.001) by about two-fold to final body weight
Individual wet weigh (WW) (A) and relative growth rate (RGR) (B) of Senegalese sole juveniles during the 163 days of the experiment (n = 12).
40
80
120
Days
VAA
RAA
VVV
RRA
RRV
VRR
the Senegalese sole (Solea mean weight was final body weight
of Senegalese sole
RGR
160
VVA
VVR
48.45 ± 10.64g. The comparison of performance data, growth and relative growth rate (RGR), during the 163 days of the experiment is present in Fig.10.
The mean weight of Sole juveniles were between 27.68 ± 10.82g, at the end of the Undisturbed part of the experiment at day 59; 39.37 ± 8.53g at the end of the “Fasted” phase at day 113; 44.52 ± 10.04g at the end of the “Fed” phase at day 134 and 47.87 ± 10.34g at the end of the “Emersion Stress” phase at day 163 of the experiment. The comparison between the different experimental periods (Undisturbed, Fasted, Fed and Emersion Stress) revealed an increase in mean sole weight during the experiment, despite some variations (Fig.10).
Over the experimental period, fish showed a high variation in relative growth rate (RGR). The mean RGR (%/day) values ranged from 1.167 ± 0.149% during the Undisturbed part of the experiment (days 0-59), 0.144 ± 0.426% during the Fasted phase (days 59-113), 0.745 ± 0.954 during the Fed phase (days 113-134), and 0.055 ± 0.215 during the Emersion Stress phase (days 134-163). The RGR were considerably elevated in the undisturbed phase compared with the other phases. In the Emersion Stress phase the RGR showed a low mean.
Fig. 11- Mean (±SD) wet weight (WW) of Senegalese sole juveniles at the end of the different phases of the
experiment (n = 12).
Growth
0 10 20 30 40 50 60 70Undisturbed Fasted Fed Emersion
Phases
W
e
t
W
e
ig
h
(
g
)
The individual variation in weight during the repeated handling period lead to CVs of 21.66%; 22.56% and 21.56%, in Fasted, Fed and Emersion Stress phases, respectively. During the undisturbed part of the experiment the CV was 30.08%.
The RGR of individual fish during the experiment was analyzed in two distinct parts. The first undisturbed part of the experiment before de handling at day 59 indicates the growth potential without chronic stress. The second part of the experiment, with repeated handling until day 163, represents growth with possible chronic stress conditions (Table 1).
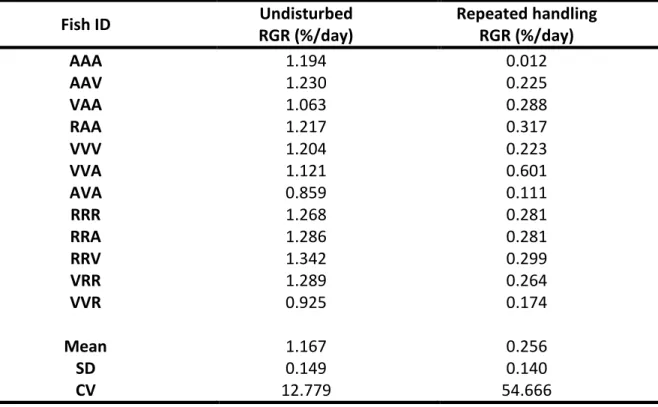
Table 1 – Senegalese sole juveniles Relative growth rate (RGR, %/day) during the Undisturbed and Repeated handling parts of the experiment.
Fish ID Undisturbed RGR (%/day) Repeated handling RGR (%/day) AAA 1.194 0.012 AAV 1.230 0.225 VAA 1.063 0.288 RAA 1.217 0.317 VVV 1.204 0.223 VVA 1.121 0.601 AVA 0.859 0.111 RRR 1.268 0.281 RRA 1.286 0.281 RRV 1.342 0.299 VRR 1.289 0.264 VVR 0.925 0.174 Mean 1.167 0.256 SD 0.149 0.140 CV 12.779 54.666
In the beginning of the experiment (Undisturbed phase) the fish had a mean RGR of 1.167 ± 0.149 %/day, however during the Repeated handling phase the mean RGR was significantly reduced (t- test, P < 0.001) by about five-fold to 0.256 ± 0.140 %/day (Table. 1).
3.2. Individual variation in oxygen consumption
3.2.1. Oxygen consumption in fasted fish
Mean oxygen consumption on fasted fish in the Trial 1, Trial 2 and Trial 3 was respectively around 186.9 ± 14.3, 188.4 ± 17.9, 241.3 ± 15.4 µmol O2/g/h. In
every trial the mean oxygen consumption in fasted fish was significantly different (ANOVA two-way, P < 0.001). The CV was 8.018% Trial 1, 9.311% Trial 2 and 6.849% Trial 3. Fish VVA had the maximum mean oxygen consumption (327.7µmolO2/g/h) Trial 1, whereas fish AAV had the minimum mean oxygen
Fig.12- Relative growth rate (RGR, %/day) of individual Senegalese sole juveniles during the
Undisturbed part of the (until day 59) and during the Repeated handling part (days 59 to 163) (n=12) 0,00 0,20 0,40 0,60 0,80 1,00 1,20 1,40 1,60
Undisturbed
Repeated handling
R
G
R
(
%
/
d
a
y
)
RGR
AAA AAV VAA RAA VVV VVA AVA RRR RRA RRV VRR VVR
consumption (121.8µmolO2/g/h). In Trial 2 fish RRR had the maximum mean
oxygen consumption (266.8µmolO2/g/h), and fish VVR the minimum mean
oxygen consumption (108.0µmolO2/g/h), while in Trial 3 fish VRR had the
maximum mean oxygen consumption (447.4µmolO2/g/h), and fish VVV the
minimum mean oxygen consumption (146.2µmolO2/g/h).
A significant effect on oxygen consumption (ANOVA two-way, P < 0.001) was observed between individuals and also for the interaction individuals x trials (Fig. 13).
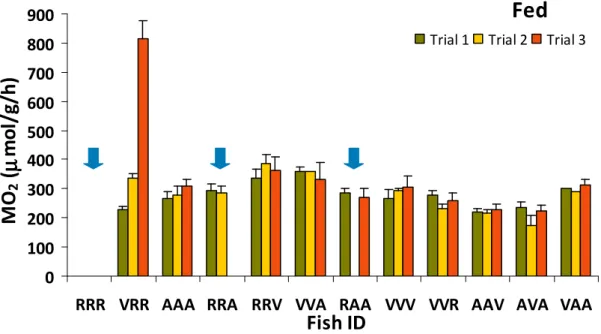
3.2.2. Oxygen consumption in fed fish
Mean oxygen consumption on fed fish in the Trial 1, Trial 2 and Trial 3 was respectively 279.6 ± 20.7, 284.5 ± 23.1, 341.0 ± 34.6 µmol O2/g/h (Fig. 14). In
every trial the mean oxygen consumption in fed fish was significantly different (ANOVA two-way, P < 0.001). The CV was 7.499% Trial 1, 8.050% Trial 2 and 10.42% Trial 3. Fish VVA had the maximum mean oxygen consumption
Fig. 13- Individual measurements of oxygen consumption (µmol O2/g/h) in Senegalese sole
juveniles during the Fasted phase at days 85, 106 and 113 (n =11).
Fasted
0 100 200 300 400 500 600 700 800 900RRR VRR AAA RRA RRV VVA RAA VVV VVR AAV AVA VAA
Fish ID
M
O
2(
µµµµ
m
o
l/
g
/h
)
(359.7µmolO2/g/h) Trial 1, whereas fish AAV had the minimum mean oxygen
consumption (221.7µmolO2/g/h). In Trial 2 fish RRV had the maximum mean
oxygen consumption (285.2µmolO2/g/h), and fish AVA the minimum mean
oxygen consumption (174.7µmolO2/g/h), while in Trial 3 fish VRR had the
maximum mean oxygen consumption (813.5µmolO2/g/h), and fish AVA the
minimum mean oxygen consumption (224.8µmolO2/g/h).
A significant effect on oxygen consumption (ANOVA two-way, P < 0.001) was observed between individuals and also for the interaction individuals x trials (Fig. 14).
3.2.3. Oxygen consumption in fish after Emersion stress
The mean results obtained for oxygen consumption in the two trials were 280.6 ± 28.2 µmol O2/g/h in Trial 1 and 261.2 ± 25.2 µmol O2/g/h in Trial 2 (Fig.
15). The CV in the Trials 1 and 2 was 10.18% and 9.79%, respectively. Fish VVA
Fig. 14 -Individual measurements of oxygen consumption (µmol O2/g/h) in Senegalese sole
juveniles during the Fed phase at days 120, 127 and 134 (n =11). Fish that did not consume feed, during all trials (RRR) or in one trial (RRA and RAA) were removed from the remaining data analysis and are indicated with the blue arrows.
Fed
0 100 200 300 400 500 600 700 800 900RRR VRR AAA RRA RRV VVA RAA VVV VVR AAV AVA VAA
Fish ID
M
O
2(
µµµµ
m
o
l/
g
/h
)
had the maximum mean oxygen consumption (376.7µmolO2/g/h) Trial 1,
whereas fish AVA had the minimum mean oxygen consumption (186.8µmolO2/g/h). In Trial 2 fish RRV had the maximum mean oxygen
consumption (347.3µmolO2/g/h), and fish VVR the minimum mean oxygen
consumption (193.2µmolO2/g/h).
A significant effect on oxygen consumption (ANOVA two-way, P < 0.001) was observed between individuals and also for the interaction individuals x trials (Fig. 15).
3.2.4. Comparison of oxygen consumption in different conditions
During the Fasted conditions the mean result obtained for oxygen consumption was 205.5 ± 15.9 µmol O2/g/h and CV was 8.059%. During the Fed
conditions the mean result obtained for oxygen consumption increased to
Fig. 15-Individual measurements of oxygen consumption (µmol O2/g/h) in Senegalese sole
juveniles during the Emersion stress phase at days 142 and 163 (n =11).
Emersion Stress
0 100 200 300 400 500 600 700 800 900RRR VRR AAA RRA RRV VVA RAA VVV VVR AAV AVA VAA
Fish ID
M
O
2(
µµµµ
m
o
l/
g
/h
)
Trial 1 Trial 2299.9± 25.9 µmol O2/g/h, while CV was 8.637 %. The mean result obtained for
oxygen consumption per fish in the Emersion stress phase was 270.9 ± 26.7µmol O2/g/h and CV was 19.98%.
A significantly difference in oxygen consumption (two-way ANOVA, P < 0.001) between the Fasted and Fed phase was observed (Fig. 16). However, no differences were observed in two fish (Newman-Keuls test) in fish AAV, P= 0.109 and in the fish VVR, P = 0.167 (appendix). Comparing the Fasted and Emersion stress phases there was also a significant difference (two-way ANOVA, P < 0.001). However, no difference was observed (Newman-Keuls test) in fish RRR, P= 0.300. It be emphasised that values observed for oxygen consumption in the Fasted phase were always higher for the Emersion stress phase with the exception of one fish (VVR).
Fig. 16- Individual measurements of Senegalese sole juveniles (n=11) oxygen consumption (µmol O2/g/h) during the three distinct phases of the experiment (Fasted, Fed and Emersion Stress) 163
days. Fish that did not have food intake, during all trials (RRR) in the phase Fed were removed from the data analysis and are indicated with the blue arrow. The fish were no significant differences were detected are indicated with the brown star.
0 100 200 300 400 500 600 700 800 900
RRR VRR AAA RRA RRV VVA RAA VVV VVR AAV AVA VAA
Fish ID
M
O
2(
µµµµ
m
o
l/
g
/h
)
3.2. Feed intake
During this experiment no variation was observed for feed-intake at days 120, 127 and 134 (one-way ANOVA, P = 0.322). The feed-intake in the Trial 1, Trial 2 and Trial 3 was respectively 1.195 ± 0.390, 1.078 ± 0.404, 0.712 ± 0.396 % of fish body weight. The CV was 32.58% Trial 1, 37.51% Trial 2 and 55.26% Trial 3 (appendix). Individual variation in feed-intake ranged between 0.392% and 1.892% of fish body weight. Fish (RRR) was removed from data analysis because did not consume any feed.
Fig. 17- Individual measurements of feed-intake (% of fish body weight) in Senegalese sole
juveniles during the Fed phase at days 120, 127 and 134. Fish that did not had food intake, during all trials (RRR) or in one trial (RRA and RAA) were removed from the data analysis and are indicated with the blue arrows.
0,0% 0,5% 1,0% 1,5% 2,0% 2,5% 3,0%
RRR VRR AAA RRA RRV VVA RAA VVV VVR AAV AVA VAA
Fe e d -i n ta ke ( % o f fi sh b o d y w e ig h t)