Faculdade de Farmácia
A continuous manufacturing model for the
production of granules by roller compaction
Rute Sofia Fonseca Cordeiro Dias
Dissertation to obtain the Master of Science Degree in
Pharmaceutical Engineering
Work supervised by:
Professor João Almeida Lopes (Supervisor)
Professor Ossi Korhonen (Co-Supervisor)
manufacturing line (University of Eastern Finland, School of Pharmacy,
Kuopio, Finland). All the facilities, equipments, materials and support
were gently provided by
i
Abstract
Continuous manufacturing is an encouraging and a sustaining innovation in pharmaceutical manufacturing, build upon quality-by-design principles, with a huge potential to improve agility, flexibility and robustness to the manufacturing process. In this field, the Roller Compaction (RC) process plays an important role since it enables continuous dry granulation of powders. Here, the powder is densified by two counter-rotating rolls that produce a ribbon. Then, the ribbon is milled into granules, adequate for tableting or capsule filling. RC overcomes granulation problems with thermolabile moisture or solvents sensitive compounds.
In this work, an experimental design was performed in order to identify the critical process parameters (CPP) and evaluate their impact on the critical quality attributes (QCA) of granules produced by RC. The roller compactor used was the Hosokawa Bepex Pharmapaktor® L200/30P, with a Flake Crusher FC 200. The RC process was monitored by a near infrared (NIR) system and a direct imaging analyzer for granules’s size (Eyecon).
For the DoE the CPP’s proposed and their respective range were: compression force (15-35 kN), roller speed (3-8 rpm) and mill speed (50-250 rpm). The produced granules were characterized according to their particle size, as well as their bulk and tapped density – granules’ CQA’s.
All process variables were kept constant 2 minutes after the process onset. The compression force fluctuated throughout the process run time. The compression force was the variable that most affected the granules’ CQA’s: the size and the density of the granules are directly proportional to the compression force.
The Eyecon´s measurements exhibited significant deviations when compared with the gold standard method, thus it was not an accurate method for monitoring the granules’ size.
Two approaches were followed for the prediction of granules’ physical properties. The first model, that used partial least squares to predict the granules’ size, was built upon near infrared data. It returned a high RMSEP (50.54 μm) and a poor coefficient of determination for the prediction set (0.19), so it was not acceptable for the prediction of the granules’ size. The second approach considered process parameters data to predict the bulk density, tapped density and size of the granules. One partial least squares model was built to predict
ii each response. The coefficient of determination for the prediction set was high for the three models (0.93 for granules’ size, 0.95 for tapped density and 0.96 for bulk density) demonstrating a good prediction ability.
Key words: Continuous Manufacturing; Critical Process Parameters; Near-infrared Spectroscopy; Partial Least Squares; Roller Compaction.
iii
Resumo
A produção contínua no contexto da indústria farmacêutica surge da contínua demanda pela produção de medicamentos de alta qualidade combinada com formas mais eficazes de avaliação da qualidade. Ao contrário da produção em “lote”, na produção contínua as matérias-primas entram e saem continuamente ao longo do ciclo de produção. Com efeito, as vantagens da adoção do processo em contínuo são diversas e podem resumir-se em três áreas fundamentais: controlo de qualidade e desenvolvimento do produto/processo, custos e área de produção.
O projeto de produção em contínuo pode ser apoiado nos princípios definidos pelo “quality-by-design”, desde o início do desenvolvimento do produto até à sua entrada no mercado. Portanto, a qualidade é erigida por desenho e não apenas avaliada no produto final. Para isso, realizam-se delineamentos experimentais para perceber de que forma os parâmetros críticos do processo (CPP’s) influenciam as respostas do processo. As tecnologias analíticas de process são ferramentas fundamentais de monitorização que fornecem dados do produto e do processo em tempo real. Estes dados alimentam os modelos multivariados, os quais não só fornecem informações para a compreensão do processo como também estão na base da construção dos modelos de controlo. Os controlos estão aptos a detetar anomalias no processo e a ajustar os CPP’s de forma a garantir que os atributos críticos de qualidade (CQA’s) do produto cumprem as especificações.
Por outro lado, no processo contínuo, os equipamentos são de menores dimensões, já que operam em contínuo. Por conseguinte, a área de produção requer igualmente menores dimensões, pelo reduzido tamanho dos equipamentos, pela ausência de salas de quarentena e de operações intermediárias. Deste modo se depreende uma significativa redução de custos pela redução de recursos humanos, pela redução de gastos com equipamentos de grande escala, pelo menor consumo energético, pela redução de desperdícios com produtos fora de especificação e pela redução no tempo de chegada de novos produtos ao mercado.
A granulação é uma operação unitária com vista à obtenção de grânulos, aplicados tanto na sua forma intermediária para a produção de comprimidos, quanto na sua forma farmacêutica final. A granulação a seco operada num compactador de rolos é, em si, um processo
iv contínuo que permite processar compostos termolábeis e passíveis de degradação pela humidade e por solventes.
O processo de compactação por rolos inicia-se pela introdução da mistura de pó no granulador, através de uma tremonha de alimentação. As partículas de pó ao chegarem à zona de alimentação sofrem um rearranjo e densificam, devido à pressão exercida pelo parafuso rotativo no sentido descendente e ao afunilamento desta zona, a qual se prolonga na seguinte. A mistura de pós é então forçada a continuar pela zona de compressão, onde numa primeira fase, devido à pressão exercida sobre as partículas, ocorre deformação ou quebra das mesmas. À medida que as partículas avançam nesta zona, a força de compressão aumenta até que ao atingirem o termo da zona, a força de compressão exercida pelos dois rolos em contra-rotação provoca a fragmentação das partículas e, logo em seguida, a sua ligação até formarem fitas compactas. Por fim, as fitas são expelidas pelos rolos, cortadas e moídas, de modo a formarem grânulos.
O NIR é uma ferramenta PAT que devido ao facto de a interação da radiação com a matéria ocorrer na região de 780-2500 nm, permite uma interação direta com a amostra sem causar a sua destruição. O NIR tem a capacidade de monitorizar o processo em tempo real, fornecendo dados para a construção de modelos multivariados. O modelo PCA ao desvendar as combinações de variáveis que descrevem a maior tendência nos dados, fornece informações sobre o “comportamento” de todo o processo. O modelo PLS é utilizado para prever as propriedades do produto final.
Este trabalho pretendeu identificar os atributos críticos do processo responsáveis pelas alterações nos atributos críticos de qualidade dos grânulos. Além disso, procurou estimar as propriedades dos grânulos (tamanho e densidade) com base em dados espetrais e dados do processo.
Este trabalho foi realizado utilizando a Linha de produção contínua de comprimidos do PROMIS Centre (University of Eastern Finland, School of Pharmacy) em Kuopio, Finlândia. Neste trabalho, recorreu-se a alimentadores gravimétricos, um misturador contínuo e um compactador por rolos (Hosokawa Bepex Pharmapaktor® L200/30P, FC 200). A monitorização do processo foi seguida em linha por um sistema de infravermelho próximo (Specim RHNIR, Spectral Imaging Ltd, Oulu, Finland) e por um medidor do tamanho de partículas (EyeconTM, Innopharma Labs, Dublin, Ireland). A densidade dos grânulos foi medida por deslocamento do volume dentro de uma proveta e o tamanho dos grânulos foi medido num equipamento por dispersão de luz (método padrão).
v A relação entre os possíveis CPP’s e os CQA’s dos grânulos foi estabelecida através de um delineamento experimental, onde o a velocidade dos rolos variou de 3 rpm a 8 rpm, a força de compressão variou de 15 kN a 35 kN e a velocidade do moinho variou de 50 a 250 rpm. Considerou-se a densidade (areada e batida) e a dimensão dos grânulos como CQA’s. O processo foi monitorizado por infra-vermelho próximo tendo os espetros adquiridos sido processados para remoção de variabilidade de linha de base e escala. A identificação de espetros atípicos (ou outliers) e a trajetória do processo de acordo com a informação espetral foi avaliada através de modelos de análise de componentes principais, esta última através do primeiro componente principal.
A velocidade do parafuso alimentador, a velocidade dos rolos e a velocidade do moinho estabilizaram cerca de 2 minutos após o início do processo. A força de compressão variou sempre ao longo de todo o processo, independentemente da força de compressão alvo. A densidade dos grânulos aumentou (ex. areada, 0,62 g/ml – 0,64 g/ml ) com o aumento da força de compressão (35 kN) e diminuiu (ex. areada, 0,54 g/ml – 0,55 g/ml) com a diminuição da força de compressão (15 kN). O valor intermédio de força de compressão (25 kN) originou grânulos com densidade intermédia (ex. areada, 0,58 g/ml – 0,60 g/ml).
O tamanho dos grânulos foi influenciado sobretudo pela força de compressão. Assim, quanto maior a força de compressão aplicada, maior o tamanho dos grânulos (ex. 1009 μm); e quanto menor a força de compressão aplicada, menor o tamanho dos grânulos (700 μm). A aplicação de uma força de compressão intermédia produziu grânulos de dimensão intermédia entre as duas anteriores (881 μm).
Na medição da dimensão das partículas, o método por análise de imagem revelou um desvio significativo em relação ao método por dispersão de luz (método padrão), não constituindo por isso um método preciso para a monitorização em linha do tamanho dos grânulos.
Foram construídos dois modelos de regressão multivariada baseados em mínimos quadrados parciais para prever a densidade e a dimensão dos grânulos. O primeiro modelo, construído com os dados NIR, teve o intuito de prever a dimensão dos grânulos. Uma vez que o modelo apresentou um RMSEP elevado (50.5 μm) e um um coeficiente determinação de previsão muito baixo (0.19), considerou-se que este modelo não é aceitável para a previsão do tamanho dos grânulos.
A segunda abordagem de regressão utilizou os parâmetros do processo para prever as respostas do processo. Foram modeladas a densidade areada (BD), a densidade batida
vi (TD) e a dimensão dos grânulos (GS). Pela análise estatística dos modelos, os coeficentes de determinação de previsão foram: 0,89 para GS, 0,90 para TD e 0,91 para BD. Estes, indicam uma boa capacidade de previsão das respetivas respostas. Cada um dos modelos demonstrou, também, que a força de compressão foi a variável que mais influenciou, e de forma positiva, tanto a densidade como a dimensão dos grânulos.
Palavras-chave: Compactação por Rolos; Espetroscopia de Infravermelho próximo; Granulação; Quimiometria; Produção Contínua.
vii
Acknowledgements
I would first like to thank Prof. Ossi Korhonen, for the privilege and the wonderful opportunity to work with his team. I also thank him for always support my work in time with patience and wisdom. A great thank to Prof. Jarkko Ketolainen for allowing my internship at School of Pharmacy, University of Eastern Finland.
I would also like to thank Anssi-Pekka Karttunen for the good environment we had in the Lab, for the positive discussions concerning the Lab work and for all support on the thesis writing. I am deeply grateful to Prof. João Almeida Lopes for providing the opportunity to develop the experimental work at University of Eastern Finland. Besides, I am also grateful for all I have learned from his experience and knowledge and for his valuable support on this thesis. Special thanks to André Canas for all we have learned together, for all the support during the internship and for our friendship.
I would also like to acknowledge my friends Sara Ramos, Joana Oliveira, Sofia Correia, Raquel Chaves, Pedro Molero, André Glória and Miguel Vieira for unfailing support and continuous encouragement throughout this internship.
Last but not the least, I would like to thank my family for the unconditional support and encouragement throughout my years of study and through the process of researching and writing this thesis.
viii
Contents
Abstract ... i Resumo ... iii Acknowledgements ... vii Contents ... viii List of figures ... xList of tables ... xii
List of abbreviations ... xiii
Chapter 1 ... 1 Motivation ... 1 Chapter 2 ... 2 Objectives ... 2 Chapter 3 ... 3 Introduction ... 3 3.1 Continuous manufacturing ... 3 3.2 Roller compaction ...11
3.3 Process monitoring tools ...20
Chapter 4 ...23
Materials and methods ...23
4.1 The continuous manufacturing line ...23
4.2 Equipment ...25
4.3 Raw materials...32
4.4 Methods ...35
Chapter 5 ...40
Results and discussion ...40
ix
5.2 Analysis of process variables ...44
5.3 Analysis of the granules ...49
5.4 Predictive models ...63
Chapter 6 ...74
Conclusions ...74
Future perspectives ...76
x
List of figures
Figure 1 – The integrated continuous manufacturing process concept versus the more widely adopted batch
processing concept. (Adapted from (1)) ... 4
Figure 2 – Representation of compaction zone with horizontal rolls, inside the roller compactor. (1) Feed Zone; (2) Compaction Zone (Nip zone + Grip Zone); (3) Extrusion Zone. (Adapted from (33)) ... 13
Figure 3 – Feeder orientations. (a) Vertical, straight; (b) Inclined; (c) Vertical, tapered; (d) Horizontal. (Adapted from (30)) ... 14
Figure 4 – Roll orientations. (A) Horizontal; (B) Inclined; (C) Vertical. (Adapted from (30)) ... 15
Figure 5 – Roll surface. (a) Smooth roller; (b) Corrugated; (c) Fluted. (Adapted from (30)) ... 15
Figure 6 – Main components of an off-line NIR instrument. (a) radiation source; (b) sample–radiation interaction device; (c) wavelength selector; (d) detector; (e) data collector, processing, storing and control device. (Adapted from (66)) ... 20
Figure 7 – Depiction of complete continuous line.A – powder loss in weight feeders; B – continuous mixer; C – roller compactor; D – screw conveyor; E – vacuum conveyor; F– tableting machine. (Adapted from (74)) ... 23
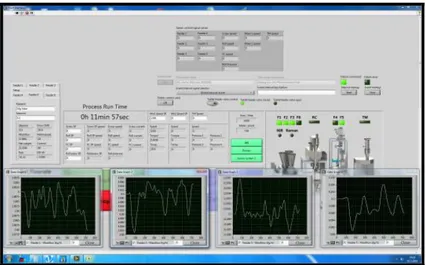
Figure 8 - Labview control software interface: monitoring of the powder mixture. ... 25
Figure 9 – Labview control software interface: monitoring of the compaction force. ... 25
Figure 10 – Assembly of the four LIW feeders that feed the mixer. ... 26
Figure 11 – Continuous mixer disassembly. On the left: mixer bladed shaft; on the right: the mixer outlet. ... 27
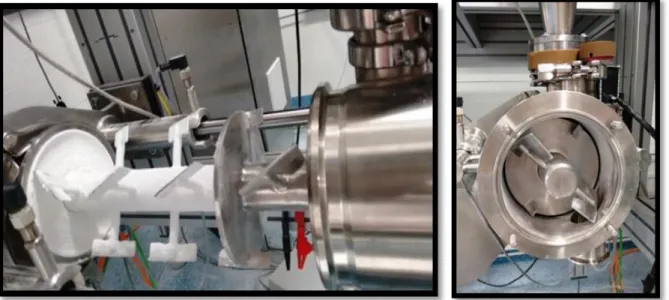
Figure 12 – RC Hosokawa Pharmapaktor L200/30P. On the top left: RC prepared to operate; on the top right: detail of the vertical srew; bottom, on the bottom: detail of the milling screen. ... 28
Figure 13 – The RC rollers. On the top: the two disassembled rollers of 25 Kg each; on the bottom: top view of the two horizontal assembled rollers showing the fixed gap between them. ... 29
Figure 14 – The compaction system. A) The force transducer. B) The Hexagonal nut on the right roller arm. C) The roller shoulder. The force transducer measures the pressing force between the rollers. The hexagonal nut is tightened to increase the pre-pressing force or is loosened to reduce the pre-pressing force. The roller shoulder fixes the rollers and is connected to the roller arms by eye bolts... 29
Figure 15 – The NIR monitoring system. On the left: the NIR sphere with the 6 optic fibers; at the centre: the spectral camera and the laptop with control software; on the right: the tungsten lamp, used as light source. ... 30
Figure 16 – Configuration of the NIR sphere and Eyecon to on-line monitoring of the granules. On the top left: the NIR sphere attached to the outlet of the RC and the glass frame through which Eyecon collects images of the granules; on the top right and on the bottom: Eyecon capturing granules’ images. ... 31
Figure 17 – Malvern Mastersizer 2000, with Scirocco Unit (on the left) and Hydro Unit (on the right). (Adapted from (76)) ... 32
Figure 18 – Particle size distribution (PSD) of raw materials. ... 34
Figure 19 – On the left: the RC assembled and coupled with the monitoring tools; on the right: detail of how the both NIR and Eyecon systems were assembled to collect the samples. ... 37
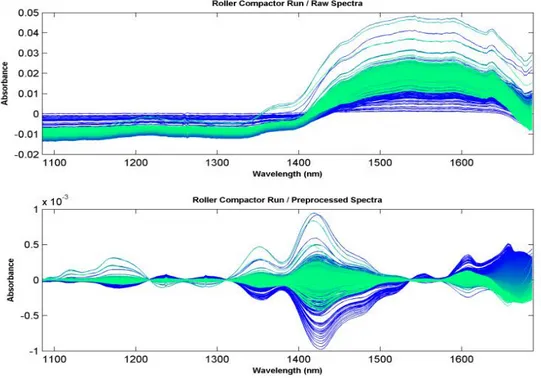
Figure 20 – The NIR spectra for the run N1. On the top: raw spectra; on the bottom: spectra pre-processed with first derivative. ... 41
Figure 21 – The score plot for run N1, depicting PC 1 versus PC 2. The total variance captured by both components is 99.04%. The ellipse’s border represents the 95% confidence limit... 42
Figure 22 – The statistic plot for run N1, depicting Hotelling’s T2 statistic versus Q statistic. The dotted lines represent the 95% confidence limit for both Hotelling’s T2 statistic (horizontal dotted line) and Q statistic (vertical dotted line). ... 43
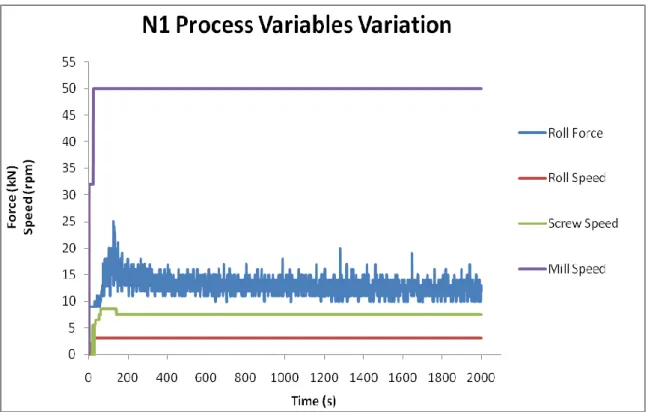
Figure 23 – Process Variables Variation for Run N1. The target compression force was the lowest of the DoE (15 kN). After about 2,5 min all process variables reached their target values, except the compression force, which fluctuation lasted until the end of the run. The Mill Speed stabilized at 24 s, Roll Speed at 28 s and Screw Speed at 140 s. ... 46
Figure 24 – Compression force fluctuation showing the roll force mean line. The mean value stood below the target, at 13 kN-14 kN. The target of 15 kN was reached at about 154 s. After that the compression force varied between 10 kN (645 s, 1030 s,…) and 20 kN (1281 s). ... 46
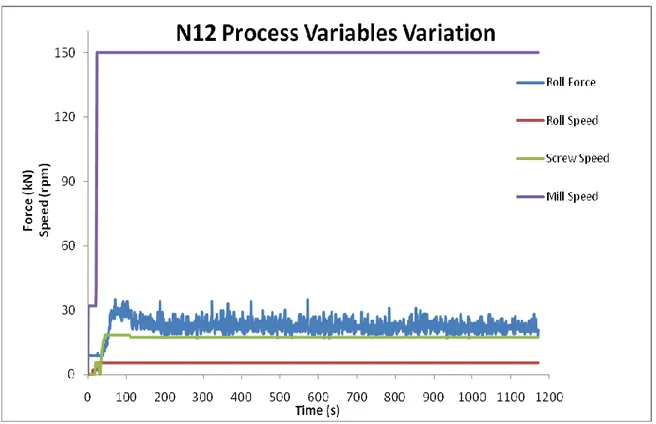
Figure 25 – Process Variables Variation for Run N12. The target compression force was the highest of the DoE (25 kN). After about 2,2 min all process variables reached their target values, except the compression force, which fluctuation lasted until the end of the run. The Mill Speed stabilized at 24 s, Roll Speed at 21 s and Screw Speed at 110 s. ... 47
Figure 26 – Compression force fluctuation showing the roll force mean line. The mean value stood below the target, at 22 kN-24 kN. The target of 25 kN was reached at about 131 s. After that the compression force varied between 17 kN (285 s, 992 s,…) and 35 kN (572 s). ... 47 Figure 27 – Process Variables Variation for Run N4. The target compression force was the intermediate value of the DoE (35 kN). After about 2 min all process variables reached their target values, except the compression
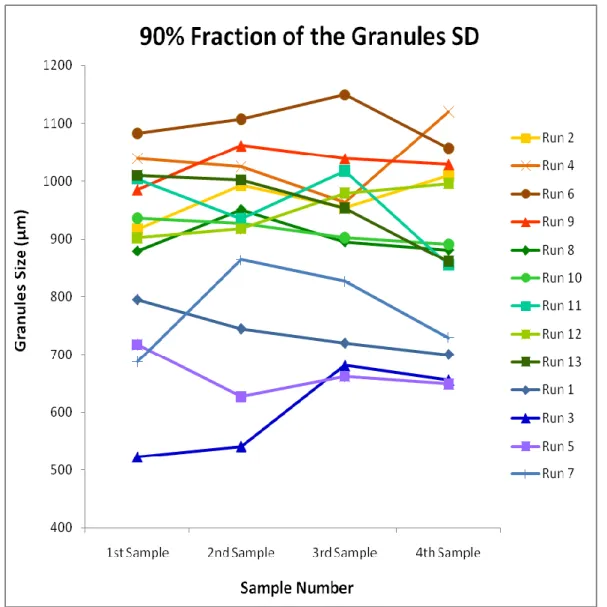
xi force, which fluctuation lasted until the end of the run. The Mill Speed stabilized at 15 s, Roll Speed at 24 s and Screw Speed at 118s. ... 48 Figure 28 – Compression force fluctuation showing the roll force mean line. The mean value stood close to the target, at 34 kN-36 kN. The target of 35 kN was reached at about 120 s. After that the compression force varied between 27 kN (276 s, 556 s,…) and 44 kN (388 s). ... 48 Figure 29 – 90 % fraction of the granules size distribution (SD) obtained off-line by light scattering. The runs are ordered from the highest target compression force to the lowest target compression force. ... 51 Figure 30 – 50 % fraction of the granules size distribution (SD) obtained off-line by light scattering. The runs are ordered from the highest target compression force to the lowest target compression force. ... 52 Figure 31 – 10 % fraction of the granules size distribution (SD) obtained off-line by light scattering. The runs are ordered from the highest target compression force to the lowest target compression force. ... 53 Figure 32 – 90 % fraction of the granules size distribution (SD) obtained on-line by direct imaging. The size of each sampling point corresponds to the average of sizes captured by Eyecon during the sampling time settled for each run. The runs are ordered from the highest target compression force to the lowest target compression force. ... 54 Figure 33 – 50 % fraction of the granules size distribution (SD) obtained on-line by direct imaging. The size of each sampling point corresponds to the average of sizes captured by Eyecon during the sampling time settled for each run. The runs are ordered from the highest target compression force to the lowest target compression force. ... 55 Figure 34 – 10 % fraction of the granules size distribution (SD) obtained on-line by direct imaging. The size of each sampling point corresponds to the average of sizes captured by Eyecon during the sampling time settled for each run. The runs are ordered from the highest target compression force to the lowest target compression force. ... 56 Figure 35 – The RSD determined for 90% fraction of the granules size distribution (SD) obtained by Eyecon. .... 57 Figure 36 – The RSD determined for 50% fraction of the granules size distribution (SD) obtained by Eyecon. .... 58 Figure 37 – The RSD determined for 10% fraction of the granules size distribution (SD) obtained by Eyecon. .... 59 Figure 38 – Comparison between off-line and on-line methods for granules’ size measurement. Square Error between the both methods regarding 90% fraction of the granules size distribution (SD). ... 60 Figure 39 – Comparison between off-line and on-line methods for granules’ size measurement. Square Error between the both methods regarding 50% fraction of the granules size distribution (SD). ... 61 Figure 40 – Comparison between off-line and on-line methods for granules’ size measurement. Square Error between the both methods regarding 10% fraction of the granules size distribution (SD). ... 62 Figure 41 – The scores of the calibration set and the test set used in the PLS prediction model. ... 64 Figure 42 – The statistic plot for the PLS model, depicting Hotelling’s T2 statistic versus Q statistic. The dotted blue lines represent the 95% confidence limit for both Hotelling’s T2 statistic (horizontal dotted line) and Q statistic (vertical dotted line). Both the scores of the calibration set and the test set are represented. ... 65 Figure 43 – The observed versus predicted plot for the PLS model. ... 66 Figure 44 – The values of the responses plot against experimental runs. The replicated experiments are shown in blue on the same replicate index and the other experiments in green. ... 68 Figure 45 – Summary of the basic model statistics for every response: R2, Q2, model validity and reproducibility. ... 70 Figure 46 – The coefficient plot depicting the model terms for each response. RolSp, Roll Speed; ComFc, Compression Force; MilSp, Mill Speed. ... 71 Figure 47 – The observed versus predicted plot for each model. Bulk Density: R2=0.96, Q2=0.91; Tapped Density: R2=0.95, Q2=0.90 Granule Size: R2=0.93, Q2=0.89. ... 71 Figure 48 – The score plot for each model, depicting the relationship between the scores (t1) and the responses (u1). ... 72 Figure 49 – The loading plot for each model depicting the first LV against the second LV. BD= Bulk Density; TD= Tapped Density; GrS= Granule Size; RolSp= Roll Speed; MilSp= Mill Speed; ComFc= Compression Force. ... 73 Figure 50 – The residuals of each response versus the normal probability of the distribution. ... 73
xii
List of tables
Table 1 – Description of the equipment used in complete continuous line. ... 24 Table 2 – Some physical properties of the raw materials. ... 33 Table 3 – Design of experiments obtained by Modde. ... 35 Table 4 – Detail of the DoE performed, showing the order by which the experiments were done. The screw speed was adjusted to the roll speed in order to obtain the target compression force. The lag time was the time considered for the variables to stabilize. ... 44 Table 5 – The granules’ densities determined for each run and the process throughput. The table was split in three blocks, according to the target compression force (from the highest compression force, on the top, to the lowest compression force, on the bottom). ... 49 Table 6 – Description of the PLS model to predict granules’ size based on NIR spectra. ... 64 Table 7 – The overview of the factors and the responses used to build the second PLS model. ... 67 Table 8 – Summary of the PLS Model built with the process parameters. BD, Bulk Density; TD, Tapped Density; GS, Granule Size; RS, Roll Speed; CF, Compression Force; MS, Mill Speed. MS, Mean Square; p, probability. 69
xiii
List of abbreviations
ANOVA, Analysis Of Variance
API, Active Pharmaceutical Ingredient BA, Bonding Area
BD, Bulk Density BS, Bonding Strength
cGMPs, Current Good Manufacturing Practises CM, Continuous Manufacturing
CPP, Critical Process Parameters CQA, Critical Quality Attributes DG, Dry Granulation
DoE, Design of Experiment
EMA, European Medicines Agency FDA, Food and Drug Administration LV, Latent Variable
MS, Mean Square
MSPC, Multivariate Statistical Process Control NIR, Near-Infrared
NIRS, Near-Infrared Spectroscopy PC 1, Principal Component 1 PC 2, Principal Component 2 PCA, Principal Component Analysis
xiv PAT, Process Analytical Technology
PLS, Partial Least Square
PMP, Pharmaceutical Manufacturing Process PSD, Particle Size Distribution
QbD, Quality by Design RC, Roller Compactor
RMSECV, Root Mean Square Error of Cross Validation RMSEP, Root Mean Square Error of Prediction
RMT, Raw Materials Traceability RSD, Relative Standard Deviation RTD, Residence Time Distribution RTRT, Real-Time Release Testing SavGol, Savitzky-Golay
SD, Size Distribution SE, Square Error TD, Tapped Density
1
Chapter 1
Motivation
The continuous manufacturing (CM) approach for medicines offers immense benefits over traditional batch processing. Not only because it affords flexibility and economic advantages but also because the higher knowledge-based and control level drives the process straight into the highest quality standards.
A CM line built to produce immediate release tablets has been among the most studied processes in the endeavor for making CM a reality. The roller compaction process plays an important role in this context, since dry granulation is more suitable to CM processes and has known advantages as preserving heat and moisture sensitive compounds, among others. The CM approach for the manufacturing of drug products lays on top of the quality-by-design (QbD) principles, which demand the implementation of process understanding methodologies and requires full adoption of process analytical technologies (PAT). In this context, the widely adopted near-infrared spectroscopy method, as a PAT tool, enables real-time monitoring of the process, feeding process models with frequent and high quality data. Statistical models can be adjusted to deal with these data to monitor and to estimate in real-time drug product properties.
Thus, this work aims at providing knowledge on powder granulation by roller compaction, as a continuous process, to support its future implementation in pharmaceutical industry. The experimental work was performed in the research and development continuous tableting line (PROMIS-line), constructed at the School of Pharmacy of the University of Eastern Finland.
2
Chapter 2
Objectives
This written thesis is the result of the experimental work performed in the PROMIS-line (School of Pharmacy of the University of Eastern Finland).
Therefore, the main objectives of this work are:
1) identify the critical process parameters affecting the critical quality attributes of granules produced by RC;
2) implement an analytical method (near infrared spectroscopy) to monitor in real-time the quality of granules in the RC process;
3) build predictive models for estimating the properties of granules (size and density) from spectral and process data.
3
Chapter 3
Introduction
3.1 Continuous manufacturing
The pharmaceutical manufacturing sector is characterized by a traditional way of manufacturing drug products (batch production), that has been revealed often inefficient at several levels. Thus, the lack of agility, flexibility and robustness in pharmaceutical processes leads to failure in production units which is in the origin of drug shortages, high production costs and waste. Since shortages are mainly related to a supply disruption caused by non-conformities in the quality of whole facility or drug product, regulatory authorities have been looking for promoting the adoption of more scientific mechanistic understanding of processes and methods applied on pharmaceutical industry.(1)(2) This endeavour is among the aims of regulatory authorities, such as Food and Drug Administration (FDA) or the European Medicines Agency (EMA) as they regulate pharmaceutical drug products and promote a flexible pharmaceutical sector that reliably produces high-quality drugs without extensive regulatory oversight.(3)
In general, in a batch process, the raw materials are loaded into the equipment at the beginning and final products are discharged at once, at the end of the process. Nothing comes in and nothing comes out of the equipment during the process run.(1) Some adopted processes are indeed fed-batch as during the production cycle some components are added in a continuous or discrete way.
In contrast, in a continuous process, the materials and products are continuously charged and discharged over time.(1)
So far, a pharmaceutical manufacturing process (PMP) rather consists of a combination of batch and continuous unit operations, such as in a tablet production line, where powder blends are made in batch mode and tablets are produced continuously in a tablet press. The PMP as a whole is globally considered to operate in batch mode.(4)
The future of PMP lies in continuous manufacturing (CM), a breakthrough over the standard batch concept. In CM, single unit operations are all connected together in a logic sequential order – integrated process. Process Analytical Technology (PAT) tools are implemented to
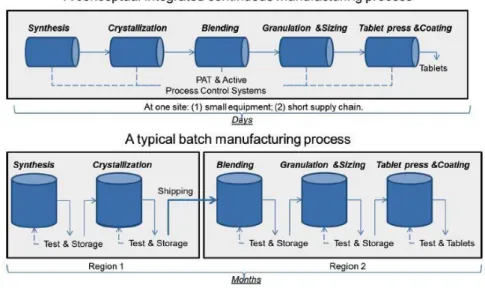
4 provide real-time acquisition data for process monitoring and control. Multivariate analysis is performed to extract information and to gain scientific knowledge about the process. Engineering process control systems are designed to reduce the impact of raw materials and process variability on the quality of drug products.(1) An overview of those two methodologies is represented in Figure 1
Figure 1 – The integrated continuous manufacturing process concept versus the more widely adopted batch processing concept. (Adapted from (1))
Batch manufacturing has been applied for the production of pharmaceutical products since pharmaceutical industry’s fast expansion in 80s.(5) Batch processing requires that samples from one unit operation should be taken according to previously settled in-process controls. Samples are tested off-line and stored, while they wait for quality control approval, and finally they are sent to the next processing step. However, if the in-process product does not meet quality specifications, then it may be discarded, or even reprocessed, before moving to the next process step.(1)
In CM, materials obtained from each process step are sent directly and continuously to the next step until the end of the process. This means that in-process material is produced within quality specification limits, at a given time, straight through the final product.(1) Hence, CM shows up as an integrated system approach built in with a model-based control placed throughout the process flow. CM is, indeed, designed as a whole, so any distinction between upstream and downstream or drug substance and drug product, as currently used, can be eliminated.(5)
Although the aforementioned description is the best known for CM, some authors advocate that the integration of several unit operations into a single line is a mere heterogeneous process, since there´s still significant powder transport challenges, unnecessary process
5 steps and higher risk of process issues. Genuine CM involves “homogeneous processes”, that is, the active-excipient combination is engineered so to have the key properties needed with the view to directly make the final dosage form (e.g. extrusion, spray drying, thin film formation). From this point of view, heterogeneous processes constitute the first step in the transition from batch to homogeneous continuous processing.(5)
3.1.1 Advantages of CM over batch manufacturing
The overall advantages of CM embrace three main fields: 1) product development and quality; 2) costs; and 3) footprint.(6) As these fields are intimately related with each other, their benefic effects are felt as a whole over the CM concept.
CM offers a sort of opportunities to increase flexibility of PMP and to provide high quality drug products. In fact, CM can increase production volume without scale-up concerns, yielding a quicker response capacity. Scale-up deliberations, like process operating time, number of parallel processing lines and flow rate set up are introduced into the process design and control. Besides, the small volumes of raw materials needed to run the CM process allow operating with smaller equipments, thus eliminating scale-up.(7)(4) Hence, CM is able to reduce the costs regarding expensive active pharmaceutical ingredients (APIs) and excipients needed for process development studies and optimization efforts. Also, CM puts forward the streamlining of the whole process by excluding work-up unit operations.(1)(5) Removing scale-up bottlenecks from process development, reduces time to market, enhancing the opportunities to promote fast and efficient clinical development of new drugs.(1)
CM is able to reduce supply chains. As production can be accomplished at different scales, APIs, process intermediates and drug products are manufactured in-place, in a continuous sequence operation, without any further storage or shipping steps. This is a major improvement since removal of hold times between steps assures that sensitive materials are not degraded; in addition, being manufactured in a small scale production line, less risks can be associated with highly energetic or reactive materials. So, CM rises as a more flexible and safe method even when applied to a non-specialized manufacturing facility.(4)(8)
CM is built under the regulatory authorities guidelines regarding quality-by-design (QbD) approach for pharmaceutical development. According to the FDA, QbD is “a systematic approach to development that begins with predefined objectives and emphasizes product and process understanding and process control, based on sound science and quality risk management.”(4,9,10). Over the last decade the International Conference on Harmonisation
6 (ICH) has released a few guidance documents in order to clarify how to implement this new concept. The ICH Q8(R2) – Pharmaceutical Development, ICH Q9 – Quality Risk Management, ICH Q10 – Pharmaceutical Quality System, ICH Q11 –Development and Manufacture of Drug Substances, as well as ICH Quality Implementation Working Group on Q8, Q9, Q10 Questions & Answers (R4) and Points to Consider (R2), documents consist of high-level guidelines concerning the scope, definition and implementation of QbD in pharmaceutical industry.(9)(11–15) A robust process is capable of producing drug products with acceptable quality. However, only through a strategy for process control, can its variability be controlled. Process control aims at achieving variability control by reducing input variation and/or adjusting for input variation during production. Such a strategy should be set up based on product and process understanding. Since PAT enhances process understanding, a forward control strategy can afford real time analysis and control of the output quality.(10) Thus, processes are controlled with robust and advanced process models, leading to a much lower risk of going out of specification, when compared to batch processes.(5)(16)
In short, CM process line is usually more efficient than its traditional batch counterpart. The manufacturing footprint is reduced whereas intermediates flow from one processing step to the other without concerning isolated rooms or dedicated modules. Consequently, CM requires smaller equipment, thus on the one hand reduces both capital and operation expenses and on the other increases throughput.(1)(17)
3.1.2 Challenges and barriers for CM
Despite of the greatest advantages of CM, it hasn´t become, yet, the gold standard for pharmaceutical industry, mainly because of a “business as usual” perspective tied to a highly conservative industry. Firstly, pharmaceutical industry is highly regulated: companies are cautious regarding regulatory aspects of unconventional procedures; companies seek approval for their products worldwide and CM may not be approved by regulators in other different countries. Secondly, it has been found that new manufacturing concepts must be proven both technologically and financially superior and applied to a product before widespread implementation can occur. So, because technologies must be already adopted for the industry to adopt them, the introduction of CM has been rather slow.(5)
However, this is starting to change. Whilst benefits of CM are being perceived by management, more investments are made so that CM is gradually becoming more prevalent. In the meantime, there are some challenges for the implementation of CM:
7
1) Business and organizational. The established batch asset-base, wherein a huge
capital was invested during the 80s and 90s, is a hurdle for introduction of CM. The capital invested in new CM facilities can be compensated by significant savings, once that continuous process monitoring and control assure lower energy consumption, higher production yield and shorter cycle times. Also, CM requires a smaller, highly skilled workforce and a smaller footprint, enabling flexibility in plant settlement in order to meet local demand for diverse products or proximity to R&D centres.(5) It´s foreseen that new therapeutic entities or approved drugs with high market share should be the potential candidates for the introduction of CM.(1)
2) Manufacturing and development. The CM paradigm requires a new mindset
from scientists who develop formulation and process, through quality units within the company, until government regulators supervising the industry. Consequently, engineers, scientists and regulators must have to upskill in statistics to better analyze and understand process data. To reap the benefits of CM, continuous process must be adopted at the earliest possible stage of product development. In addition, to expand CM technologies, a new generation of equipment, sensors and automation have to be developed, as well as system integration in order to let operation units communicate and provide process control.(5)
3) Technical aspects. There are two main tricky situations. One is the development
of accurate process operation models of various steps in a continuous process, together with powder characterization and handling, especially for low-dose production. Another is how to operate start-up and shutdown as fast as possible with minimal waste. Several solutions are being proposed for the first case, whereas for the second one, a smart sequencing of unit operations during start-up and shutdown was suggested to decrease losses. (5)
In CM, intermediate products flow between unit operations and drug products are generated continuously over a certain period of time. In CM, as in any other manufacturing process, process, raw materials, quality and environmental conditions can vary over time and so those variations have to be considered when developing the CM control strategy. In order to do that, it´s mandatory to understand the impact of process dynamics as well as to recognize which materials attributes and which process variables have a significant impact on final product quality. This gained knowledge should be applied to the design of measurement systems for process monitoring and control.(20,21) Regulators and industry will have to keep developing knowledge and experience with those systems-approach methodologies with the view to achieve expertise in supporting and approval of a wider implementation of CM processes.(1)
8
3.1.3 Quality considerations for CM
Process understanding
Design of Experiments (DoE) is a powerful tool to gain process understanding since as “a structured, organized method for determining the relationship between factors affecting a process and the output of that process”(9), it establishes the operational boundaries of the process. Continuous process response to changes in process parameters is swift, thus enabling a huge collection of data in a short period of time from a small amount of in-process materials. These data are introduced into mathematical models to get process knowledge, whilst predictive process models are applied as a simulation tool to generate experiments and enhance process understanding, in the course of process development.(21)
Regulation of CM requires a batch definition for continuous processes and a method to obtain raw material traceability (RMT) – the competence to maintain and access the identity and attributes of the raw materials throughout the process.(22) Comprehension of how raw materials flow through the process is crucial to RMT. This knowledge can be achieved by characterization of residence time distribution (RTD), following a tracer experiment or a process modelling.(23,24) RTD is a probability distribution that depicts how a material moves within different unit operations of a continuous process system. The RTD curve is very useful to predict the diffusion of raw materials, the disturbances over the system and to determine when substances were introduced into the manufacturing system. RTD is influenced by several factors like processing time, equipment parameters and raw material properties. A suggested method to report material travelling over the system is a traceability resource unit (TRU).(25) A TRU acts as a segment of material flowing through the process together with other raw materials and can be used as a unique identifier to the process history point of view. If the CM process is integrated with packaging units, unique package identifiers must connect drug product supply chain traceability to process traceability, in order to trace any packaged drug product from marketing to its original raw materials and vice-versa.(1)
Current Good Manufacturing Practises (cGMPs) guidelines define «batch» as a specific quantity of final or intermediate product, featured by uniform properties and within specified quality limits, which is fabricated according to an individual manufacturing order through the same production cycle. Likewise, it´s expected that CM process produces batches. In fact, for CM a «lot» is equivalent to «batch» and corresponds to a specific identified amount of final product generated in a particular time or in a certain quantity in a way that both uniform character and quality specified limits are warranted.(1)
9 In CM, RMT is closely linked to the definition of batch. When a process demonstrates an ongoing state of control, a batch can be determined according to production time period, quantity of raw materials processed, equipment run time capability or process variation (e.g. different lots of incoming raw materials). Hence, batch concept is directly associated with process control strategy, designed to deliver uniform quality within the batch.(1)
Control strategy
A control strategy for CM is built to control the quality of final product throughout the manufacturing process, in response to potential variations like equipment conditions, incoming raw materials or environmental factors.(26) Usually, three levels of control strategy implementations are described:
- Level 1 control (engineering control) takes an active process control system to monitor, in real-time, raw materials quality attributes and then to use that information to adjust automatically process parameters with the view of conforming those quality attributes to the acceptance criteria;
- Level 2 control (pharmaceutical control) assumes the definition of a process design space, in which raw materials attributes and process parameters are established, and also implements an adequate end-product testing;
- Level 3 control is exclusively based on raw material attributes and process parameters with extensive end-product testing.(1)
Usually, in CM, the most convenient level of control is Level 1, although a hybrid perspective of different levels of control is possible for some CM process designs.(16)(27)
Process knowledge gained from monitoring and control strategies supports process state of control, a condition in which a continuous process is able to ensure that a final product is consistently delivered with the desired quality.(1) However, in the course of start up and shutdown procedures, at some point, there may be in-process materials or final products that do not meet the target quality specifications. Therefore, the competence to isolate and reject materials out of specification, as a consequence of a process no longer under a state of control, is one of the main responsibilities of a CM control strategy. Once again, RTD models are powerful tools to track non-conforming materials over the process from deviation point. The settlement of a disposition strategy when products provide from a process that is not under control together with the implementation of adequate process monitoring criteria, constitute important issues to ensure quality through the production run.(1)
10 The increased amount of total data collection during a continuous process run motivates the adoption of multivariate process monitoring methodologies. Multivariate statistical process control (MSPC) constitutes a process monitoring methodology applied to determine whether the variability in the process is stable over time. MSPC is used to detect abnormal events in the process that may potentially cause severe consequences and unveils which process variables may be in the origin of the event. MSPC also enhances detection of abnormal process operations by identifying changes in the relationships between process parameters and quality attributes.(28)
Since CM process holds in-process materials and discloses a fast process dynamics, real-time monitoring of both process parameters and intermediates quality attributes shows up as a crucial stage for the settlement of a state of control. Moreover, PAT tools and multivariate models are used to build process understanding. Applying PAT tools enables the measuring of the final product quality attributes, some of which may have already been integrated into the control strategy for process monitoring and control.(1)(5) In-line PAT tied to the control system, explains why real-time release testing (RTRT) comes up naturally for CM, as “the ability to evaluate and ensure the quality of in-process and/or final product based on process data, which typically include a valid combination of measured material attributes and process controls”.(9)(6) So, whenever process perturbations occur, real-time rejection of non-conforming products can be performed without losing the whole batch.(5) However, a risk analysis should be accounted to assist on PAT failure and efforts should be done to establish contingencies for process monitoring and batch release.
Innovation in pharmaceutical development follows the direction of manufacturing a high quality product (highly suitable for its intended use), built by a scientific-based design, whose production process is capable of consistently providing the desired performance of the product. The information gathered during process development (through design of experiments, PAT tools and prior knowledge) supports process knowledge and that, along with product knowledge, provides the scientific basis to define the design-space, specification boundaries and production controls.(9) The design-space represents the relationship between both material attributes and process parameters, i.e. process inputs, and the critical quality attributes (CQA). A CQA is a specific property that should be within an adequate range to assure the intended product quality. A critical process parameter (CPP) is a process parameter which variability influences the CQA and thus, should be monitored and controlled to assure the production of a product with the expected quality.(9)
11
3.2 Roller compaction
Granulation is a unit operation that consists of particle size enlargement and densification by agglomeration of small particles into larger ones. In pharmaceutical technology, the principal reasons to granulate powders are: to improve powder flow properties for further dosage filling and compression purposes; to improve product stability; to prevent powder mixture from segregation; to reduce bulk volume so that storage is minimal and transport is facilitated; to reduce potential environmental and safety hazards.(29)
There are several methods to perform granulation, even though they are usually classified as either dry or wet. In wet methods, powder mixture particles are agglutinated by spraying an appropriate solution to form a mass. After that, the wet mass is dried and larger particles, named granules, are calibrated to get the adequate size for further downstream processing. In modern pharmaceutical manufacturing, wet granulation has been by far the most common powder granulation technology.(29)
Dry granulation (DG) was first applied to pharmaceutical industry in the late 1940s, but has drawn particularly attention in the last 25 years as research in new API has increased. Some of these new therapeutic compounds are either sensitive to heat or moisture and, therefore, cannot undergo wet granulation.(29)
DG process began by producing uniform densified granules, called slugs, during a process named slugging. Nowadays, DG is mostly performed using roller compaction technology, whereas it offers many advantages over other granulation methods: (29)
1) it is among the most cost-effective granulation processes, since it requires less space, personnel, energy and time consumption;
2) it is the only efficient and safe process for formulations with drug substances sensitive to heat, moisture or solvents, since no liquid nor additional heat are needed;
3) it is a continuous process with higher throughput and lower energy consumption; 4) it is able to produce more homogeneous products, when compared to other DG techniques;
5) it lends itself to a higher level of control, with implementation of on-line monitoring and control tools, as well as to automation of process settings, in order to minimise variations between batches and to improve product quality. (29–32)
12
3.2.1 Roller compaction process
The process of dry granulation is dependent upon bond formation between particles in order to produce granules. The aggregation of particles, stuck together due to interparticulate bond formation, is described by four distinct stages that occur accordingly to a specific order.
1) Particle rearrangement takes place when particles start to fill void spaces and air
begins to move out from interstitial spaces inside powder mixture. Then particles start to come closer together and powder mixture´s density increases. Spherical particles tend to pack to one another, moving less than particles with other different shapes. Thus, particle shape and size are crucial in rearrangement process.
2) Particle deformation is considered to be a plastic deformation, as a result of
increasing compress forces applied on powder particles. This deformation enhances points of contact between particles, which boosts their bonding.
3) Particle fragmentation comes up at higher compression forces, creating multiple
new particle surface sites and thus potential bonding points.
4) Particle bonding ensues as a consequence of plastic deformation and
fragmentation, particularly due to van der Waals forces.(29)
When powder granules undergo an applied force, a stress force is released from granules and they tend to return to their original form – elastic deformation. Albeit, granules may not completely recover from deformation and so plastic deformation occurs. Elastic and plastic deformation can occur at the same time, though only one of them predominates.(29)
Roller compaction process starts when powder mixture enters into the feeding zone, through a hopper, where particles are rearranged and densified. At this stage, press force over particles is too low. These powders then go through the compaction zone, beginning by nip region, where brittle particles break and plastic particles deform as a result of a sharp increase in compaction force. At the end of nip area, the going up further compression force exerted by two counter-rotating rolls causes particles fragmentation and particles bond to form ribbons (Figure 2).(30)
13
Figure 2 – Representation of compaction zone with horizontal rolls, inside the roller compactor. (1) Feed Zone; (2) Compaction Zone (Nip zone + Grip Zone); (3) Extrusion Zone. (Adapted from (33))
The higher pressure occurs at neutral nip angle, which usually is slightly before the lower roll gap. The nip angle is the angle where pre-densified powders enter the nip zone, and it hinges on the material friction angle and the roll surface friction angle.(34) The nip angle is large for compressible material, but small for incompressible material.(35)
After the roll gap, the ribbons are extruded from the rolls, then chopped and milled to produce granules with adequate particle size.(30)
3.2.2 Roller compactor features
The main components of a roller compactor are: feeder, rolls, and mill.(30)
1) Feeder. Feeding system is critical to regulate powder flow, powder densification
and powder deaeration. The head pressure, a pressure differential established between the bottom and top of the hopper, induces continuous densification and deaeration of incoming particles.(30)
There are two types of feeders: gravity feeder and force feeder. The gravity feeder has an adjustable tongue and a distributor at the end of hopper, working without an external driving force. The force feeder has a rotating screw, with a single flight, installed in the centre of the hopper. The rotating flight pushes the powder toward the nip area. Force feeders offer several advantages: adequate for poor flowing powders, provide continuous and consistent flowing to the nip region and prevent powder feeding disruption from trapped compressed air.(30)
Feeders design is important to get positive pressure in powder feeding. The orientation of feeder can be vertical, horizontal or inclined; for feed screw only straight (most common) and tapered designs are available (Figure 3). Vertical feeders are favoured with
14 head pressure from the hopper. Horizontal feeders minimize leakage and improve compactibility. Inclined feeders use also gravity to introduce powder, but show less powder leakage; they are used for multi-screw feeders in large scale equipment.(30)
Figure 3 – Feeder orientations. (a) Vertical, straight; (b) Inclined; (c) Vertical, tapered; (d) Horizontal. (Adapted from
(30))
Screw feeders unveil non-uniform feeding. The cross section of the nip area is rectangular, but the rotating screw generates a circular deliver area. As a result, the centre region of the nip is overfed, while the edges are scarcely fed, producing ribbons with thinner and more fragile edges.(36) Also, as single rotating flight exerts pressure on the compact in the roller gap, the feed pressure is irregular and induces an uneven distribution of the powder in the nip area. Hence, ribbons may be more compacted in one area than the other.(37) This effect can be reduced, following one of these suggestions: round off the end of screw flight, select double flight screws to get a uniform force distribution, choose multiple feeder screws and elevate the position of the screw.(30)
Feed screw affects granules characteristics by controlling the roll gap, which further regulates the amount of material coming between the rolls.(38) Hence, the roll gap defines the ribbon thickness and, consequently, the product quality. It has been understood that when the roll gap is reduced, powder is compressed at a much higher compaction force, so more densification occurs. As a result, the average density of the ribbon is inversely proportional to the roll gap.(39) Besides, if the two rolls are fixed, the compaction force will
15 vary enormously with the fluctuating mass flow, throughout the process. On the contrary, if the rolls are movable, roll compaction force can be kept constant by changing the gap width according to the mass flow.(40)
2) Rolls. Rolls are key components that exert compression force. Rolls are
characterized by their orientation, mounting, arrangement and pressurizing system. The rolls orientation determines the feeder orientation. Therefore, rolls can be horizontal (most common), inclined or vertical (Figure 4). Horizontally aligned rolls are equipped with vertical or inclined feeders; vertically aligned rolls are equipped with horizontal feeders.(30)
Figure 4 – Roll orientations. (A) Horizontal; (B) Inclined; (C) Vertical. (Adapted from (30))
The surface of rolls can be smooth, corrugated or fluted (Figure 5). Smooth and corrugated rolls are the most common. Smooth rolls are advantageous in overcoming sticking problems and also can reduce the amount of lubricant needed. Corrugated rolls are selected to give more gripping force to the powder, in order to solve the inadequate feeding and uneven compact, though powder sticking may be a problem.(30)
16 3) Mill. The milling step intends to obtain granules from the ribbon. In general, the mill
consists of a moving rotor and a fixed sieve of a chosen mesh size. Not only the rotor speed, but also the rotation direction (clockwise direction, counter-clockwise direction or a combination of both) can be adjusted, according to the equipment. Some authors have proposed that operating in oscillating mode (clockwise/counter-clockwise) yields higher throughput than rotation (clockwise). Concerning the mill speed, it is reported that, typically, the higher the mill speed, the higher percentage of fines is got at the end of the process.(41) Other studies have shown that the effect of milling conditions on granules mechanical properties, obtained from die compaction, is irrelevant.(42)
Roll compactors are built with a sealing system to prevent the loss of powder from the sides. The most common sealing systems are: cheek plates, with a fixed side sealing, and rimmed-roll, in which side sealing is integrated with the bottom roll. In cheek plates assembly, roll pressure and density distribution are non-uniform, whereas for rimmed-roll, the reverse effect is observed.(43) In order to reduce the amount of fines produced during roller compaction, it is preferable to work at high roll force and use rimmed-roll as a sealing system.(42)(44)
Other factors like deaeration, temperature control and feeder vibration are important as well to keep the process feasible. In deaeration, the air trapped between particles may damage the new-formed ribbon: when ribbon porosity is high, air continues to leave and ribbons get weaker; when ribbon porosity is low, the trapped air may cause the ribbon to break horizontally into pieces. The air usually escapes in three ways: between the feeder base and the top of the roller, between the rolls and the cheek plates, against the flow of feed through the loose bulk material. To minimize this problem, applying a vacuum at the top and bottom level of the powder bed induces the trapped air out.(30)
The feeder vibrator can improve the powder flow, providing a continuous driving force to break the stagnant powder bed, thus helping densification and deaeration.(30)
The screw flight can generate excessive heat when rotating in the powder bed. This heat may elevate the local temperature and cause the powder to be partially melted and stuck to the flight. To avoid this situation, a special flight with a cooling jacket can be used.(30)
17
3.2.3 Impact of process parameters
In roller compaction process, the critical process parameters needed to be optimized to assure process feasibility, ribbon quality and granule tabletibility are: compaction force, roll speed and feeder screw speed.(40)(45–47)
1) Compaction force. When subject to press force, solid particles densify, deform or
fracture and bond to form ribbons. At high compaction force, a strong ribbon with low porosity and less fines is produced.(48–50) Over-compaction may break the ribbon and generate poor quality granules.(30)
Once the granules from RC are to be compressed, one of the main issues regarding a DG process is the phenomenon of loss of tabletibility of granules.(51–53) Tabletibility or compactibility (tablet tensile strength versus pressure) describes the capacity of a powder to be transformed into tablets with defined strengths under determined pressures. Tablet tensile strength is the result of the interplay between bonding area (BA) and bonding strength (BS).(54,55) Obviously, larger BA amidst granules or higher BS benefits stronger tablets.
Several mechanisms have been proposed to explain the loss of tabletibility in DG. One of the earliest hypotheses put forward is the “work hardening”, defined as the production of harder granules with markedly increased resistance to deformation.(56) Since work hardening is difficult to measure in granules, some authors have proposed its replacement by “granule hardening”(57) (under a compaction force, the granules porosity is reduced and the granule strength increases). Because of granule hardening, higher compaction forces lead to harder ribbons, harder granules and lower tensile strength tablets.(49)
It has been concluded that BA and BS influence mechanisms that determine tabletibility. In the case of plastic materials, the main mechanisms are: lubrication, granule size enlargement and granule hardening. Adding more lubricant, especially when blended in the mixture, leads to lower BS and reduced tabletibility. Thus, granules with a higher porosity are more deformable when subjected to compaction force and promote large BA and a stronger tablet. In brittle materials, granule hardening is the most important mechanism for tabletibility. However, the dominating mechanism for each situation depends upon material properties and process parameters.(58)
Some authors have pointed out that compaction force is the most important factor that affects the quality of the compact,(59) mostly for plastic materials. As for brittle materials, they seem to be less susceptible to compactibility loss. Thereby, since powder mixtures often
contain plastic and brittle materials, an optimum operating range of compaction force should be determined on a case-by-case base throughout process development.(30)
18
2) Screw speed. The rotating flight generates a force which induces a downward
compression force, pushing the powder into the compaction zone and causing its pre-densification.(36) Screw speed operating range should be determined based on powder flow, aeration condition and roll speed. Low screw speed may provoke scant feeding to the nip zone and poor ribbon strength. High screw speed may cause a highly densified zone in the nip area and eventually induce melting of particles on the flight, which may stop powder flow. A proper formulation modification, adequate deaeration or addition of feeder vibrator may be necessary to improve process feasibility.(30)
3) Roll speed. The roll speed controls the dwell time of the ribbon and the throughput
of the roller compactor. Roll speed is defined according to the flowability, plasticity and elasticity of the powder.
For plastic materials, sensitive to dwell time, a low roll speed is prone to produce granules with better flow and lower friability.(60) But longer dwell time may also cause the material to lose compactibility, generating tablets with low hardness and high friability. The impact of dwell time on plastic or partially plastic deforming materials can be reduced with high roll speed and low screw speed.(59)
In case of elastic recovery materials, the compact strength depends on the dwell time in the compaction zone, as elastic recovery may occur upon the release of the ribbon. High roll speed or short dwell time may provoke cracking, weakening or even the destruction of the ribbon. Hence, for highly elastic materials, the overall process throughput is hedged by physical properties of raw materials.(30)
For brittle materials, the compact strength reveals independence from dwell time, once fragmentation occur in short time and so exposure to compaction force tends to have a limited effect on the ribbon strength.(61–63)
4) Relationship between roll speed and screw speed. The production of granules with desirable compression capacity is achieved by controlling the ratio of roller speed to screw speed. At constant roll speed, a low screw speed may lead to insufficient feeding and thus to thinner ribbons and weaker ribbon strength. On the contrary, high screw speed may induce overfeed and produce thicker ribbons.(48) When roller speed and screw speed ratios are kept constant, both the ribbon density and strength are independent of roller speed.(60) The definition of roll speed to screw speed ratios hinges mostly on the properties of powder blend. Generally, for plastic materials, a higher roll speed to screw speed ratio gives better quality granules and tablets (best tablet friability, hardness and dissolution rate).(30)
19 Finally, the most important critical quality attributes are:
1) Granule particle size distribution. Small particle size of both raw materials and
granules have a positive effect on enhanced tablet strength.(51) Large granules may induce weight variation during compression and because less BA is exposed, tablets exhibit low tensile strength. (45)(58)
2) Granule/ribbon density. Ribbon is not homogeneous in terms of density
distribution, showing lower density at the edges and higher density at the centre.(31)(45)(39)
3) Granule/ribbon porosity. Recent studies have highlighted the importance of
granule porosity. In fact, granules with high porosity, under a compression force, breakdown and above a critical porosity value disintegrate completely into primary particles, producing a tablet which microstructure resemble that formed from the original powder.(64,65) For that reason, critical porosity should be lower at higher compaction force.(58)
Harder ribbons (resulted from higher compaction force) exhibit low porosity, and leads to harder granules and lower tensile strength tablets.(45)(49)
4) Amount of fines produced. When there are too much fines, problems regarding
poor flow, weight variation and picking may occur during tablet compression. Moreover, fines generated during RC are undesirable as they frequently cause material loss and reduce granule flow properties. Also, it is strongly discouraged to recycle fines in the process, since the regranulation of fines has a negative influence on API-conformity.(42,45)(51)