Volume 40, Issue 3
Human Capital's importance in Initial Coin Offerings' (ICOs) success
José Campino ISCTE-IUL Ana Brochado ISCTE-IUL Álvaro Rosa ISCTE-IULAbstract
The Initial Coin Offerings (ICOs) are an emerging topic in the literature with several gaps still to fulfill. The ICOs have increased its importance not only due to the interest they have been raising but also due to the capital amounts
involved in the projects, the innovative solutions they offer and the challenges they pose to regulators. There is some research on the ICOs' success factors but there is still no common measure of success as well as not many researches focused on the human capital importance for the projects success. In our research we will perform a literature review on the ICOs' topic and develop an econometric model with a database composed by 3158 profiles and 340 ICO projects in the banking/financial sector. We will be focusing on the human capital importance in these projects and propose three measures for project's success. With our research we intend to complement the literature on the ICOs projects and shed some light on the factors driving their success.
Citation: José Campino and Ana Brochado and Álvaro Rosa, (2020) ''Human Capital's importance in Initial Coin Offerings' (ICOs) success'',
Economics Bulletin, Volume 40, Issue 3, pages 2016-2022
Contact: José Campino - jpmcampino@gmail.com, Ana Brochado - Ana.Brochado@iscte-iul.pt, Álvaro Rosa - alvaro.rosa@iscte-iul.pt. Submitted: May 18, 2020. Published: August 08, 2020.
1. Introduction
The Initial Coin Offerings (ICOs) are an emerging topic in the literature but there is still a considerable literature gap due to their novelty. ICOs’ main function is to fund innovative ventures which are based on a distributed ledger technology (DLT) such as blockchain. The funding is performed via the tokens selling by the cutting hedge technological ventures and the tokens purchase by worldwide investors (Chiu & Greene, 2019). Therefore, the investors are able to buy tokens directly from the new venture without the need to a third party involved. The tokens sold will be venture capital project’s functional future units, in other words, they will have a utility function, right of ownership or royalties (Fisch, 2019). According to Howell, Niessner, & Yermack (2018) there are three main token categories: (i) currency token: used as a means of exchange and store such as a cryptocurrency; (ii) security token: used as a conventional security but recorded and exchanged on a blockchain. The underlying of this token type can range from corporate equity (typical share), to commodities, real estate or even currencies; (iii) utility token: is the most common token type and provides to the buyer consumptive rights to access a product or service. According to Kranz, Nagel, & Yoo, 2019 there is a fourth type of toke, namely, the donation tokens which do not grant any rights to the investor and are used to raise money for entrepreneurial and idealistic projects. According to Brochado (2018) there are also hybrid tokens which combine more than one of the characteristics mentioned above and new token types should appear in the future (Fisch, 2019). All the characteristics and main information on the ICO should be described in the Whitepaper of the new venture which, although unregulated, tries to mimic a regulated prospectus (Chiu & Greene, 2019). According to Brochado (2018) we could define ICOs as an alternative investment form offering the possibility of direct financing from worldwide investors and which contributes to the democratization of entrepreneurship and access to capital markets. The ICOs are based on Blockchain’s technology and offer the chance to invest in a project’s
initial phase through the acquisition of a token. It also allows tokens’ transaction on secondary
market which is essential to their success (Chen, 2018). This definition is in line with Fisch (2019) who also highlights the similar approaches of crowdfunding and ICOs although an innovative characteristic of the latter is the possibility of selling tokens in a secondary market not available in crowdfunding.
2. Literature review
ICOs are frequently compared with other ways of financing young and risky ventures such as Initial Public Offerings (IPOs), Venture Capital (VC) and Crowdfunding. Nevertheless, ICOs are disruptive and although they share some of more traditional financing ways characteristics, they are very distinct from them (Biasi & Chakravorti, 2019). The main characteristics of ICOs are: less costly; lower investment thresholds; democratization of investments; blockchain based; no intermediaries involved (e.g. banks); low regulation; completely digital; existence of a secondary market (Brochado, 2018) and (OECD, 2019).
The ICO projects usually set boundaries for their financing, namely, a minimum amount of financing to be obtained in order to proceed with the project and a maximum amount of capital accepted once this is proved to positively influence tokens’ valuation (Howell, Niessner, & Yermack, 2018). This is done by determining how many tokens are available for sale and their initial price. Therefore, the ICOs can have the following models: (i) not capped: where there are no limits for financing; (ii) soft-capped: where a minimum amount of financing is established in order to proceed with the project; (iii) hard-capped: maximum amount of financing accepted; (iv) combination of both soft- and hard-cap limits and hybrid methodologies such as accepting financing above the hard cap and setting several ceilings instead of only one (Kranz, Nagel, & Yoo, 2019).
In terms of determining the success of an ICO project the mostly commonly used measure is the amount raised (An, Duan, Hou, & Xu, 2019) and (Fisch, 2019). As most of the times the projects are capped, further strong measures of success should be the achievement of the minimum capital previously defined and, in positive cases, the percentage of the amount raised over it (Jong, Roosenboom, & Kolk, 2018).
2.1. Market Snapshot
The first ICO was the MasterCoin in 2013 proposed by J.R. Willett and since then the ICO market has increased mainly due to its novelty and the hype caused by the valorization of cryptocurrencies, particularly Bitcoin, between the years of 2017-2018 (Masiak, Block, Masiak, Neuenkirch, & Pielen, 2018). Indeed, during the last 4 years the ones with the largest amount of funds raised are 2017 and 2018. The year of 2017 accounted 442 token sales concluded with USD 6.4 billion of funds raised and 2018 was even better for the ICO market with 1051 token sales concluded and with USD 21 billion of funds raised. However, with the depreciation of Bitcoin since the end-2018, the ICO market also refrained and 2019 registered much lower values compared with previous years, namely, 131 token sales concluded and USD
1.4 billion of funds raised (Coinschedule, 2020). The ICO’s market represent significant
amounts of invesment despite the fact that in 2017 45% of them have failed (Risley et al. 2017, cited OECD 2019, p.49). Furthermore, prior to trading in 2018, 81% of the ICOs are considered as scams and only 8% move to trade from which only 3.8% are successful (Dowlat and Hodapp 2018, cited OECD 2019 p.35). The 3 ICOs which raised the largest amounts of funding represent USD 6.8 bllion, namely, EOS (USD 4.1B), Telegram Open Network (USD 1.7B) and BITFINEX (USD 1B) (Coinschedule, 2020).
3. Methodology 3.1. Database
The data used in the research is secondary and collected from ICOBench a website which comprises a large database on ICOs (ICOBench, 2020). The information provided by the
website is mostly related with the projects and concerns among other data: the project’s year,
amounts raised, type of cap, existence of pre-sales or bonus schemes. It also compiles information on the team, such as their composition and functions. The data was collected via a premium subscription which gave access to an API. As the main objective of the research is to study the ICO’s teams, the complementary information was collected from the public LinkedIn profiles of the team members. This data treatment resulted in the collection of 556 ICO projects, on the banking/financial area, from which 216 were discarded due to lack on crucial information and leaving the database with 340 projects. The projects’ teams were composed by 5025 profiles from which we were able to keep 3158 once 1867 were discarded due to lack of crucial information.
3.2. Model and Propositions
The main objective of this research is to study the ICOs’ teams and their impact on project’s success. Therefore, we have collected 3 dependent variables, several independent variables related with the teams’ characteristics and several control variables more focused on the projects’ characteristics. We developed a univariate analysis and the purpose will be to develop an econometric model. The current research proposition is to understand the impact of the teams’ characteristics on the projects’ success.
4. Results
In the current section we will present the database’s descriptive statistics followed by the
a binary variable on achievement of soft-cap limits; (ii) the log of the percentage above the soft-cap limit achieved; (iii) the log of the total capital raised. The independent variables concerning the team are: (i) person location; (ii) number of projects per person; (iii) LinkedIn connections; (iv) previous managerial experience; (v) previous technology experience; (vi) education; (vii) business degree; (viii) technology degree; (ix) team rating; (x) vision rating; (xi) number of team elements. The control variables are: (i) soft cap limit existence; (ii) hard cap limit existence; (iii) token price; (iv) currencies accepted in the ICO; (v) the ICO is based on an Ethereum platform; (vi) bonus scheme existence; (vii) ICO rating according to ICOBench; (viii) ICO year.
4.1. Database descriptive statistics
The focus of the current research is on teams’ impact on ICOs’ success and therefore the
database is focused on the profiles of the team members. All the profiles have at least one social network, namely LinkedIn, from which the profiles information was extracted. The great majority of the people have 1 social network (96.7%) and only 3.4% have 2 or more social networks. The most used social network is LinkedIn followed by Facebook and Twitter. The networks in these types of projects are essential and 71% of the profiles have 500 or more connections on LinkedIn. Almost half of the profiles analyzed are currently located in Europe (49%), followed by Asia-Pacific (25%), North America (17%) and other locations (9%). In Europe the top three countries in which profiles are located are the United Kingdom (18%), Russia (15%), France (8%) and Switzerland (7%). In North America, 88% of the profiles are located in the United States and 12% in Canada. In Asia-Pacific region the most representative areas are India (21%), Singapore (18%) and Australia (10%). Concerning the other locations,
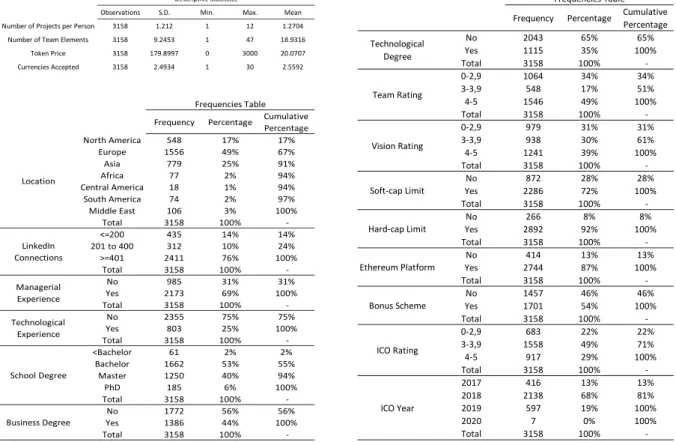
Table 1 - Database descriptive statistics
Frequency Percentage Cumulative Percentage No 2043 65% 65% Yes 1115 35% 100% Total 3158 100% -0-2,9 1064 34% 34% 3-3,9 548 17% 51% 4-5 1546 49% 100% Total 3158 100% -0-2,9 979 31% 31% 3-3,9 938 30% 61% 4-5 1241 39% 100% Total 3158 100% -No 872 28% 28% Yes 2286 72% 100% Total 3158 100% -No 266 8% 8% Yes 2892 92% 100% Total 3158 100% -No 414 13% 13% Yes 2744 87% 100% Total 3158 100% -No 1457 46% 46% Yes 1701 54% 100% Total 3158 100% -0-2,9 683 22% 22% 3-3,9 1558 49% 71% 4-5 917 29% 100% Total 3158 100% -2017 416 13% 13% 2018 2138 68% 81% 2019 597 19% 100% 2020 7 0% 100% Total 3158 100% -Bonus Scheme ICO Rating ICO Year Frequencies Table Technological Degree Team Rating Vision Rating Soft-cap Limit Hard-cap Limit Ethereum Platform Observations S.D. Min. Max. Mean
Number of Projects per Person 3158 1.212 1 12 1.2704 Number of Team Elements 3158 9.2453 1 47 18.9316
Token Price 3158 179.8997 0 3000 20.0707 Currencies Accepted 3158 2.4934 1 30 2.5592
Descriptive Statistics
Frequency Percentage Cumulative Percentage North America 548 17% 17% Europe 1556 49% 67% Asia 779 25% 91% Africa 77 2% 94% Central America 18 1% 94% South America 74 2% 97% Middle East 106 3% 100% Total 3158 100% -<=200 435 14% 14% 201 to 400 312 10% 24% >=401 2411 76% 100% Total 3158 100% -No 985 31% 31% Yes 2173 69% 100% Total 3158 100% -No 2355 75% 75% Yes 803 25% 100% Total 3158 100% -<Bachelor 61 2% 2% Bachelor 1662 53% 55% Master 1250 40% 94% PhD 185 6% 100% Total 3158 100% -No 1772 56% 56% Yes 1386 44% 100% Total 3158 100% -LinkedIn Connections Frequencies Table Location Managerial Experience Technological Experience School Degree Business Degree
the regions represented in the database are the Middle East (38%), Africa (29%), South America (27%) and Central America (6%). The profiles are highly educated with 98% having a university degree. 52% of the profiles have a bachelor degree, 40% have a master degree and only 6% have a doctoral degree. In terms of professional experience, 56% of the profiles had a managerial experience, 21% had a technological experience, 9% had both and 14% had other or no experience at all. Below we present the summary statistics of the database variables
4.2. Correspondence analysis
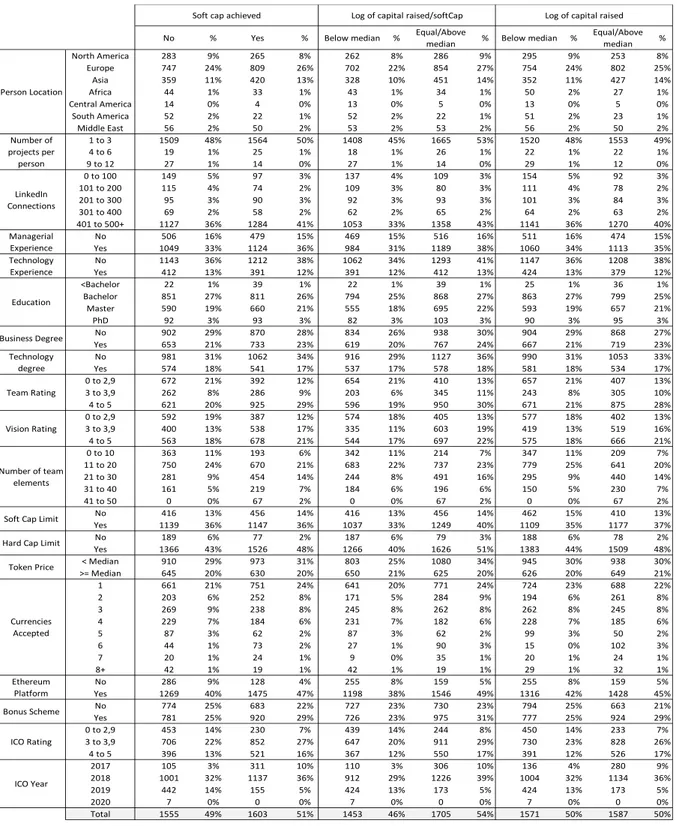
No % Yes % Below median % Equal/Above
median % Below median %
Equal/Above median % North America 283 9% 265 8% 262 8% 286 9% 295 9% 253 8% Europe 747 24% 809 26% 702 22% 854 27% 754 24% 802 25% Asia 359 11% 420 13% 328 10% 451 14% 352 11% 427 14% Africa 44 1% 33 1% 43 1% 34 1% 50 2% 27 1% Central America 14 0% 4 0% 13 0% 5 0% 13 0% 5 0% South America 52 2% 22 1% 52 2% 22 1% 51 2% 23 1% Middle East 56 2% 50 2% 53 2% 53 2% 56 2% 50 2% 1 to 3 1509 48% 1564 50% 1408 45% 1665 53% 1520 48% 1553 49% 4 to 6 19 1% 25 1% 18 1% 26 1% 22 1% 22 1% 9 to 12 27 1% 14 0% 27 1% 14 0% 29 1% 12 0% 0 to 100 149 5% 97 3% 137 4% 109 3% 154 5% 92 3% 101 to 200 115 4% 74 2% 109 3% 80 3% 111 4% 78 2% 201 to 300 95 3% 90 3% 92 3% 93 3% 101 3% 84 3% 301 to 400 69 2% 58 2% 62 2% 65 2% 64 2% 63 2% 401 to 500+ 1127 36% 1284 41% 1053 33% 1358 43% 1141 36% 1270 40% No 506 16% 479 15% 469 15% 516 16% 511 16% 474 15% Yes 1049 33% 1124 36% 984 31% 1189 38% 1060 34% 1113 35% No 1143 36% 1212 38% 1062 34% 1293 41% 1147 36% 1208 38% Yes 412 13% 391 12% 391 12% 412 13% 424 13% 379 12% <Bachelor 22 1% 39 1% 22 1% 39 1% 25 1% 36 1% Bachelor 851 27% 811 26% 794 25% 868 27% 863 27% 799 25% Master 590 19% 660 21% 555 18% 695 22% 593 19% 657 21% PhD 92 3% 93 3% 82 3% 103 3% 90 3% 95 3% No 902 29% 870 28% 834 26% 938 30% 904 29% 868 27% Yes 653 21% 733 23% 619 20% 767 24% 667 21% 719 23% No 981 31% 1062 34% 916 29% 1127 36% 990 31% 1053 33% Yes 574 18% 541 17% 537 17% 578 18% 581 18% 534 17% 0 to 2,9 672 21% 392 12% 654 21% 410 13% 657 21% 407 13% 3 to 3,9 262 8% 286 9% 203 6% 345 11% 243 8% 305 10% 4 to 5 621 20% 925 29% 596 19% 950 30% 671 21% 875 28% 0 to 2,9 592 19% 387 12% 574 18% 405 13% 577 18% 402 13% 3 to 3,9 400 13% 538 17% 335 11% 603 19% 419 13% 519 16% 4 to 5 563 18% 678 21% 544 17% 697 22% 575 18% 666 21% 0 to 10 363 11% 193 6% 342 11% 214 7% 347 11% 209 7% 11 to 20 750 24% 670 21% 683 22% 737 23% 779 25% 641 20% 21 to 30 281 9% 454 14% 244 8% 491 16% 295 9% 440 14% 31 to 40 161 5% 219 7% 184 6% 196 6% 150 5% 230 7% 41 to 50 0 0% 67 2% 0 0% 67 2% 0 0% 67 2% No 416 13% 456 14% 416 13% 456 14% 462 15% 410 13% Yes 1139 36% 1147 36% 1037 33% 1249 40% 1109 35% 1177 37% No 189 6% 77 2% 187 6% 79 3% 188 6% 78 2% Yes 1366 43% 1526 48% 1266 40% 1626 51% 1383 44% 1509 48% < Median 910 29% 973 31% 803 25% 1080 34% 945 30% 938 30% >= Median 645 20% 630 20% 650 21% 625 20% 626 20% 649 21% 1 661 21% 751 24% 641 20% 771 24% 724 23% 688 22% 2 203 6% 252 8% 171 5% 284 9% 194 6% 261 8% 3 269 9% 238 8% 245 8% 262 8% 262 8% 245 8% 4 229 7% 184 6% 231 7% 182 6% 228 7% 185 6% 5 87 3% 62 2% 87 3% 62 2% 99 3% 50 2% 6 44 1% 73 2% 27 1% 90 3% 15 0% 102 3% 7 20 1% 24 1% 9 0% 35 1% 20 1% 24 1% 8+ 42 1% 19 1% 42 1% 19 1% 29 1% 32 1% No 286 9% 128 4% 255 8% 159 5% 255 8% 159 5% Yes 1269 40% 1475 47% 1198 38% 1546 49% 1316 42% 1428 45% No 774 25% 683 22% 727 23% 730 23% 794 25% 663 21% Yes 781 25% 920 29% 726 23% 975 31% 777 25% 924 29% 0 to 2,9 453 14% 230 7% 439 14% 244 8% 450 14% 233 7% 3 to 3,9 706 22% 852 27% 647 20% 911 29% 730 23% 828 26% 4 to 5 396 13% 521 16% 367 12% 550 17% 391 12% 526 17% 2017 105 3% 311 10% 110 3% 306 10% 136 4% 280 9% 2018 1001 32% 1137 36% 912 29% 1226 39% 1004 32% 1134 36% 2019 442 14% 155 5% 424 13% 173 5% 424 13% 173 5% 2020 7 0% 0 0% 7 0% 0 0% 7 0% 0 0% Total 1555 49% 1603 51% 1453 46% 1705 54% 1571 50% 1587 50% Bonus Scheme ICO Rating ICO Year Soft Cap Limit Hard Cap Limit Token Price
Currencies Accepted
Ethereum Platform
Log of capital raised/softCap Log of capital raised
Number of team elements Team Rating Vision Rating
Soft cap achieved
Managerial Experience Technology Experience Education Business Degree Technology degree Person Location Number of projects per person LinkedIn Connections
The correspondence analysis done through a cross-table allows the understanding of the behavior of the independent variables in relation to the dependent variable. In this case, we can understand the distribution of the profiles within the independent variables when exposed to the binary version of the dependent variable. We have selected three dependent variables: (i) soft-cap limit achieved; (ii) the log of the percentage of capital obtained above the soft-cap; (iii) the log of the total capital raised. The percentage of profiles linked to successful projects is similar across the three models proposed with a higher tendency for successful projects. The distribution of profiles within the independent variables is similar across models which leads us to similar conclusions regardless of the dependent variable.
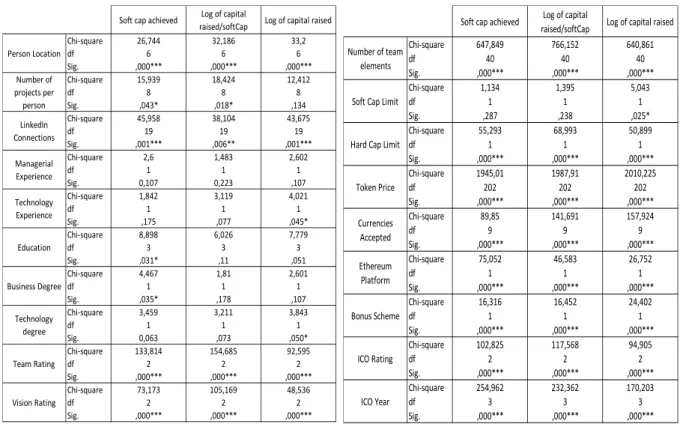
We have also created a chi-square table in order to attest the statistical significance of each independent variable having in mind the dependent variables selected. The significance levels adopted below are the following: 0,001 (***), 0,01 (**), 0,05 (*).
Most of the significant variables are consistent across models, in other words, the models seem to provide similar results again. The most significant variables accepted at 0,001
significance level are the person’s location, number of LinkedIn connections, team rating,
vision rating and number of team elements. These variables are accepted regardless of the dependent variable selected. The variable number of projects per person is also significant at 0,05 level for the dependent variables related with soft-cap achievement and the percentage achieved above that threshold. The variables related with technological profiles (i.e. technology experience and technology degree) are only relevant with 0,05 significance level for the dependent variables related with total capital achieved. The variables education and business degree are only relevant for the dependent variable related with soft-cap achievement at 0,05% significance level. Therefore, we conclude that the first variables are the strongest to build a model with the current data.
Soft cap achieved Log of capital
raised/softCap Log of capital raised Chi-square 26,744 32,186 33,2 df 6 6 6 Sig. ,000*** ,000*** ,000*** Chi-square 15,939 18,424 12,412 df 8 8 8 Sig. ,043* ,018* ,134 Chi-square 45,958 38,104 43,675 df 19 19 19 Sig. ,001*** ,006** ,001*** Chi-square 2,6 1,483 2,602 df 1 1 1 Sig. 0,107 0,223 ,107 Chi-square 1,842 3,119 4,021 df 1 1 1 Sig. ,175 ,077 ,045* Chi-square 8,898 6,026 7,779 df 3 3 3 Sig. ,031* ,11 ,051 Chi-square 4,467 1,81 2,601 df 1 1 1 Sig. ,035* ,178 ,107 Chi-square 3,459 3,211 3,843 df 1 1 1 Sig. 0,063 ,073 ,050* Chi-square 133,814 154,685 92,595 df 2 2 2 Sig. ,000*** ,000*** ,000*** Chi-square 73,173 105,169 48,536 df 2 2 2 Sig. ,000*** ,000*** ,000*** Person Location Number of projects per person LinkedIn Connections Managerial Experience Technology Experience Education Business Degree Technology degree Team Rating Vision Rating
Soft cap achieved Log of capital
raised/softCap Log of capital raised Chi-square 647,849 766,152 640,861 df 40 40 40 Sig. ,000*** ,000*** ,000*** Chi-square 1,134 1,395 5,043 df 1 1 1 Sig. ,287 ,238 ,025* Chi-square 55,293 68,993 50,899 df 1 1 1 Sig. ,000*** ,000*** ,000*** Chi-square 1945,01 1987,91 2010,225 df 202 202 202 Sig. ,000*** ,000*** ,000*** Chi-square 89,85 141,691 157,924 df 9 9 9 Sig. ,000*** ,000*** ,000*** Chi-square 75,052 46,583 26,752 df 1 1 1 Sig. ,000*** ,000*** ,000*** Chi-square 16,316 16,452 24,402 df 1 1 1 Sig. ,000*** ,000*** ,000*** Chi-square 102,825 117,568 94,905 df 2 2 2 Sig. ,000*** ,000*** ,000*** Chi-square 254,962 232,362 170,203 df 3 3 3 Sig. ,000*** ,000*** ,000*** Currencies Accepted Ethereum Platform Bonus Scheme ICO Rating ICO Year Hard Cap Limit
Token Price Soft Cap Limit Number of team
elements
5. Discussion
From the descriptive statistics performed on the data collected we conclude that most of the projects’ promoters on the banking/financial sector are currently located in Europe and that social networks are important in order to keep contacts. Most of the people prefer the professional network LinkedIn in order to feed their network which tends to be large due to the
number of connections each profile has. The project’s promoters tend to be very educated
people with university degree, most of them at bachelor’s level. The majority of the profiles had a managerial experience and about 21% of them had a technological experience. Looking at the correspondence analysis, we conclude that these projects do not have a high degree of success measured by our dependent variables. The independent variables which can be considered significant are the profile location, once we confirmed that the most successful projects are promoted by people located in Europe, Asia-Pacific and the United States. The remaining regions are less significant in the sample and are related with less successful outcomes. The number of projects per person can also be considered significant for two of the three dependent variables and is related with the experience of each profile. While most of the profiles had participated only in one project, we see that if the promoter has participated in one up to six projects, they tend to be more successful. For higher projects participation (i.e. more than 6) the results are negative. The variables measuring the professional experience of the profiles as well as the ones measuring the education turned out to be not much significant. The variable measuring the level of education (i.e. ranging from less than bachelor up to PhD) is only significant for the dependent variable related with soft-cap achievement. This conclusion in indeed expected once the great majority of the profiles have higher education making them less distinct in this factor. The variables related with the ratings attributed by experts revealed to be significant regardless of the dependent variable. The ratings are one of the most visible and impactful factors when an investor decides to engage with a project once they are presumed to reflect the expert’s opinion on the project as well as the rating automatically attributed by an algorithm. The teams’ size revealed also significant regardless of the dependent variable and we conclude that smaller teams tend to have worst results.
6. Conclusion
We have engaged in exploring the new concept of ICO and particularly the composition of the projects’ teams and their impact on the success of a project. Therefore, we have helped filling a literature gap on this subject by proposing three different measures of success and several measures for team’s characteristics. We have concluded that several of the variables we propose tend to be significant, having in mind our dependent variables, and we were also able to describe a large set of profiles who are promoters of ICO projects. The avenues to complement these preliminary results are to enlarge the literature review and develop an econometric model based on our conclusions until now. Despite the contributions made the main limitations foreseen in the current research is the predominance of European projects/profiles in the database as well as limited variables for profiles which could in the future be complemented with new variables (e.g. data on profile’s socioeconomic details). A larger database could also be tested including other type of projects beyond the banking/financial sector.
7. References Journal Article:
An, J., Duan, T., Hou, W., & Xu, X. (2019). Initial Coin Offerings and Entrepreneurial Finance: The Role of Founders’ Characteristics. The Journal of Alternative Investments, 26-40. doi:https://doi.org/10.3905/jai.2019.1.068
Biasi, J., & Chakravorti, S. (2019). The Future of Cryptotokens. Disruptive Innovation in Business and Finance in the Digital World, 167-187. doi:https://doi.org/10.1108/S1569-376720190000020018
Brochado, A. (2018). Snapshot das Initial Coin Offerings (ICOs). (CMVM, Ed.) Cadernos do Mercado de Valores Mobiliários, 53-76.
Chen, Y. (2018). Blockchain tokens and the potential democratization of entrepreneurship and innovation. Business Horizons, 567-575.
doi:https://doi.org/10.1016/j.bushor.2018.03.006
Chiu, I. H., & Greene, E. F. (2019). The Marriage of Technology, Markets and Sustainable (and) Social Finance: Insights from ICO Markets for a New Regulatory Framework.
European Business Organization Law Review, 139-169. doi:https://doi.org/10.1007/s40804-019-00138-y
Fisch, C. (2019). Initial coin offerings (ICOs) to finance new ventures. Journal of Business Venturing, 1-22. doi:https://doi.org/10.1016/j.jbusvent.2018.09.007
Howell, S., Niessner, M., & Yermack, D. (2018). nitial Coin Offerings: Financing Growth with Cryptocurrency Token Sales. NBER WORKING PAPER SERIES, 1-64. Retrieved from https://ssrn.com/abstract=3206449
Jong, A. d., Roosenboom, P., & Kolk, T. v. (2018). What determines success in Initial Coin Offerings? SSRN. doi:http://dx.doi.org/10.2139/ssrn.3250035
Kranz, J., Nagel, E., & Yoo, Y. (2019). Blockchain Token Sale: Economic and Technological Foundations. Business and Information Systems Engineering, 745-753.
doi:https://doi.org/10.1007/s12599-019-00598-z
Masiak, C., Block, J. H., Masiak, T., Neuenkirch, M., & Pielen, K. N. (2018). The Market Cycles of ICOs, Bitcoin, and Ether. doi:https://dx.doi.org/10.2139/ssrn.3198694
OECD. (2019). Initial Coin Offerings (ICOs) for SME Financing. Retrieved from www.oecd.org/finance/initial-coin-offerings-for-sme-financing.htm
Website:
Coinschedule. (2020, January 22). Coinschedule. Retrieved from https://www.coinschedule.com/