Vol. 34, No. 03, pp. 911 – 918, July – September, 2017 dx.doi.org/10.1590/0104-6632.20170343s20150619
* To whom correspondence should be addressed
LIQUID-LIQUID EQUILIBRIUM DATA,
VISCOSITIES, DENSITIES, CONDUCTIVITIES,
AND REFRACTIVE INDEXES OF POLY (VINYL
PYRROLIDONE)+ TRI-SODIUM CITRATE + UREA
AQUEOUS TWO-PHASE SYSTEMS AT DIFFERENT
PH
Mohsen Pirdashti
1,*, Kamyar Movagharnejad
2and Abbas Ali Rostami
11Chemical Engineering Department, Faculty of Engineering, Shomal University, PO Box 731,Amol, Mazandaran , Iran. *E-mail: [email protected]; [email protected]
2Faculty of Chemical Engineering, Babol University of Technology, PO Box, 484, Babol, Iran. E-mail: [email protected]
(Submitted: October 4, 2015; Revised: February 13, 2016; Accepted: April 15, 2016)
Abstract – The present study investigated liquid–liquid equilibria of polyvinylpyrrolidone (PVP) K30 + tri-sodium citrate + urea (5% and 10% mass) aqueous two-phase systems at 25°C and pH values of 6.2, 7.4, and 10.0. Results
showed that the binodal was displaced toward higher concentrations as the urea concentration increased. The effect of
pH, polymer/salt (w/w) ratio, urea concentration, tie line length, and slope of tie line on the partition behavior of urea was examined. The viscosity, density, electrical conductivity, and refractive index of PVP (K30) + tri-sodium citrate + urea + water two-phase systems were measured versus pH value. The relation between tie line length and the density and viscosity of the aqueous two-phase systems was also examined.
Keywords: Aqueous two-phase systems; Phase diagram; Urea; Viscosity; Polyvinylpyrrolidone
INTRODUCTION
An aqueous two-phase system (ATPS) is a liquid–liquid
extraction strategy that can efficiently separate biological
materials such as recombinant protein and enzymes (Albertsson, 1986; Hatti-Kaul, 2000). Polyethylene glycol (PEG) is an important component of two-phase partitioning. PVP is a water soluble polymer that can be applied with suitable salts to form ATPSs. This polymer is used in industrial production, medicine, and pharmacology
(Bühler, 2005; Wang et al.2000; Zafarani-Moattar et al. 2015). PVP is a biocompatible alternative that is an inexpensive and stable polymer with good potential for aqueous two-phase extraction (Zafarani-Moattar and Zaferanloo, 2009).
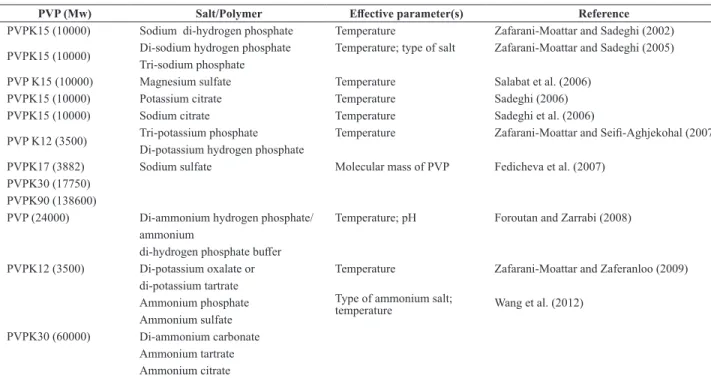
Citrates have applications in biochemical and chemical reactions. They are used as substitutes for inorganic salts to form ATPSs along with PVP for protein extraction. They are biodegradable, nontoxic, and can be directly discharged into biological wastewater treatment plants (Sadeghiet al.2006). Table 1 lists some ATPS containing PVP.
of Chemical
Inclusion body refolding is a vital step in the production of recombinant proteins. Solubilization of aggregated protein with denaturants such as guanidine hydrochloride and urea has been reported to be essential to recovery of active protein from the inclusion bodies (Clark, 2001). Urea is a powerful protein denaturant as it disrupts the noncovalent bonds in the proteins (Parnica and Antalika, 2014). Several articles have been written about the application of urea in ATPS for the initial recovery step (Rahimpour et al., 2010; Rämsch et al., 1999), but little has been published about the complex problem of how the urea
affects the phase diagram behavior or about determining its partition coefficient in ATPS.
Despite these favorable features, ATPSs have not been extensively adopted for either industrial or commercial applications. The main reason is lack of knowledge about the mechanisms involved in partitioning equilibria of macromolecules, the lack of a comprehensive theory that can predict experimental trends, and the empirical nature of the method. This lack of knowledge has motivated researchers to study ATPSs (Yan-Min et al., 2010; Rocha and Nerli, 2013).
The present study obtained phase equilibrium data for PVP (K30) + tri-sodium citrate (pH = 6.2, 7.4, and 10.0)
+ urea (5% and 10% (mass) + water at 25°C. The effect
of pH, PVP/salt ratio, urea concentration, tie line length (TLL), and slope of tie line (STL) on the partition behaviors of urea were also studied. The viscosity, density, electrical conductivity, and refractive index of the PVP + tri-sodium citrate + urea aqueous two-phase system and the top and bottom phases of the two-phase system were determined.
The relation between TLL and the density and viscosity of the ATPSs was also examined.
EXPERIMENTAL
Materials
PVP (K30; average MW = 60000; moisture content < 5.0% by mass fraction)was obtained from Aldrich. Tri-sodium citrate (anhydrous GR for analysis > 99%), Tri-sodium hydroxide (NaOH; mass purity > 0.99%) and sulfuric acid (95% to 97% H2SO4; GR for analysis > 95.0%) were obtained from Merck(Germany) and used without further
purification. Urea was purchased from Sigma-Aldrich.
Distilled, deionized water was used for the preparation of all solutions. All other materials were of analytical grade.
Apparatus and Procedure
The biphasic systems were prepared by mixing PVP (K30), tri-sodium citrate, and urea at the required pH. The composition of the mixture was determined by mass. Feed samples (10 g) were prepared by mixing appropriate amounts of polymer, salt, urea, and water in 15 ml graduated tubes using an analytical balance (A&D model GF300; Japan) with a precision of ±10−4 g at 25°C. To maintain a constant temperature (25°C) with an uncertainty of 0.05°C, the tubes were placed in a thermostatic bath (Memert model INE400; Germany). The pH values of the salt solutions were adjusted by mixing the appropriate ratio
Table 1. Parameters of ATPSs containing PVP that effect LLE
PVP (Mw) Salt/Polymer Effective parameter(s) Reference
PVPK15 (10000) Sodium di-hydrogen phosphate Temperature Zafarani-Moattar and Sadeghi (2002)
PVPK15 (10000) Di-sodium hydrogen phosphate Temperature; type of salt Zafarani-Moattar and Sadeghi (2005) Tri-sodium phosphate
PVP K15 (10000) Magnesium sulfate Temperature Salabat et al. (2006)
PVPK15 (10000) Potassium citrate Temperature Sadeghi (2006)
PVPK15 (10000) Sodium citrate Temperature Sadeghi et al. (2006)
PVP K12 (3500) Tri-potassium phosphate Temperature Zafarani-Moattar and Seifi-Aghjekohal (2007) Di-potassium hydrogen phosphate
PVPK17 (3882) Sodium sulfate Molecular mass of PVP Fedicheva et al. (2007) PVPK30 (17750)
PVPK90 (138600)
PVP (24000) Di-ammonium hydrogen phosphate/ Temperature; pH Foroutan and Zarrabi (2008) ammonium
di-hydrogen phosphate buffer
PVPK12 (3500) Di-potassium oxalate or Temperature Zafarani-Moattar and Zaferanloo (2009) di-potassium tartrate
PVPK30 (60000)
Ammonium phosphate Type of ammonium salt;
temperature Wang et al. (2012) Ammonium sulfate
of tri-sodium citrate, sodium hydroxide, and sulfuric acid. The pH values of the solutions were measured precisely with a Metrohm 827pH lab meter (Switzerland). For each mentioned system, 5% and 10% (w/w) samples of urea were produced.
The contents of the test tube were rigorously vortexed for 10 min before being placed in a 25°C thermostatic bath for 2 h. To separate the resulting phases, the tubes were centrifuged (Hermle Z206A; Germany) at 6000 rpm for 5 min. The phases showed no turbidity and the top and bottom samples were easily separated. The electrical conductivity and refractive index for each sample were measured at 298.15 K using a JENWAY 4510 model with a precision of 0.01µS-1mS and a refractometer (Ceti; Belgium)
with a precision of 0.0001 nD, respectively. All data measurements were conducted in duplicate and the average values were reported. The salt concentrations (Na3C6H5O7) were determined using atomic absorption spectroscopy (Shimatsu model AA-6300; Japan). The calibration plots of the refractive index and conductivity were prepared for the known polymer and urea compositions at the individual salt concentrations at 25°C. The measured values were then interpolated. The average relative deviation of the urea and polymer concentrations using this method was about 0.1% (wt).
RESULTS AND DISCUSSION
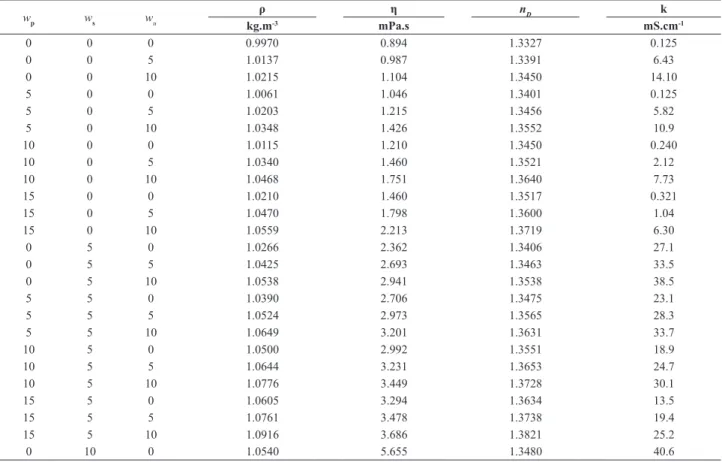
The viscosity, density, electrical conductivity, and refractive index of the PVPK30 + tri-sodium citrate + urea + water systems are shown in Table 2. Because the electrical conductivity and the refractive index of the phase samples depend on PVP (K30), urea, and salt concentration, calibration plots of the refractive index
versus polymer concentration were prepared for different
concentrations of salt and urea. Sample calibration plots for aqueous solutions of PVP (K30) + sodium citrate + urea + water are shown in Figure 1.
To increase the knowledge about ATPSs containing urea, phase diagrams of a range of systems based on PVP (K30) + sodium citrate + water at 298.15 K and pH values of 6.2, 7.4, and 10.0 in the presence of urea (5% and 10% mass) were determined. The experimental data of the binodal, tie line data, and STL for the PVP (K30) + sodium citrate + urea + water system at 25°C and the physical properties of the top and bottom phases are reported in Table 3.All concentrations are expressed as mass percentages.
The experimental data of the binodal for PVP (K30) + sodium citrate + denaturant + water systems at 25°C and pH 6.2 at urea concentrations of 5% and 10% (w/w) are plotted in Figure 2.
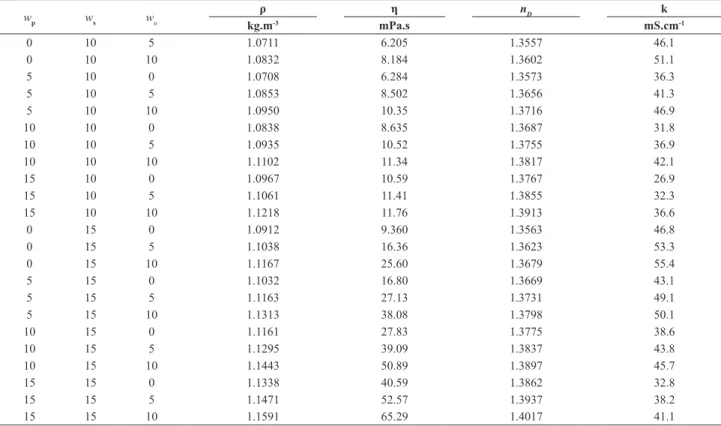
Table 2. Density(ρ), viscosity, refractive index (nD), and electrical conductivity (k) for aqueous single-phase system (PVP K30 (p) + tri-sodium citrate (s) + urea (u) + water system) at 298.15 K
wp ws wu ρ η nD k
kg.m-3 mPa.s mS.cm-1
0 0 0 0.9970 0.894 1.3327 0.125
0 0 5 1.0137 0.987 1.3391 6.43
0 0 10 1.0215 1.104 1.3450 14.10
5 0 0 1.0061 1.046 1.3401 0.125
5 0 5 1.0203 1.215 1.3456 5.82
5 0 10 1.0348 1.426 1.3552 10.9
10 0 0 1.0115 1.210 1.3450 0.240
10 0 5 1.0340 1.460 1.3521 2.12
10 0 10 1.0468 1.751 1.3640 7.73
15 0 0 1.0210 1.460 1.3517 0.321
15 0 5 1.0470 1.798 1.3600 1.04
15 0 10 1.0559 2.213 1.3719 6.30
0 5 0 1.0266 2.362 1.3406 27.1
0 5 5 1.0425 2.693 1.3463 33.5
0 5 10 1.0538 2.941 1.3538 38.5
5 5 0 1.0390 2.706 1.3475 23.1
5 5 5 1.0524 2.973 1.3565 28.3
5 5 10 1.0649 3.201 1.3631 33.7
10 5 0 1.0500 2.992 1.3551 18.9
10 5 5 1.0644 3.231 1.3653 24.7
10 5 10 1.0776 3.449 1.3728 30.1
15 5 0 1.0605 3.294 1.3634 13.5
15 5 5 1.0761 3.478 1.3738 19.4
15 5 10 1.0916 3.686 1.3821 25.2
wp ws wu ρ η nD k
kg.m-3 mPa.s mS.cm-1
0 10 5 1.0711 6.205 1.3557 46.1
0 10 10 1.0832 8.184 1.3602 51.1
5 10 0 1.0708 6.284 1.3573 36.3
5 10 5 1.0853 8.502 1.3656 41.3
5 10 10 1.0950 10.35 1.3716 46.9
10 10 0 1.0838 8.635 1.3687 31.8
10 10 5 1.0935 10.52 1.3755 36.9
10 10 10 1.1102 11.34 1.3817 42.1
15 10 0 1.0967 10.59 1.3767 26.9
15 10 5 1.1061 11.41 1.3855 32.3
15 10 10 1.1218 11.76 1.3913 36.6
0 15 0 1.0912 9.360 1.3563 46.8
0 15 5 1.1038 16.36 1.3623 53.3
0 15 10 1.1167 25.60 1.3679 55.4
5 15 0 1.1032 16.80 1.3669 43.1
5 15 5 1.1163 27.13 1.3731 49.1
5 15 10 1.1313 38.08 1.3798 50.1
10 15 0 1.1161 27.83 1.3775 38.6
10 15 5 1.1295 39.09 1.3837 43.8
10 15 10 1.1443 50.89 1.3897 45.7
15 15 0 1.1338 40.59 1.3862 32.8
15 15 5 1.1471 52.57 1.3937 38.2
15 15 10 1.1591 65.29 1.4017 41.1
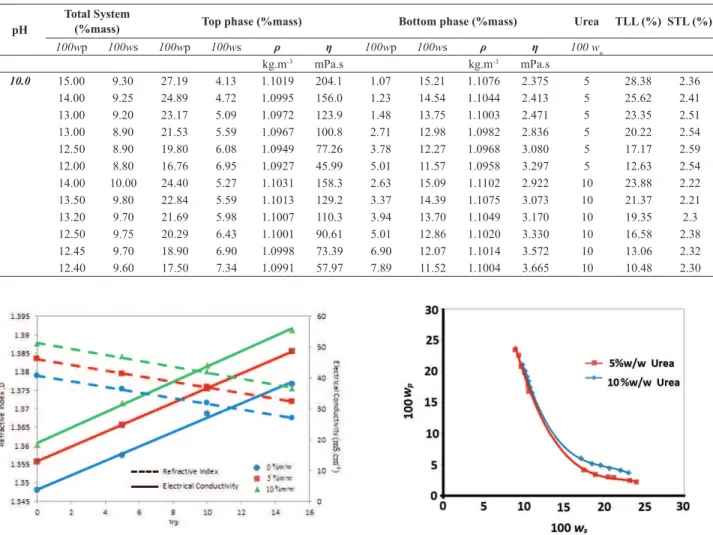
Table 3. Phase composition, tie line data, STL, and physical properties for PVP (K30) + sodium citrate + urea (5% w/w) + water system at 25°C
pH
Total System
(%mass) Top phase (%mass) Bottom phase (%mass) Urea TLL (%) STL (%)
100wp 100ws 100wp 100ws ρ η 100wp 100ws ρ η 100wu
kg.m-3 mPa.s kg.m-3 mPa.s
6.2 13.60 16.00 23.40 9.04 1.1254 181.0 2.20 24.08 1.1678 3.589 5 25.99 1.41 13.00 16.00 22.52 9.47 1.1256 161.4 2.45 23.29 1.1636 3.585 5 24.37 1.45 12.30 15.20 20.79 9.75 1.1232 124.4 2.88 21.26 1.1515 3.497 5 21.29 1.56 12.00 15.10 19.78 10.18 1.1232 106.7 3.02 20.62 1.1481 3.483 5 19.75 1.61 11.00 14.50 17.65 10.65 1.1202 72.73 3.37 19.01 1.1391 3.450 5 16.55 1.71 10.50 14.10 16.76 10.73 1.1187 61.16 4.10 17.53 1.1312 3.486 5 14.37 1.86 13.60 16.00 21.11 10.41 1.1296 139.6 5.20 22.10 1.1614 3.944 10 19.74 1.36 13.00 16.00 20.11 10.72 1.1292 120.3 5.30 21.00 1.1543 3.874 10 18.03 1.44 12.30 15.20 19.16 10.96 1.1282 102.6 5.50 19.80 1.1473 3.823 10 16.27 1.55 12.00 15.10 18.01 11.15 1.1265 83.42 5.70 19.00 1.1427 3.799 10 14.60 1.57 11.00 14.50 17.48 11.31 1.1264 75.95 6.50 18.00 1.1380 3.836 10 12.85 1.64 10.50 14.10 16.56 11.60 1.1257 63.68 7.20 17.00 1.1334 3.861 10 10.81 1.73
pH
Total System
(%mass) Top phase (%mass) Bottom phase (%mass) Urea TLL (%) STL (%)
100wp 100ws 100wp 100ws ρ η 100wp 100ws ρ η 100wu
kg.m-3 mPa.s kg.m-3 mPa.s
10.0 15.00 9.30 27.19 4.13 1.1019 204.1 1.07 15.21 1.1076 2.375 5 28.38 2.36
14.00 9.25 24.89 4.72 1.0995 156.0 1.23 14.54 1.1044 2.413 5 25.62 2.41 13.00 9.20 23.17 5.09 1.0972 123.9 1.48 13.75 1.1003 2.471 5 23.35 2.51 13.00 8.90 21.53 5.59 1.0967 100.8 2.71 12.98 1.0982 2.836 5 20.22 2.54 12.50 8.90 19.80 6.08 1.0949 77.26 3.78 12.27 1.0968 3.080 5 17.17 2.59 12.00 8.80 16.76 6.95 1.0927 45.99 5.01 11.57 1.0958 3.297 5 12.63 2.54 14.00 10.00 24.40 5.27 1.1031 158.3 2.63 15.09 1.1102 2.922 10 23.88 2.22 13.50 9.80 22.84 5.59 1.1013 129.2 3.37 14.39 1.1075 3.073 10 21.37 2.21 13.20 9.70 21.69 5.98 1.1007 110.3 3.94 13.70 1.1049 3.170 10 19.35 2.3 12.50 9.75 20.29 6.43 1.1001 90.61 5.01 12.86 1.1020 3.330 10 16.58 2.38 12.45 9.70 18.90 6.90 1.0998 73.39 6.90 12.07 1.1014 3.572 10 13.06 2.32 12.40 9.60 17.50 7.34 1.0991 57.97 7.89 11.52 1.1004 3.665 10 10.48 2.30 Table 3. Cont.
Figure 1. Refractive index and electrical conductivity calibration curves for PVP (K30) + sodium citrate + urea + water at 25°C (salt = 10% w/w)
Figure 2. Binodal of PVP (K30) + sodium citrate systems at 25°C and pH 6.2 versus urea concentration.
The TLL for the different compositionswith two phases
were calculated as:
(
) (
2)
2=
top−
bottom+
bottom−
topp p s s
TLL
C
C
C
C
The STL is the ratio of the difference between the
polymer concentration (CP) and the salt concentration (CS) in the top and bottom phases as:
−
=
−
top bottom
p p
bottom top
s s
C
C
STL
C
C
Figure 3 shows the effect of urea concentration on
equilibrium phase composition and on STL and TLL for PVP (K30) + sodium citrate + H2O system at a pH value
of 6.2. The influence of urea concentration on the binodal
curve for the PVP (K30) + sodium citrate ATPS at a constant pH is shown in Tables 2 and 3 and Figures 2 and 3. It can be observed that the binodal was displaced toward higher concentrations as the urea concentration increased and that the composition of the polymer-rich phase (and TLL) behaved in a slightly shorter manner. The STL decreased as
the urea concentration increased. This effect has also been
reported for urea (Creighton, 1993; Rämsch et al.1999; Silva and Meirelles, 2001) and guanidine hydrochloride (Pirdashti and Rahimpour, 2010; Pirdashti et al.2015).
The opposing components found in these systems are structure-making salts; urea is sometimes described as a structure-breaking agent. The combination of the two competing components on phase separation is interesting and cannot be predicted (Rämsch et al. 1999, Bertoluzzo
et al. 2007). Urea has a similar structure-breaking effect
on water and the preferential interaction with an aqueous interface (Annuziata et al. 2002). PVP is a hydrophilic
polymer. The effects of urea on water structure increased
the depletion force between the PVP-urea-water causing (1)
the ratio of PVP in the two phases to change and the phase regions to shrink.
Urea added to ATPS as a solute is divided between the
phases. Its partition coefficient, K, is defined as a function
of the equilibrium concentrations of the solute in the upper and lower phases as:
[
]
bottomtop[Solute Concentration]
K
Solute Concentration
=
Figure 4 is a diagram of the urea partition coefficient
versus TLL. It can be seen that, at a constant TLL,
the partition coefficient of urea increased as the urea
concentration increased. The partitioning coefficient
also increased as the TLL increased at a constant urea
concentration. The slope of the partition coefficient of urea
versus TLL decreased as the urea concentration increased. The results from Table 3 indicate that, at a constant
value of pH, the partition coefficient had a direct relation
with the PVP/salt ratio. At a constant pH, the partition
coefficient of urea increased as the PVP/salt ratio increased. In this case, the effect of urea concentration on the urea partition coefficient was more significant than the effect of the PVP/salt ratio. At a constant concentration of urea, the partitioning coefficient of urea decreased as the
pH increased. Table 2 shows that, as the pH increased, the slope and length of the equilibrium tie lines for the biphasic system increased.
Figure 3. Effect of urea concentration on equilibrium phase composition, STL, and TLL for PVP (K30) + sodium citrate + H2O system at a pH of 6.2 (■: total composition; : bottom phase composition; ●: top phase composition).
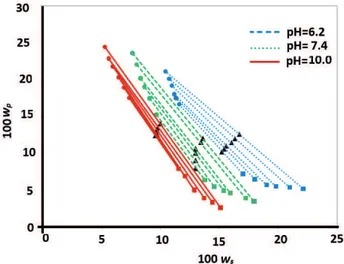
Figure 5. Effect of pH on equilibrium phase composition, STL, and TLL for PVP (K30) + tri-sodium citrate + H2O system ( : total composition; ■: bottom phase composition; ●: top phase composition)
Figure 6. Difference in viscosity (Δη), density (Δρ) and TLL for PVP (K30) + tri-sodium citrate + water vs. urea concentration at a pH value of 6.2.
Figure 4. Effect of TLL and urea concentration on partition coefficient of urea at different pH values for the ATPS.
Figure 5 shows the effect of pH on equilibrium phase
composition and on the STL and TLL for the PVP (K30) + tri-sodium citrate + H2O system. The TLL and STL increased as the pH increased, which is in agreement with the results of Perumalsamy and Murugesan (2009) and Shahbazinasab and Rahimpour (2012).This could be the result of the decrease in hydrodynamic volume of the polymers in solution.Waziri et al. (2003) and Shahbazinasab and Rahimpour (2012) reported that decreasing the pH decreased the intrinsic viscosity of the polymer solution. It is known that the hydrodynamic volume of polymers in solution is proportional to their intrinsic viscosity and that a decrease in pH creates a more compact structure for the polymer chains. It has been reported that, as the pH of the aqueous polymer-salt two-phase system increases, the concentration of the polymer-rich phase increases and the concentration of the salt-rich phase decreases.
Table 3 and Figure 6 show the relation between TLL
and the density and viscosity of the ATPS. The difference in density between phases (Δρ) and viscosity between phases (Δη) increased as TLL increased.
CONCLUSIONS
Urea was applied as a denaturant for the initial recovery steps to produce recombinant proteins in an ATPS. The
liquid–liquid equilibrium, effect of denaturant on phase diagram behavior, and partition coefficient in these
systems and the physical properties of ATPS are relatively
unknown. The effect of urea on the phase diagram behavior
of the PVP (K30) + tri-sodium citrate ATPS at 25°C was
investigated at different pH values (6.2, 7.4, and 10.0). The
calibration method was applied to measure the refractive index and conductivity of the phases.
The binodal was displaced toward higher concentrations as the urea concentration increased; the composition of the polymer-rich phase (and TLL) behaved in a slightly shorter manner. The STL decreased as the urea concentration increased. The density, viscosity, electrical conductivity, and refractive index of the aqueous single-phase system of PVP (K30) (p) + tri-sodium citrate (s) + urea (u) + water) at 298.15 K with the properties of ATPS were measured at
25°C. The partition coefficient of urea was shown to have
a direct relation with urea concentration, pH, TLL, and
PVP/salt ratio. The partition coefficient of urea increased
as the pH decreased and the PVP/salt (%w/w) ratio and urea concentration increased. The relation between TLL, density, and viscosity of the ATPS was also considered.
ACKNOWLEDGMENT
The authors would like to thank the anonymous reviewers and the editor for their insightful comments and suggestions.
REFERENCES
Albartson P.A. Partition of cell particles and macromolecules, 3nd ed., New York: Willy(1986).
Annuziata, O., Asherie, N., Lomakin, A., Pande, J., Ogun, O and
Benedek, G.B., Effect of Polyethylene Glycol on the
Liquid-Liquid Phase Transition in Aqueous Protein Solutions, PNAS, 99, No.22, 4165 (2002).
Bertoluzzo, M.G., Rigatuso, R., Farruggia, B., Nerli, B. and
Picó, G., Cosolutes Effects on Aqueous Two-Phase Systems
Equilibrium Formation Studied by Physical Approaches, Colloids Surf B Biointerfaces, 59, No.2, 134 (2007) .
Bühler, V., Excipients for Pharmaceuticals-Povidone, Crospovidone and Copovidone, Springer, Berlin, Heidelberg, New York, 1–254 (2005).
Clark, ED., Protein Refolding for Industrial Processes, Curr. Opin.Biotechnol.12, 202 (2001).
Creighton T. Proteins, 2nd ed.New York: W.H. Freeman and Co (1993).
Fedicheva, N., Ninni, L and Maurer, G., Aqueous Two-Phase Systems of Poly(vinyl pyrrolidone) and Sodium Sulfate: Experimental Results and Correlation/Prediction, J. Chem. Eng. Data, 52, No.2, 1858 (2007).
Foroutan, M and Zarrabi, M. Activities of Water, Polymer and Salt in Liquid–Liquid Equilibria of Polyvinylpyrrolidone and (NH4)2HPO4/(NH4)H2PO4 Buffer Using the Flory-Huggins Model with Debye–Huckel and Pitzer–Debye–Huckel
Equations and the Osmotic Virial Model: Effects of pH and
Temperature, Fluid Phase Equilib, 266, No1, 164 (2008).
Hatti-Kaul, Rajni (Ed.), Aqueous two-phase systems. Methods and Protocols. New York: Humana Press (2000).
Perumalsamy, M and Murugesan, T. Phase Compositions, Molar
Mass, and Temperature Effect on Densities, Viscosities, and
Liquid-Liquid Equilibrium of Polyethylene Glycol and Salt-Based Aqueous Two-Phase Systems, J. Chem. Eng. Data, 54, No 4 , 1359 (2009).
Rahimpour, F and Pirdashti, M. Effective Parameters on the Partition Coefficient of Guanidine Hydrochloride in the
Poly(ethylene glycol) + Phosphate + Water system at 298.15 K, Iran. J. Chem. Eng. 7, No.1, 67 (2010).
Rocha, M.V and Nerli, B.B. Molecular Features Determining
Different Partitioning Patterns of Papain and Bromelain in
Aqueous Two-Phase Systems. Int. J. Bio. Macromol., 61, No 2, 204 (2013).
Rämsch, Ch. Kleinelanghorst, L.B., Knieps. E.A., Hommes, J. and Kula, M.-R., Aqueous Two-Phase System Containing
Urea; Influence on Phase Separation and Stabilization of
Protein Conformation by Phase Components, Biotechnol. Prog. 15, No 3, 493 (1999).
Sadeghi, R., Measurement and Correlation of Vapor–Liquid Equilibria of the Poly (vinylpyrrolidone)+ NaH2PO4 + H2O
System at Different Temperatures, CALPHAD, 30, No 1, 53
(2006).
Sadeghi, R, Rafiei,H.R and Motamedi, M., Phase Equilibrium in Aqueous Two-Phase Systems Containing
Poly(vinylpyrrolidone) and Sodium Citrate at Different
Temperatures-Experimental and Modeling, Thermochimica Acta, 451, No 1, 163 (2006).
Shahbazinasab, M-K and Rahimpour, F. Liquid−Liquid
Equilibrium Data for Aqueous Two-Phase Systems Containing PPG725 and Salts at Various pH Values, J. Chem. Eng. Data, 57, No 7, 1867(2012).
Silva, L.H. M. D and Meirelles, A.J.D.A. PEG + Potassium Phosphate + Urea Aqueous Two-Phase Systems: Phase Equilibrium and Protein Partitioning, J. Chem. Eng. Data, 46, No 2, 251 (2001).
Parnica, M. and Antalika, M., Urea and Guanidine Salts as Novel Components for Deep Eutectic Solvents, J. Mol. Liq. 197, No 1 , 23(2014).
Pirdashti, M., Movagharnejad, K., Curteanu, S., Dragoi, E.N
and Rahimpour, F., Prediction of Partition Coefficients of
Guanidine Hydrochloride in PEG–Phosphate Systems Using
Neural Networks Developed with Differential Evolution
Algorithm, J. Ind. Eng. Chem, 27, No 1,268(2015).
Wang, Z.H., Song, M. and Ma, Q., Two-Phase Aqueous Extraction of Chromium and its Application to Speciation Analysis of Chromium in Plasma, Mikrochim. Acta, 134, No 1, 95-99 (2000).
Waziri, S.M., Abu-Sharkh, B.F., Ali, S.A. The Effect of pH and
Salt Concentration on the Coexistence Curves of Aqueous Two-Phase Systems Containing a pH Responsive Copolymer and Polyethylene Glycol, Fluid Phase Equilib, 205, No 2, 275 (2003).
Yan-Min, L., Yan-Zhao, Y., Xi-Dan, Z., Chuan-Bo, X., Bovine Serum Albumin Partitioning in Polyethylene glycol (PEG)/ Potassium Citrate Aqueous Two-Phase Systems. Food Bioprod. Process, 88, No.1, 40 (2010).
Zafarani-Moattar, M.T and Sadeghi, R., Measurement and Correlation of Liquid–Liquid Equilibria of the Aqueous Two-Phase System Polyvinylpyrrolidone–Sodium Dihydrogen Phosphate, Fluid Phase Equilib, 203, No 1, 177 (2002).
Zafarani-Moattar, M.T and Sadeghi, R., Effect of Temperature
on the Phase Equilibrium of Aqueous Two-Phase Systems Containing Polyvinylpyrrolidone and Disodium Hydrogen Phosphate or Trisodium Phosphate , Fluid Phase Equilib, 238, No 1, 129 (2005).
Zafarani-Moattar, M.T and Seifi-Aghjekohal, P., Liquid–Liquid
Equilibria of Aqueous Two-Phase Systems Containing Polyvinylpyrrolidone and Tripotassium Phosphate or Dipotassium Hydrogen Phosphate: Experiment and Correlation, CALPHAD, 31, No 4, 253 (2007).
Zafarani-Moattar, M.T and Zaferanloo, A., Measurement and Correlation of Phase Equilibria in Aqueous Two-Phase Systems Containing Polyvinylpyrrolidone and Dipotassium
Tartrate or Di-potassium Oxalate at Different Temperatures,
J. Chem. Thermodynamics, 41, No7, 864 (2009).
Zafarani-Moattar ,M.T., Karimi,N and Asadzadeh, B. Investigations of the Interactions in Aqueous Poly (vinyl pyrrolidone) + Di-sodium Hydrogen Citrate Solutions Using
Vapor–Liquid Equilibria Studies at Different Temperatures, J.