Ana Cristina Dias da Mata
Licenciada em Ciências da Engenharia Química e Bioquímica
The agroindustrial residue valorisation with
high pressure CO
2within biorefinery
concept
Dissertação para obtenção do Grau de Mestre em
Engenharia Química e Bioquímica
Orientador: Rafal Bogel-Lukasik
Presidente: Doutora Ana Aguiar Ricardo Arguente: Doutora Susana Filipe Barreiros
Vogal: Doutor Rafal Bogel-Lukasik
I “Copyright” Ana Cristina Dias da Mata, FCT/UNL e UNL
III Agradecimentos
Em primeiro lugar gostaria de agradecer ao Doutor Rafal Lukasik que se disponibilizou para me orientar durante a tese de mestrado. Pelas oportunidades proporcionadas ao longo deste período a nível profissional, pelos conhecimentos transmitidos, colaboração, paciência e disponibilidade para ajudar.
À Rita Morais pelo constante acompanhamento e ensinamentos durante esta fase. Pela ajuda que me deu sempre que precisei, pelo incentivo e positivismo sempre presentes.
Agradeço a todas as pessoas da Unidade de Bioenergia pela forma como fui recebida, e em especial à Sofia, Rita, André e Rute pela boa disposição, companheirismo, preocupação e pela disponibilidade para ajudar.
Um agradecimento muito especial ao Héber pelo carinho, amizade, confiança e incondicional apoio que sempre demonstrou.
Quero agradecer também à Sara, Margarida, Catarina, Liliana e Tiago pela amizade, apoio e bons momentos partilhados ao longo destes anos de faculdade.
V Abstract
Wheat straw is an agricultural residue with low commercial value and is the second most abundant raw material in the world.
With the aim of its valorisation within a biorefinery concept, the effect of high pressure CO2-H2O approach on the xylo-oligosaccharides production and on the digestibility of cellulose was studied. The parameters studied in the high-pressure CO2-H2O reactions were temperature (35, 130, 215 and 225ºC), pressure of CO2 (0, 15, 30, 45 and 54 bar), biomass loading (150 g of H2O·15 g dry wheat straw-1 and 100 g of H
2O·10 g dry wheat straw-1) and time of reaction (0, 30, 60, 90 and 180 min). It was found that in situ formed carbonic acid enhanced hydrolysis of major hemicellulose compound - xylan to xylo-oligosaccharides since an increase of 45% of xylo-oligosaccharides yield was observed when comparing autohydrolysis with CO2-H2O approach. The physical and chemical effect of CO2 presence also enhances the enzymatic digestibility of cellulose. It was obtained an 82% glucan to glucose yield with 54 bar of CO2 that corresponds to a 26% improvement when comparing it with the autohydrolysis processed straw. FT-IR analysis was employed to study the compositional changes regarding cellulose crystallinity and the SEM measurements allowed the analysis of the effect of high-pressure CO2-H2O on morphology of the solid residue.
VII Resumo
A palha de trigo é um resíduo agrícola de baixo valor comercial sendo a segunda matéria-prima mais abundante a nível mundial.
Com o objectivo da valorização da palha de trigo, integrada no conceito de biorefinaria, foi estudado o efeito do sistema CO2-H2O a altas pressões como pré-tratamento na produção de xilo-oligossacáridos e na digestibilidade enzimática da celulose. Os vários parâmetros estudados foram a temperatura (35, 130, 215 e 225ºC), pressão (0, 15, 30, 45 e 54 bar), quantidade de água e biomassa adicionada ao reator (100 g de água·10 g de palha de trigo-1 e 150 g de água·15 g de palha de trigo-1) e o tempo de reacção (0, 30, 60, 90 e 180 minutos).
Verificou-se que o ácido carbónico formado em solução melhorou a hidrólise do xilano, contido na hemicelulose, a oligossacáridos pois foi observado um aumento de 45% do rendimento em xilo-oligossacáridos quando comparando a autohidrólise ao pré-tratamento com CO2-H2O. O efeito químico e físico da presença do CO2 também mostrou melhorar a digestibilidade enzimática da celulose. Foi obtido um rendimento de conversão de glucano a glucose de 82% com 54 bar de CO2, o que corresponde a uma melhoria de 26% quando comparando à palha processada por autohidrólise. A análise por FT-IR foi empregue para estudar as alterações composicionais relacionadas com a cristalinidade da celulose e as medições por SEM permitiram a análise do efeito do pré-tratamento na morfologia do resíduo sólido.
IX List of Publications
XI List of Contents
AGRADECIMENTOS ... III
ABSTRACT ... V RESUMO ... VII
LIST OF PUBLICATIONS ... IX
LIST OF FIGURES ... XIII
LIST OF TABLES ...XV
NOMENCLATURE ...XVII
1. INTRODUCTION ... 1
1.1. GREEN CHEMISTRY ... 1
1.2. LIGNOCELLULOSE BIOMASS ... 2
1.3. BIOMASS PRE-TREATMENTS ... 6
1.3.1. Pre-treatment products ... 8
1.4. HIGH DENSITY FLUIDS ... 9
1.5. ENZYMATIC HYDROLYSIS ... 11
2. OBJECTIVES ... 13
3. MATERIALS AND METHODS ... 15
3.1. MATERIALS ... 15
3.2. HIGH PRESSURE CO2-H2O PRE-TREATMENT OF WHEAT STRAW ... 15
3.3. CHEMICAL ANALYSES ... 17
3.3.1. Solids moisture determination ... 17
3.3.2. Liquors dry weight determination ... 17
3.3.3. Characterisation of the feedstock material composition ... 17
3.3.4. Characterisation of the processed solids ... 18
3.3.5. Liquor and post-hydrolysate characterisation ... 18
3.4. GAS PHASE ... 18
3.5. FT-IR MEASUREMENT OF CELLULOSE CRYSTALLINITY ... 18
3.6. SEM ANALYSIS ... 19
3.7. ENZYMATIC HYDROLYSIS ... 19
3.7.1. Characterisation of the samples composition ... 20
3.8. QUANTIFICATION OF TOTAL PHENOLICS ... 20
4. RESULTS AND DISCUSSION ... 21
XII
4.2. HIGH-PRESSURE CO2-H2O ... 21
4.2.1. Effect of reaction severity on pre-hydrolysate composition ... 21
4.2.2. Hydrolysate pH ... 27
4.2.3. Effect of reaction severity on gas phase composition ... 28
4.2.4. Effect of severity on solid phase composition ... 29
4.2.5. Characterisation of cellulose crystallinity of pre-treated solids ... 30
4.2.6. Effect of high-pressure CO2-H2O on morphology of wheat straw ... 32
4.2.6.1. Scanning Electron Microscopy ... 32
4.3. ENZYMATIC HYDROLYSIS OF PRE-TREATED SOLIDS ... 34
4.3.1. Effect of CO2 pressure ... 34
4.3.2. Effect of temperature ... 36
4.3.3. Effect of reaction time ... 38
4.3.4. Effect of CO2/dry biomass ratio ... 39
4.4. PROCESS OVERVIEW ... 40
5. CONCLUSIONS AND OUTLOOK ... 43
5.1. PERSPECTIVES ... 44
6. REFERENCES ... 45
7. APPENDIX ... 53
ANNEX A–DETERMINATION OF THE PARTIAL PRESSURE OF CO2... 53
ANNEX B–DATA FOR THE DETERMINATION OF CO2 DENSITY ... 54
ANNEX C–DETERMINATION OF FEEDSTOCK AND SOLID RESIDUES ... 54
ANNEX D–DETERMINATION OF PERCENT DIGESTIBILITY OF CELLULOSE ... 55
XIII List of Figures
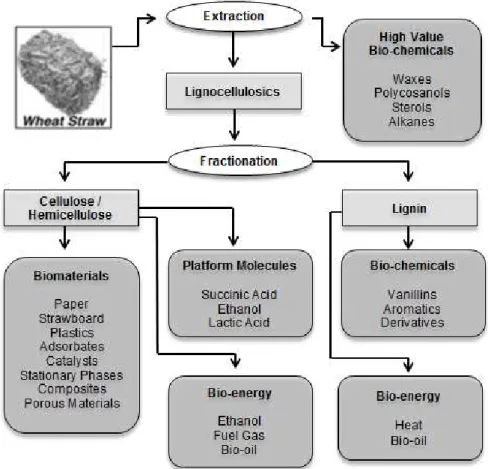
Figure 1.1 – Wheat straw biorefinery concept. Adapted from9 ... 2
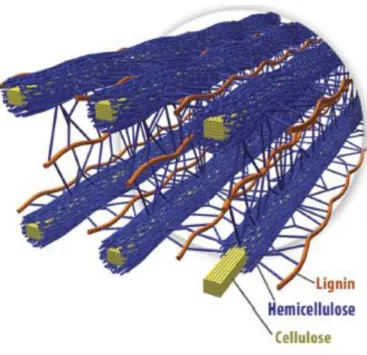
Figure 1.2 – Spatial arrangement of cellulose hemicellulose and lignin in the cell walls of lignocellulosic biomass.13 ... 3
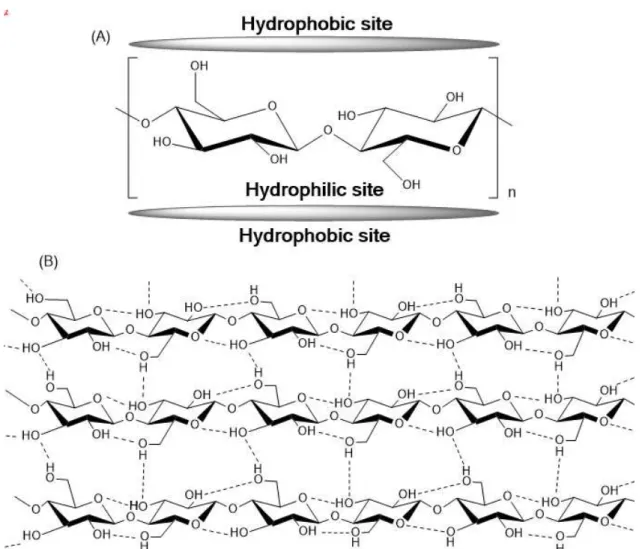
Figure 1.3 – (A) Hydrophilic and hydrophobic sites of cellulose. (B) Schematic drawing of the intrasheet hydrogen-bonding network in cellulose.21 ... 4
Figure 1.4 – Hexoses and pentoses typically found in hemicellulose.13 ... 5
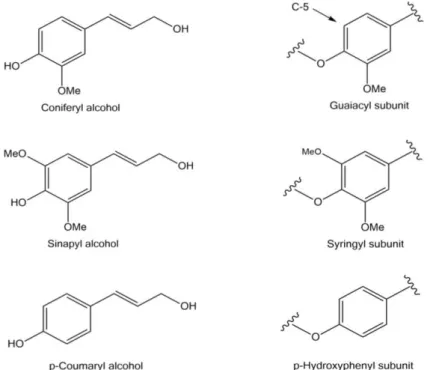
Figure 1.5 – The three lignin monolignols.13... 5
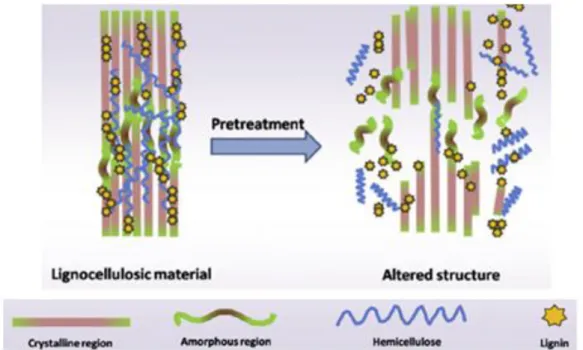
Figure 1.6 – Effect of pre-treatment in the structure of lignocellulosic biomass. Adapted from 17 ... 6
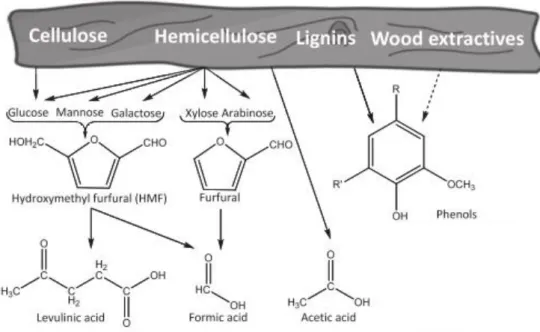
Figure 1.7 – Degradation products of cellulose, hemicellulose and lignin.42 ... 9
Figure 1.8 – CO2 pressure-temperature phase diagram.49 ... 9
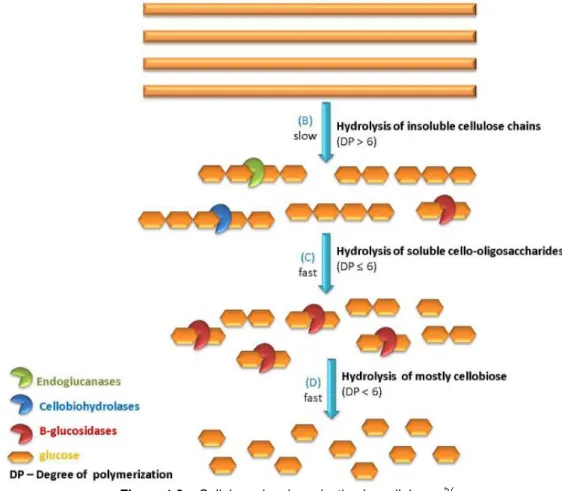
Figure 1.9 – Cellulose depolymerization by cellulases.57 ... 12
Figure 3.1 – Scheme of the high pressure CO2-H2O pre-treatment apparatus. ... 16
Figure 4.1 – Content in furfural (g·L-1) of the recovered gas phase as a function of number of moles of CO2. 150/15 and 100/10 represent the ratio between mass of water and mass of biomass. ... 28
Figure 4.2 – Composition of the solids and solid yield obtained after high-pressure CO2-H2O ... 30
Figure 4.3 – The FT-IR spectra of untreated (black line), autohydrolysis (red line) and CO2 processed wheat straw (green line) showing the regions for LOI determination. ... 31
Figure 4.4 – SEM images of untreated wheat straw (A,B), autohydrolysis (C,D) and treated at 225ºC with 45 bar of CO2 (E,F). ... 33
Figure 4.5 – Effect of CO2 pressure of high-pressure CO2-H2O on enzymatic hydrolysis yield ... 34
Figure 4.6 – The schematic representation of both physical and chemical effect of high pressure processes of wheat straw valorisation. ... 36
Figure 4.7 – Effect of temperature of high-pressure CO2-H2O on enzymatic hydrolysis. ... 37
Figure 4.8 – Effect of CO2/biomass mass ratio on glucose yield. ... 39
Figure 4.9 – The mass balance of integrated polysaccharide conversion. ... 40
Figure 4.10 – Mass balance of xylan and glucan whithin the overall process for the autohydrolysis pre-treatment... 40
XV List of Tables
Table 1.1 – Typical chemical composition of various lignocellulosic materials.16 ... 3
Table 1.2 – Range of thermophysical properties of gases, supercritical fluids and liquids.49 ... 10
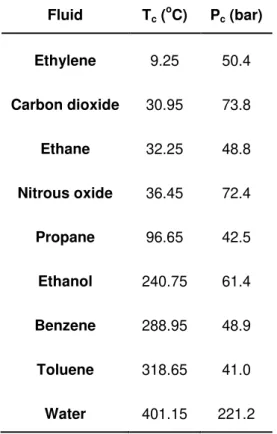
Table 1.3 – Critical parameters of several fluids49 ... 10
Table 4.1 – Macromolecular composition of wheat straw (% of dry weight) ... 21
Table 4.2 – Composition of liquors (g·L-1) of each product present in the liquors (g·100 g-1 of the initial amount present in the feedstock) obtained after high-pressure CO2-H2O of wheat straw at 130ºC. .... 25
Table 4.3 – Composition of liquors (g·L-1) of each product present in the liquors (g·100 g-1 of the initial amount present in the feedstock) obtained after high-pressure CO2-H2O of wheat straw at 215ºC and 225ºC. ... 26
Table 4.4 – The LOI index for untreated, autohydrolysis and CO2-treated wheat straw ... 31
XVII Nomenclature
A Absorbance
AcOS Acetyl groups bounded to oligosaccharides
AFEX Ammonia fiber explosion
Arn Arabinan
Ara Arabinose
CP Critical point
Combined Severity factor
DP Degree of polymerization
FT-IR Fourier Transform Infrared Spectroscopy
FPU Filter paper units
F Correction factor
GlcOS Gluco-oligosaccharides
Gn Glucan
Glc Glucose
GAc Acetyl groups
HPLC High Pressure Liquid Chromatography
HMF 5-Hidroxymethylfurfural
kg Kilogram
keV Electronvolt
K Kelvin
kH Henry’s constant
R0 Severity factor
L Liter
LK Klason Lignin
LOI Lateral Order Index
m Meter
XVIII
M Molar
min Minute
MΩ Megaohm
NREL National Renewable Energy Laboratory
n moles
N Normality (concentration)
OS Oligosaccharides
pNPGU p-nitrophenyl-β-D-galactopyranoside units pCO2 pressure of carbon dioxide
pCO2initial initial pressure of CO2 in the beginning of reaction
pCO2final final pressure of CO2 in the reaction
p Pressure
pc Critical pressure
PR-EOS Peng-Robinson equation of state AIR Acid insoluble residue weight
rpm Rotations per minute
R Gas constant
SY Solid Yield
scCO2 Supercritical carbon dioxide SCF Supercritical fluids
SEM Scanning Electron Microscopy
t Time
T Temperature
Tc Critical temperature
T0 Initial temperature
TP Triple point
UV/Vis Ultraviolet/visível
v Volume
w Weight
XIX
XOS Xylo-oligosaccharides
x mole fraction
Xn Xylan
Xyl Xylose
€ Euro
Ø Diameter
ρ Density
1 1. Introduction
1.1. Green Chemistry
Green chemistry is a recent field of chemistry with the purpose of introducing clean processes in chemical manufacturing industries. It is defined as the “design of chemical products and processes to
reduce or eliminate the use and generation of hazardous substances”.1 Green chemistry is governed
by 12 principles established by Anastas and Warner2: (a) prevention, (b) atom economy, (c) less hazardous chemical syntheses, (d) design for safer chemicals, (e) safer solvents and auxiliaries, (f) design for energy efficiency, (g) use of renewable feedstocks, (h) reduction of derivatives, (i) catalysis, (j) design for degradation, (k) real-time analysis for pollution prevention and (l) inherently safer chemistry for accident prevention. The mentioned principles are guidelines for the development of alternative processes which should be applied to whole lifecycle of a product.1 An ideal process should use non-polluting feedstocks, generate no secondary products and require no solvents for the chemical conversion, or to isolate and purify the product.3 The main objective of green chemistry is to achieve sustainable development, in other words, it aims to fulfill the needs of the present society without compromising the ability of the future generations to meet their own needs.4
Today’s economy and lifestyle are strongly dependent on fossil fuels.5 However their intense use,
non-renewable nature and limited reservoir will inevitably lead to its depletion, thus searching for another resources is urgent.6 Besides oil feedstock availability, there is also the environmental aspect which is
likewise a driver into shifting resources’ feedstocks to more sustainable alternatives.4,5
Biomass is the only viable alternative to fossil fuels since, in addition to them, is the only rich source of carbon with a lifespan measured in years, that is much shorter than that for fossil fuels (hundreds of millions of years).4,5 The use of biomass fits in the ambit of a biorefinery. A biorefinery is a concept analogous to a petroleum refinery.7 It is a facility that uses biomass as input with the objective of converting it into materials, value-added products, fuels and energy, through the combination of diverse technologies.8 However, the use of a sustainable feedstock, such as biomass, is not sufficient to ensure a sustainable future, and that is why integration of green chemistry with biorefineries is required.4 The application of green technologies to the transformation of low value and widely available biomass feedstocks allows the development of sustainable chemicals and materials.5
Unlike oil, biomass has diverse composition depending on species, climacteric conditions and many others variables. Therefore, for an economic and technological feasibility, a biorefinery must be able to process different feedstocks with different composition.4 Thus an integrated production of value-added products, materials and energy (biofuels) may provide economic, energetic and social feasibility to the biorefinery.8
Figure 1.1 provides an example of an agricultural by-product (wheat straw) that can be the basis of a
biorefinery since it’s possible to obtain a variety of value-added biochemical, materials and also
2
Figure 1.1 –Wheat straw biorefinery concept. Adapted from9
The biorefinery concept can be accomplished through two main platforms, thermochemical and biochemical. The biochemical platform consists in variety of processes such as extraction, separation and biological conversion of biomass into biofuels, biomaterials and biochemicals. The thermochemical platform produces syngas or bio-oil through thermal treatment processes, that after can be converted into energy, fuels, materials and chemicals.8,10
1.2. Lignocellulose Biomass
3
Figure 1.2 –Spatial arrangement of cellulose hemicellulose and lignin in the cell walls of lignocellulosic biomass.13
As it was aforementioned the chemical composition of biomass depends on many variables and examples are given in Table 1.1.16
Table 1.1 –Typical chemical composition of various lignocellulosic materials.16
Raw material Lignin (%) Cellulose (%) Hemicellulose (%)
Hardwoods 18 - 25 45 - 55 24 - 40
Softwoods 25 - 35 45 - 50 25 - 35
Grasses 10 - 30 25 - 40 25 - 50
Cellulose, the main component of lignocellulosic biomass, is a homopolymer consisting of D-glucose
units linked together by β-(1,4)-glycosidic bonds which results in a linear glycan chain.17,18 The basic
repeating unit is cellobiose which is a disaccharide of D-glucopyranose.19 Cellulose chains have a degree of polymerisation with a range of 500 to 25000.16 The hydrogen bonds present in the cellulose structure allow the formation of microfibrils that consists of cellulose chains packaged together, with amorphous and crystalline regions.20
4
thus giving to these regions a hydrophobic nature. These hydrophobic spots must contribute to the insolubility of cellulose under normal conditions.19
Figure 1.3 – (A) Hydrophilic and hydrophobic sites of cellulose. (B) Schematic drawing of the intrasheet hydrogen-bonding network in cellulose.21
Hemicelluloses are a heterogeneous class of polymers that contains pentoses (xylose and arabinose), hexoses (glucose, galactose and mannose), as can be seen in Figure 1.4., and also branched groups such as acetyl and methyl groups and cinnamic, glucuronic and galacturonic acids.13 These polymers are classified accordingly to the main sugar residue present in the backbone, which include for example, mannans, glucans and xylans, the last two being the most prevalent.19 The fact that they present a low degree of polymerization (100-200)13 and a branched structure provides them an amorphous nature and therefore, are generally much easily hydrolysed in comparison with cellulose.13,22
5
Figure 1.4 –Hexoses and pentoses typically found in hemicellulose.13
Lignin is an aromatic, heterogeneous polymer, biosynthesised from three phenylpropanoids percursors: coniferyl, sinapyl and p-coumaryl alcohols which when integrated in lignin polymer are called guaiacyl, siringyl and p-hydroxyphenil respectively, (Figure 1.5) according to their aromatic ring. The composition of lignin varies between hardwoods, softwoods and grasses, which has great effect on biomass deconstruction.13
Figure 1.5 – The three lignin monolignols.13
6 1.3. Biomass pre-treatments
A variety of factors in the lignocellulosic structure of biomass influences the capacity of their conversion into valuable products.12 Crystallinity of cellulose, degree of polymerization, moisture content, available surface area or lignin content are some of factors constituting a barrier for the conversion of these materials.28,29 To overcome these problems, it is necessary to introduce an intermediate step, named pre-treatment, with the focus on altering or removing structural and compositional impediments for hydrolysis.12,28 A schematic representation of the pre-treatment effect on the lignocellulosic structure is shown in Figure 1.6.
Figure 1.6 –Effect of pre-treatment in the structure of lignocellulosic biomass. Adapted from 17
The desired pre-treatment process should (i) produce highly digestible solids, enhancing sugar yields during enzyme hydrolysis, (ii) avoid degradation of sugars, (iii) minimise the formation of inhibitors for subsequent fermentation steps, (iv) be cost effective by operating in reactors of moderate size and (v) minimise heat and power requirements.17,30
7
of the acid present.14 The concentrated-acid processes operate at low temperatures with acid concentrations of 72% H2SO4 whilst dilute-acid processes use high temperatures, concentrations in the range 0.5-1.5% and requires a two-step hydrolysis.14 In an alkaline hydrolysis it is believed that a saponification reaction occurs, which leads to the cleavage of the intermolecular ester bonds crosslinking xylan, hemicellulose and other components.29,32 Sodium hydroxide and lime are bases that showed to be effective to disrupt the lignin structure.33 In organosolv method an organic solvent mixture with inorganic acid catalysts (H2SO4, HCl) is used to break the internal lignin and hemicellulose bonds. Methanol, ethanol, acetone and ethylene are some of the organic solvents employed in this technique. 12,31
Ionic liquids are a class of solvents used in pre-treatments relatively recently.33,34 These green solvents are composed of ions with countless combinations of cations and anions, allowing them to be adapted to increase their power of dissolution of carbohydrates.35
Within the physico-chemical class of pre-treatments, the processes that uses both physical and chemical effects in order to break the structure of the lignocellulosic material are included.30 In an explosion pre-treatment a gaseous substance (steam, CO2) is introduced in the system and high pressures and temperatures (160 to 260ºC) are applied for a determined period of time (seconds to minutes), after which an explosive release of the pressure occurs.36 The rupture of the linked acetyl groups with hemicelluloses generates acetic acid and the acidic nature of water at high temperatures,18 promotes hydrolysis of hemicelluloses and breaks down the glycosidic bonds between hemicellulose and cellulose. This process represents the chemical technique whilst the physical one comes from the rapid decompression of the system where expansion causes the vaporisation of saturated fluid within the fibrils, breaking down the molecular linkages.30 In ammonia fiber explosion (AFEX) the material is subjected to liquid ammonia-water mixtures under high pressures and moderate temperatures (90 to 100ºC) prior to rapid depressurisation.37,36,38 Liquid hot water, also known as autohydrolysis or subcritical pre-treatment, uses high temperatures and pressures to keep water in the liquid state to dissolve hemicellulose leaving cellulose more accessible.29,36,38 Autohydrolysis pre-treatment consists in reactions between the hydronium ions generated from water and acetic acid groups released from hemicelluloses and the glycosidic bonds of lignocellulose.36,38,39 The conversion of polysaccharides into oligomers and, at less extent, into monomers is the result of these reactions.39 The nature of autohydrolysis provides lower by-products generation and minor problems related to equipment corrosion.40
8
almost complete immiscibility in water at atmospheric conditions.18,41 It is important to note that in CO 2 explosion biomass is subjected to explosive decompression while in water-CO2 pre-treatment a slow depressurisation occurs.
1.3.1. Pre-treatment products
Several compounds can result from the hydrolysis of hemicellulose such as pentose and hexose sugars (either in oligomer or monomer form), aliphatic acids (acetic, formic and levulinic) and furan aldehydes (5-hydroxymethylfurfural and furfural). Lignin and cellulose mostly remain as a solid residue, although minor part of it is degraded to phenolics and other aromatic compounds and gluco-oligosaccharides (GlcOS) respectively.42
Xylo-oligosaccharides (XOS) are sugar oligomers produced during the hydrolysis of xylan, the major component of plant hemicelluloses.43 They are formed by xylose units with a varying structure depending on degree of polymerization, monomeric units and types of linkages. The number of xylose residues forming the structure can vary from 2 to 10, and they are linked through β-(1-4)-linkages. In addition to xylan, side groups such as α-D-glucopyranosyl, uronic acid, acetyl groups or arabinofuranosyl residues may be present, providing XOS diverse biological properties. At industrial scale, XOS are produced from xylan-rich lignocellulosic materials (straw, bagasse, corn cobs) and enzymatic and chemical methods or a combination of both of them.44 Oligosaccharides have been a subject of special interest due to their prebiotic properties. They present physiological importance such as, reducing cholesterol level, maintaining the gastrointestinal health, improving the biological availability of calcium, among others.43 XOS applications includes food (antiobesity diets), pharmaceutical (prevention and treatment of gastrointestinal infections), feed (for domestical animals) or agricultural (Growth stimulator and accelerator) fields.45 In addition they also have important physico-chemical properties which include stability over a wide range of pH and temperatures, sweetener, retain the moisture of food and control the microbial activity as well.46,47 XOS have an
estimated market price of 16€/kg which makes them potential value-added products from agricultural
waste.46
9
Figure 1.7 –Degradation products of cellulose, hemicellulose and lignin.42
1.4. High density fluids
Supercritical fluids (SCF) are gases above their critical temperature and pressure.48 Figure 1.8 presents a CO2 pressure-temperature phase diagram, showing the critical point (CP) where the distinction between gas and liquid ceases.49 Correspondent values of temperature and pressure are designated by critical pressure and critical temperature.49
Figure 1.8 –CO2 pressure-temperature phase diagram.49
10
Typical density, viscosity and diffusion values of liquids, gases and supercritical fluids are listed in Table 1.2. As it can be seen, the transport properties such as viscosity and diffusion of a supercritical fluid are between those of liquids and gases. This indicates that these fluids are capable for a faster and deeper penetration into a solid matrix. Also, their intermediate densities points to a similar solvent power to those of liquids.48,49,50 Furthermore, their dissolution power is controllable through temperature and pressure variations close to the critical region. 49,51
Table 1.2 –Range of thermophysical properties of gases, supercritical fluids and liquids.49
Fluid state
Density
(g·L)
Diffusion coefficient (m2·s)
Viscosity
(kg·m-1·s-1)
Gas 1 - 100 10-4 - 10-5 10-5 - 10-4
Supercritical
fluid 250 - 800 10
-7 - 10-8 10-4 - 10-3
Liquid 800 - 1200 10-8 - 10-9 10-3 - 10-2
Carbon dioxide is probably the most commonly used SCF because is a non-flammable, non-corrosive, cheap gas and can be obtained in large scale with diverse purity grade.48,50 Furthermore, among the various supercritical fluids listed in Table 1.3, carbon dioxide has the critical point easily achievable at the industrial conditions.
Table 1.3 –Critical parameters of several fluids49
Fluid Tc ( o
C) Pc (bar)
Ethylene 9.25 50.4
Carbon dioxide 30.95 73.8
Ethane 32.25 48.8
Nitrous oxide 36.45 72.4
Propane 96.65 42.5
Ethanol 240.75 61.4
Benzene 288.95 48.9
Toluene 318.65 41.0
11
Working with fluids in their supercritical region or closed to it provides advantages due to properties acquired in that circumstances. When joining CO2 and water, interaction between them origins in the formation of carbonic acid according to equation 1.1.52
Equation 1.1 –Equilibrium reaction between water and CO2 with carbonic acid formation.52
Carbonic acid is unstable and a weak acid that acts as a catalyst of the reaction of biomass hydrolysis. Its formation causes the decrease of the pH of aqueous solution to a favourable value for the biomass hydrolysis.52 The increase of pressure decreases the pH and the increase of temperature increases it, (due to the lower solubility of CO2 in water),53 it is possible, by controlling the pressure and temperature conditions, to adjust the effectiveness of carbonated water as solvent for biomass depolymerization.52
1.5. Enzymatic hydrolysis
The possible alternative solution for the petroleum-based liquid fuels is the production of bioethanol from lignocellulosic biomass.54 There are two main routes to accomplish bioethanol production, either enzymatically or chemically employing acids.55,56 The current pathway for ethanol conversion includes an enzymatic hydrolysis step which is described as a heterogeneous reaction system in which enzymes in an aqueous environment react with the insoluble, macroscopic and structured cellulose, containing highly and less ordered regions.57 This reaction provides the depolymerisation of the cellulose structure into its monomer sugars.58 The enzyme based route has environmentally benefits over the chemical one, since uses moderate and non-corrosive conditions such as lower reaction temperatures (50ºC), pH between 4.5 and 5, biodegradable and non-toxic reagents and produces higher conversion yields.56,59
12
Figure 1.9 –Cellulose depolymerization by cellulases.57
Several factors in enzymatic hydrolysis must be taken into account due to their impact on yield. A substrate concentration in the slurry solution may cause inhibition when present at high concentrations, lowers a rate of hydrolysis and also leads to difficulties in mixing and mass transfer in the solution. The resulting products from the hydrolysis of cellulose are glucose and cellobiose, which causes inhibition of the cellulase, lowering its activity. High enzyme substrate ratio, to a certain level, increases hydrolysis yield and rate, generating, however, high costs because of high enzyme requirements. Pre-treatment applied, temperature, pH, mixing and residence time are also factors that must be restrictedly controlled.61
13 2. Objectives
15 3. Materials and Methods
3.1. Materials
Wheat straw provided by, INIAV, I.P. – Estação Nacional de Melhoramento de Plantas (Elvas, Portugal), was milled to a particle size smaller than 1.5mm using a laboratory mill (IKA® WERKE, MF 10 basic, Germany. The milled straw, with an 8% w·w-1 moisture calculated, was stored at room temperature for further use.
The carbon dioxide used was purchased from Air Liquide, AlphaGaz™ gamma, Paris, France with
≥99.99% w·w-1 purity.
For chemical analyses it was used an aqueous solution of sulfuric acid 72% (w·w-1) prepared from a 96% (w·w-1) solution supplied by Panreac Química, Barcelona, Spain. For the recovery of the gas phase an ethanol solution (96% v·v-1) acquired from Carlo Erba Group, Arese, Italy was used.
All FT-IR samples were prepared with KBr (≥99.5 trace metal basis) purchased from Sigma-Aldrich Co. (St. Louis, MO, USA).
For the enzymatic hydrolysis sodium citrate buffer 0.1M at pH 4.8 was prepared using citric acid monohydrate (99.7% v·v-1 purity) bough from VWR International Ltd. – Leicester, England. Sodium azide (99% v·v-1 purity) bough from Merck – Darmstadt, Germany, was used to prepare 2% aqueous solution of sodium azide. NaOH and distilled water were also used. Commercial enzymatic
preparations of cellulases (Celluclast 1.5L) and β-glucosidases (Novozyme 188) with 105.89 FPU·mL-1
and 798.56 FPU·mL-1 respectively were bought from Novozymes – Bagsvaerd, Denmark.
For the phenolics compounds quantification gallic acid (99% v·v-1 purity) acquired from Panreac, Quimica SA was used to prepare a gallic acid 0.6 g·L-1 solution. Sodium carbonate 7.5% (w·v-1) was prepared from the reagent sodium carbonate (99% v·v-1 purity) from Riedel-de Haen and Folin-Cicalteu reagent bought from E. Merck, Darmstasdt, was used to prepare a 1·10-1 (v·v-1) Folin Cicalteus’ solution.
3.2. High pressure CO2-H2O pre-treatment of wheat straw
16
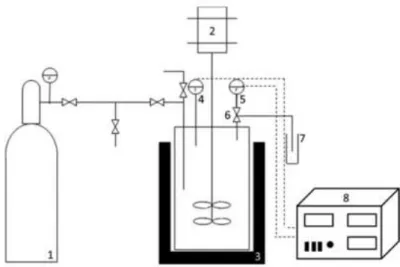
started when the temperature dropped down until 20ºC. During depressurisation, the gas phase passed through a flask, with known amount of ethanol solution (96% v·v-1) acquired from Carlo Erba Group, Arese, Italy, that was kept in the ice. This procedure allowed the dissolution of volatile compounds present in the gas phase. The resulting product (liquor and solids) of these reactions was pressed and then the liquor was vacuum-filtered using paper filters (Ø = 150 mm, no. 1235 and 1242) from Filter-Lab, Microchip Technology Inc., Arizona, USA. In Figure 3.1 is presented a scheme of the apparatus used.62
Figure 3.1 –Scheme of the high pressure CO2-H2O pre-treatment apparatus. 1 – CO2 cylinder; 2 – Magnetic
drive; 3 – Heating mantle; 4 – Thermo par; 5 – Pressure transducer; 6 – Depressurisation valve; 7 – Vial filled with ethanol; 8 – Pressure and temperature PID controller.
To analyse the obtained results the combined severity factor (
) was determined using the following equation:
Equation 3.1
( ) Where,
Equation 3.2
( ) ( )
Where t is the reaction time in minutes, T the final temperature in ºC and 14.75 an empirical parameter related with activation energy and temperature.
and
Equation 3.3
(
)
17
In order to study the effect of CO2 concentration in severity conditions, CO2 density was calculated through Peng-Robinson equation of state (PR-EOS) using the initial CO2 pressure and temperature for each pre-treatment:
Equation 3.4 –Peng-Robinson equation of state (PR-EOS)
( ) Where,
( √
The constants used are: Tc (CO2)= 304.2 K; pc (CO2)= 73.8 bar; ω (acentric factor)= 0.228; R (gas constant)= 8.314x10⁻² L·bar·K-1·mol-1.
The data used to determine CO2 density and number of moles of CO2 in the reactor at each reaction condition is present in annex B.
3.3. Chemical analyses
3.3.1. Solids moisture determination
For each solid sample, two nickel plates were placed in the 100ºC stove for at least 5h to remove their humidity. Around 0.7 grams of sample was weighted in each plate and then placed in the 100ºC stove for at least 18h, after which were weighted.
3.3.2. Liquors dry weight determination
For each liquid sample, two nickel plates were placed in the 100ºC stove for at least 5h to remove their humidity. 5 mL of sample was weighted in each plate and then placed in the 100ºC stove for at least 18h, after which were weighted.
3.3.3. Characterisation of the feedstock material composition
The feedstock was milled to a particle size smaller than 0.5 µm and the moisture content was determined as described in 3.3.1. section.
In the first step of acid hydrolysis, the milled straw are subjected to 1 h in a water bath set at 30ºC with 72% w·w-1 H2SO4. In the second step, the mixture was diluted to 4% w·w-1 H2SO4 with distilled water
(18.2 MΩ·cm-1) produced by the PURELAB Classic Elga system and placed in the autoclave
18
acetic acid was quantitatively and qualitatively determined through an Agilent 1100 series HPLC system, Santa Clara, CA, USA, equipped with refractive index detector and a Biorad Aminex HPX-87H column (Hercules, CA, USA). The set conditions of the column were: 50ºC, 0.4 mL·min-1 flow rate with 5 mM H2SO4. Before running in HPLC, all samples were filtered with syringe filters (0.22 μm) from Whatman, GE Healthcare Life Generations, Buckinghamshire, United Kingdom. The acid insoluble residue was considered as Klason lignin with correction for acid insoluble ash which was determined by subjecting the acid insoluble residue in the muffle at 550ºC for 5 hours. After HPLC analysis the %Gn, %Xn, %Arn, %LK and %GAc were determined as explained in annex C.
Protein quantification was performed by the Kjeldahl method using the Nx6.25 conversion factor. The crucible previously dried and tared porcelain with dry sample (1 g) was burned on a hotplate. Next were placed in muffle furnace (Heraeus D-6450, Germany) at 550 ± 5ºC for a period of not less than 5 hours. After this time, cooled to room temperature in a desiccator and were weighed on an analytical balance. The value obtained is the amount of ash present in the sample. This procedure was repeated at least in duplicate.
3.3.4. Characterisation of the processed solids
The solid phase resultant from the reaction was washed with ultra-pure water and oven-dried at 45ºC for at least 48h. Afterwards the solids were exposed to room conditions for 48h and then subjected to the same procedure as already described for feedstock material.
3.3.5. Liquor and post-hydrolysate characterisation
The liquid phase (liquor) resultant from the reaction was filtered with 0.22 µm pore filter and then analysed through HPLC with a flow rate of 0.6mL·min-1. The content in sugars (glucose, xylose, arabinose) and acids (acetic, formic and levulinic) was revealed with a refractive index detector and furfural and HMF with an UV/Vis detector at 280 nm.
For the determination of total sugar content of the liquor, a determined amount of sample was subjected to an acid hydrolysis with a 4% (w·w-1) H
2SO4 for 1h at 121ºC in an autoclave (Uniclave, Portugal)64. This procedure resulted in the conversion of oligosaccharides in their monomeric units which are quantified by HPLC, as well as acids and furfural and HMF.
3.4. Gas phase
The depressurised gas phase was analysed by HPLC with an UV/Vis detector at 280 nm to examine the presence of volatile degradation compounds, namely furfural and acetic acid.
3.5. FT-IR measurement of cellulose crystallinity
19
sample was milled together with 50 mg of KBr during 10 minutes with the goal of reaching a homogeneous appearance. Then the mixture was pressed with 8.5 tonnes for 5 minutes. The same procedure was made for all tree samples.
Fourier transform infrared spectroscopy (FT-IR) was performed using FT-IR spectrometer Spectrum BX, Perkin Elmer, Inc. (San Jose, CA, USA), equipped with a DTGS detector and KBr beam splitter. The operating system used was Spectrum software (Version 5.3.1, Perkin Elmer, Inc.,San Jose, CA, USA. FT-IR spectra were acquired at 4000-400 cm-1 with a resolution of 4 cm-1. The lateral order index, LOI, (A1437cm-1/A898cm-1)65 was calculated using total height.
3.6. SEM analysis
Scanning electron microscopy (SEM) was used to monitor the changes in morphology before and after CO2-H2O high pressure pre-treatment. A XL30 FEG Philips scanning electron microscopeoperated at 15 keV was used to image the samples. Prior to imaging, the samples were sputter-coated with gold-palladium in an EMITECH k575x to make the fibers conductive. The parameters of sputter current and time were set to 100 mA and 30 seconds in an inert atmosphere with argon and hydrogen. Prior to coating, solid samples were clean under vacuum.
3.7. Enzymatic hydrolysis
Determination of moisture of each sample was made prior to weighting the wheat straw samples. Then it was weighted 1.5 g in an oven-dry basis of each sample and added to 2 flasks. 5 mL of 0.1 M sodium citrate buffer (pH 4.8) and 0.1 mL of 2% sodium azide solution, to prevent growth of microorganisms during digestion, were added to the flasks. The Celluclast 1.5L and Novozyme 188 activities are 105.89 FPU·g-1 and 798.56 pNPGU·g-1 cellulose, respectively. The volumes of enzyme solutions to be added to each test flask is determined by their activity.
Recommended by NREL protocol loads of Celluclast 1.5L and Novozyme 188 are 60 FPU·g-1 and 64 pNPGU·g-1 of cellulose, respectively. It is assumed that in 0.15 g of lignocellulosic test specimen there is an amount of 0.1 g of cellulose, thus, the load of enzymes to be added will be 6 FPU for Celluclast and 6.4 pNPGU for Novozyme. It was concluded that 56 µL and 8 µL of Celluclast 1.5L and Novozyme 188, respectively, were the amounts to add to each flask. Then the volume to add of distilled water was determined so that the total volume on the flask was 10 mL. In the third flask were added the same reagents as in the previous except for the enzymes.
It was also prepared in a flask a blank for enzymes which contained the buffer citrate and sodium azide solutions, water and enzymes. No lignocellulosic materials were added to this fourth flask. All the flasks were tightly closed and placed in a rotation incubator, Optic Ivymen® System (Spain), at 50ºC for 96h under 250 rpm. Samples from each flask were collected in 6h, 24h, 48h, 72h and 96h to
eppendorf’s and placed in an 90ºC water bath for 5 minutes to deactivate the enzymes. Then samples
20
3.7.1. Characterisation of the samples composition
Sugars (glucose, arabinose and xylose) from all collected samples were analysed by HPLC using the refractive index detector with a 0.6 mL·min-1 flow rate. The content in these sugars was determined by the construction of calibration curves with sugar solutions with known concentrations.
After HPLC analysis the glucose digestibility was determined as shown in annex D.
3.8. Quantification of total phenolics
Quantification of total phenolic compounds was done through the Folin-Cicalteu method. Gallic acid 0.6 g·L-1, sodium carbonate 7.5% (w·v-1) and Folin-Cicalteu 1/10 (v·v-1) solutions were prepared and 2µL of the samples to be quantified was filtered with 0.22 µm filters and diluted with Mili-Q water using 1:10 and 2:10 dilution factors.
It was added to a test-tube with lid, properly identified, 100 µL of sample, 4 mL of Folin-Ciocalteu solution 1/10 (v·v-1) and 4 mL of sodium carbonate 7.5% (w·v-1) and after each addition it was stirred on vortex. All the tubes were incubated in a bath at 45 ºC for 15 minutes. In the end each solution was stirred and the absorbance was measured at 765 nm. This procedure was done in triplicate in order to minimize dilution associated error.
Calibration curve was constructed in the same manner with different gallic acid concentrations (0; 0.06; 0.15; 0.30; 0.45; 0.54; 0.60 mg·mL-1).
21 4. Results and Discussion
4.1. Chemical composition of wheat straw
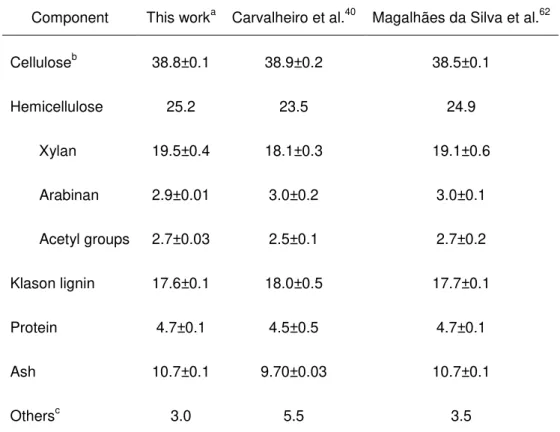
The composition of untreated wheat straw was determined and is presented in Table 4.1. As it can be seen, total content in polysaccharides is 64%, among which 38.8% is cellulose, in a form of glucan and 25.2% is hemicellulose which is the sum of xylan, arabinan and acetyl groups. Characterisation of wheat straw is in good agreement with the results of the compositional analysis obtained from Carvalheiro et al.40 and Magalhães da Silva et al.62
Table 4.1 –Macromolecular composition of wheat straw (% of dry weight)
Component This worka Carvalheiro et al.40 Magalhães da Silva et al.62
Celluloseb 38.8±0.1 38.9±0.2 38.5±0.1
Hemicellulose 25.2 23.5 24.9
Xylan 19.5±0.4 18.1±0.3 19.1±0.6
Arabinan 2.9±0.01 3.0±0.2 3.0±0.1
Acetyl groups 2.7±0.03 2.5±0.1 2.7±0.2
Klason lignin 17.6±0.1 18.0±0.5 17.7±0.1
Protein 4.7±0.1 4.5±0.5 4.7±0.1
Ash 10.7±0.1 9.70±0.03 10.7±0.1
Othersc 3.0 5.5 3.5
a
Average of two replicates; b Measured as glucan; c Measured by difference
4.2. High-pressure CO2-H2O
4.2.1. Effect of reaction severity on pre-hydrolysate composition
22
comparison of the obtained data. The determination of the combined severity factor has into account the time that the system takes to be heated until the desired temperature, which in turn depends on the water/biomass loading and the final temperature. Also the pH in the medium reaction contributes to the severity factor value and this parameter depends on the partial pressure of CO2 in the system. Both, high-pressure CO2-H2O and water-only reaction (autohydrolysis) resulted in liquors containing a mixture of hemicellulose constituents such as xylose and arabinose namely in oligomer form, acetic acid and furfural (the main decomposition product of pentoses) and glucose as oligosaccharide obtained from cellulose.
As it is shown in Table 4.2 and Table 4.3 presented below, XOS is the main compound present in liquors produced in all experiments. The amount of XOS recovered was highly dependent on the reaction conditions. When wheat straw was pre-treated at
= -0.33, xylan to XOS yield of 61.7% was obtained and it corresponds to concentration of XOS as high as 11.4 g·L-1. Under this condition a high quality liquor, rich in pentose sugars with low amount of degradation products (1.7 g·100 g-1), was obtained. At = 0.19, a decrease of XOS concentration and yield to the lowest value of 4.1 g·L-1 found in all experiments was detected. At this condition, an extended xylan hydrolysis (24.2% of xylose and 12.8% of furfural) coupled with the loss of XOS yield (64% lower in comparison with the best XOS yield condition) was observed. Additionally, interesting is that comparing the XOS yield at CO2–H2O processing at = -0.33 with the autohydrolysis =0.02, a 45% higher XOS yield was produced in CO2 coupled treatment. It may indicate that presence of CO2 helps to promote the hydrolysis of hemicellulose xylan to XOS. For reactions performed at 130ºC independently of CO2 pressure used the concentration of XOS is quite low (from 1.3 to 1.5 g·L-1).
Xylose is the main monosaccharide present in the liquor followed by the second monosaccharide - arabinose. Under the best XOS yield condition, the concentration of released xylose and arabinose corresponds to 15% and 46.5% of initial xylan and arabinan contents, respectively. The concentration of xylose increased with the severity of the reaction up to
= 0.11, for which a maximum concentration of 5.3 g·L-1 was obtained. At the harshest conditions ( = 0.19), the xylose concentration starts to decrease caused by its degradation giving furfural with 1.7 g·L-1 concentration. In all other reactions, with less severe conditions, furfural was formed almost in negligible amounts as depicted in Table 4.3.
23
processes contained acetic acid in both forms: as free acetic acid and as acetyl groups bounded to OS (AcOS). As expected the maximum acetic acid (4.0 g·L-1) was achieved at the severest condition while the highest AcOS concentration was obtained at moderate
=-0.33. The mechanism of this process is analogous to previously discussed conversion of XOS to xylose. More severe conditions favour hydrolysis of AcOS to acetic acid therefore the concentration of acetic acid increases with the increase of severity factor. King and co-workers obtained similar results for experiments based on hydrolysis of switchgrass with carbonated water to produce carbochemicals in the range of temperature from 220 to 310ºC and commensurate higher pressure (68 bar) in a semi-continuous batch flow system. The aliphatic acids (acetic and formic) were produced at levels of 3-6 g·100g-1 of feedstock while furfural was rapidly produced at 310ºC within 10 min.66 The examined conditions allowed to produce liquors rich in oligosaccharides in a total concentration of 18.6 g·L-1 at =-.33. The produced solution was mostly constituted by XOS which is a major product among oligosaccharides present, corresponding to 61% of them.
Comparison between XOS concentrations obtained at 130ºC and 225ºC conditions shows the important effect of temperature on hydrolysis of biomass. For instance, at 30 bar, it was observed an increase more than 500% for increase of temperatures from 130ºC to 225ºC. Although dissolution of CO2 in water increases with an increase of CO2 pressure and reduces with increases of temperature, XOS content shows only a 9% increase associated to the increase of CO2 pressure by 30 bar at 130ºC, while at 225ºC, an analogous pressure increase gives an increase of 24% of XOS. These results also evidence the strong influence of temperature, that despite of enhancing water acidity, also increases acetic acid concentration in solution, which acts as a catalyst.
Data available for 130ºC shows that the XOS average values obtained were close to 1.4g·L-1 and the remainder constituents from the liquor are present in equally low amounts. At this temperature it was expected that hydrolysis of glycosidic linkages would be lower, when compared with 225ºC, due to minor auto-ionization of water. Presence of acetic acid in liquors obtained at 130ºC reactions confirms that acetyl groups are the first to be hydrolyzed, as described elsewhere.40 For the 130ºC conditions, presence of CO2 enhances production of XOS and GlcOS. In fact, at lower temperatures dissolution of CO2 in water increases leading to greater amounts of carbonic acid in solution, as revealed from the estimated pH. The literature reports67,68 illustrate that to achieve the same compound concentrations a shorter time of pre-treatment is needed when the severity increase is noted. As observed, for 130ºC the increase of severity of reaction conditions by the increase of CO2 pressure, drives to slight increase of XOS and do not promote a degradation of sugars. This may indicate that at these conditions xylan degradation kinetic is at an early stage. To better understand reaction pathway more experiments should be done with longer periods of time.
24
severity of the reaction conditions guiding to liquors with higher concentrations of xylose and furfural. At 100·10-1, the increase of pressure to 30 bar and 45 bar causes a much more accentuated reduction in XOS than for 150·15-1.
The obtained results show that 50% of reduction in biomass loading leads to an increase of 17% of moles of CO2 and 14% of XOS (15 bar pressure). There is consistency between results from this work and Magalhães da Silva et al. since there were also reported better results regarding XOS concentration at lower biomass loadings (75·7.5-1). The lowest XOS concentration obtained coincided with the highest CO2 concentration ( = 0.19), as expected, however at this conditions furfural was produced at lower concentration than at all others. On the other hand, the recovered gas phase (Figure 4.1) from this reaction showed the highest concentration of furfural, which explains the lower furfural concentration found in the liquor.
For each biomass loading, increase of number of moles of CO2 resulted in increase of acidity of liquors during reaction, showing not only the presence of carbonic acid but also its augment in the system at higher CO2 concentration. The reduction of biomass loading from 150·15-1 to 100·10-1 resulted in acidic liquors (comparing reactions with the same pressure), as expected, since increase of head space involves the addition of higher amounts of CO2 into the reactor in order to exert the same pressure.
The phenolic compounds concentration in the liquors was also measured and is presented in Tables 4.2 and 4.3. The results show that at lower temperatures (130ºC) the phenolic concentration is lower than at 215 and 225ºC. At 225ºC is observed a concentration 9-fold higher than at 130ºC that shows a strong influence of temperature on lignin degradation.
The phenolic concentration follows the same trend as the lignin dissolution, since phenolic compounds result from the degradation of lignin polymer. At 130ºC no significant changes are observed between 0, 30 and 60 bar pressure of CO2, however an increase of phenolic concentration is observed as the severity reaction increases.
25
Table 4.2 –Composition of liquors (g·L-1) of each product present in the liquors (g·100 g-1 of the initial amount present in the feedstock) obtained after high-pressure CO2-H2O of wheat straw at 130ºC.
T (ºC) 130 130 130
pCO2initial(bar) 0 30 60
pCO2(bar) 1.5 43.8 114.8
CO2/biomass(w·w-1) 0.00 0.19 0.71
Log (R0) 1.01 0.83 0.94
CSPCO2 -3.32 -2.70 -2.43
pHa 4.33 3.56 3.38
pHb 5.14 5.28 5.22
Composition/yields g·L-1 g·100g-1 g·L-1 g·100g-1 g·L-1 g·100g-1
XOS 1.3 5.0 1.4 11.3 1.5 4.9
GlcOS 0.5 1.3 0.4 2.0 1.5 3.9
AcO 0.0 - 0.0 - 0.0 -
Xylose 1.1 4.9 1.5 6.7 1.7 8.1
Arabinose 0.4 12.3 0.4 11.4 0.4 13.7
Glucose 0.8 1.8 1.2 2.8 0.8 2.0
Acetic Acid 0.4 - 0.5 - 0.6 -
Furfural 0.0 0.0 0.0 0.0 0.0 0.0
HMF 0.0 0.0 0.0 0.0 0.0 0.0
Phenolics 0.83 0.85 0.95
a
estimated pH during reaction, determined using the following expression: ( ) ; bpH measured after depressurisation; XOS – Xylo-oligosaccharides; GlcOS –
Gluco-oligosaccharides; AcOS – Acetyl groups linked to oligosaccharides; HMF- 5-hidroxymethylfurfural; Phenolics –
26
Table 4.3 –Composition of liquors (g·L-1) of each product present in the liquors (g·100 g-1 of the initial amount present in the feedstock) obtained after high-pressure CO2-H2O of wheat straw at
215ºC and 225ºC.
T (ºC) 225 225 215 215 225 225 225 225 225 225
pCO2initial (bar) 15 15 30 54 30 30 0 45 45 53
pfinal (bar) 32.6 36.4 61.0 126.3 61.9 62.1 23.6 83.7 93.0 127.4
CO2/biomass
(w·w-1) 0.04 0.06 0.20 0.47 0.21 0.20 0.00 0.30 0.34 0.49
Log (R0) 3.83 3.80 3.57 3.58 3.87 3.96 3.79 3.95 3.95 3.96
CSPCO2 -0.48 -0.42 -0.33 -0.13 -0.09 0.00 0.02 0.08 0.11 0.19
pHa 4.31 4.22 3.90 3.71 3.96 3.96 - 3.87 3.84 3.77
pHb 3.97 4.14 3.87 3.80 4.03 3.78 3.77 3.74 3.68 3.55
Composition/
yields
g·L-1 g·100g-1 g·L-1 g·100g-1 g·L-1 g·100g-1 g·L-1 g·100g-1 g·L-1 g·100g-1 g·L-1 g·100g-1 g·L-1 g·100g-1 g·L-1 g·100g-1 g·L-1 g·100g-1 g·L-1 g·100g-1
XOS 9.4 51.7 10.7 57.9 11.4 61.7 9.9 53.8 9.2 52.9 9.2 49.8 7.4 42.6 8.9 48.3 5.6 30.6 4.1 22.6
GlcOS 4.8 13.2 5.7 15.5 4.5 12.4 4.5 12.3 4.3 12.4 5.0 13.6 4.0 11.6 4.0 13.6 3.6 9.8 3.5 9.5
AcO 0.8 - 2.8 - 2.7 - 1.9 - 2.1 - 0.6 - 0.4 - 0.2 - 1.7 - 1.7 -
Xylose 2.8 13.4 3.0 14.4 3.1 15.0 4.2 20.1 3.3 16.7 4.4 21.2 3.7 18.9 3.4 21.2 5.3 25.4 5.0 24.2
Arabinose 1.2 39.5 1.2 37.5 1.4 46.5 1.3 40.8 0.8 26.5 1.2 23.5 0.8 25.7 1.1 23.5 1.0 26.4 0.8 24.4
Glucose 1.2 2.9 0.8 1.9 0.9 2.2 1.0 2.6 0.7 1.8 0.9 2.3 0.8 2.1 1.2 2.3 1.1 2.7 1.2 2.9
Acetic Acid 3.2 - 3.2 - 2.5 - 3.3 - 3.0 - 3.5 - 3.5 - 3.5 - 3.6 - 4.0 -
Furfural 0.1 1.0 0.8 6.3 0.2 1.3 0.2 1.7 0.8 6.0 1.0 7.1 1.5 12.2 1.2 7.1 0.8 6.0 1.7 12.8
HMF 0.2 0.5 0.2 0.5 0.1 0.4 0.2 0.7 0.2 0.7 0.2 0.6 0.2 0.8 0.3 0.2 0.3 0.9 0.3 1.1
Phenolics 8.66 7.27 7.17 6.73 6.30 8.13 6.15 9.18 9.76 8.20
aestimated pH during reaction, determined using the following expression:
( ) ; bpH measured after depressurisation; XOS –
27 4.2.2. Hydrolysate pH
Other important aspect examined in this work is the pH of the produced liquors. The measured and predicted69 pH values of hydrolysates from either autohydrolysis or high-pressure CO2-H2O experiments are presented in Tables 4.2 and 4.3. As it can be seen, the measured pH values (after CO2 released at room temperature) vary between 3.55 and 4.04 for experiments carried out with CO2. The processes with CO2 for ≥0.08 gave pH of hydrolysate lower than this for autohydrolysis reaction (pH=3.77). Considering that no significant additional amount of acetic acid was formed during these reactions, as it is shown in Table 4.2 and 4.3, it may indicate that carbonic acid formed in-situ acidify the medium driving to the decrease of the final pH of the liquor. The obtained results are in contrast to those presented by van Walsum and co-workers where addition of carbonic acid increased the pH of the liquor produced.70 These differences can be elucidated by the fact that at lower CO2 pressure, the solubility of CO2 in the aqueous phase is much lower (even one order of magnitude), therefore at these conditions the acidification of liquor by carbonic acid is practically negligible. For instance, for the reaction at 225ºC and 15 bar of initial CO2 pressure (32.6 bar final pressure) for
= -0.48, the solubility of CO2 in water is almost null (xC 2= 0.0016)
71
resulting in very lower CO2 dissolved/water ratio, which equals to 0.039. In contrast, the solubility of CO2 in water for the harshest conditions examined ( = 0.19) is xC 2= 0.0196 giving 0.49 g of CO2 dissolved in water per g of biomass. This data clearly demonstrate that CO2 pressure and by this the severity of the reaction plays an important role as at the lesser severe conditions, reactions occur in fact in the three phase system involving solid biomass, water mostly in liquid state and gaseous phase constituted almost exclusively by CO2. Furthermore these three phase reactions give a pH of liquors similar to pH of liquor for autohydrolysis ( = 0.02).
Other important aspect to be scrutinised is that at the harshest conditions, degradation products with acidic characteristic are formed, which also contribute to biomass hydrolysis and consequently guide to lower pH values of generated liquors. For example, a lower pH values were found also in hydrothermal processes reported in the literature where an extensive hydrolysis of hemicellulosic acetyl groups was found.72,73,74 Other very important factor influencing the pH of the liquor is the composition of biomass explored. Biomass rich in high acetyl group contents may lead to a decrease of pH during reaction. Comparison of the results obtained in this work with those reported in the literature75 illustrates that the pH value of liquors from aspen wood pre-treatment with carbonic acid for
= 0.17 is 3.95
75, and is not very different from this obtained under similar reaction conditions (
28
Although, the CO2 experiments resulted in different pH of liquors, in fact the decrease of pH does not show significant effect on hemicellulose dissolution. For example, the difference of hemicellulose dissolution between all reactions with
≥ -0.13 was only around 6%. Brunner and co-workers also found similar conclusions, where no substantial relation between hemicellulose dissolution and decrease of pH was determined.76 Even a decrease of pH to around 2 caused by addition of sulphuric acid did not have any effect on biomass dissolution.76
The pH of medium produced during the process and the reaction severity not only influences the liquor composition but also affects a pre-treated solid too.
4.2.3. Effect of reaction severity on gas phase composition
From the recovered gas phase, the only volatile product to be found was furfural. The concentrations of this compound present in the gas phase for each reaction are shown in Figure 4.1, presented below. Analysis of the results shows that the increase of number of moles of CO2 increases furfural concentrations in the recovered gas phase. It can see that furfural is dependent not only on the number of moles of CO2 present but also on biomass loading and temperature since a decrease in furfural with a decrease of any of these three parameters is observed. At the harshest condition ( = 9.01 mol), the highest value of furfural equaled to 1.25 g·L-1 was obtained. Since there was no furfural observed in liquors at temperature reaction of 130ºC, it was also not expected its presence in the recovered gas phase.
Figure 4.1 –Content in furfural (g·L-1) of the recovered gas phase as a function of number of moles of CO2.
150/15 and 100/10 represent the ratio between mass of water and mass of biomass. 0.00 0.20 0.40 0.60 0.80 1.00 1.20 1.40
0.29 0.66 1.08 0.34 0.77 1.33 9.01 0.74 9.08
150/15 100/10 100/10
29
4.2.4. Effect of severity on solid phase composition
Figure 4.2 summarizes the composition and yield of the pre-treated solid residues obtained either by autohydrolysis or by CO2-H2O under different severity conditions. For all conditions of high-pressure CO2-H2O processes, except for 130ºC, the solid dissolution was high and superior to 50%. In comparison, the autohydrolysis reaction, similarly to CO2-H2O experiments, demonstrated still high solid dissolution (46.7% of initial biomass) with hemicellulose removal close to 75%. Other important aspect is that, the processed solids suffered significant changes in composition in comparison with the raw material. The degree of biomass dissolution increases almost linearly with severity factor reaching values of hemicellulose removal up to 86.4%. This demonstrates an uncompleted hydrolysis of xylan and presence of minor amount of acetyl groups as well as a complete dissolution of arabinan as its absence was determined in the processed solid. With an increase of the severity of the reaction a faster cleavage of linkages of the hemicellulose and cellulose was observed.76 Van Walsum observed, at elevated temperatures (above 200ºC), similar catalytic effect of carbonic acid on pure xylan hydrolysis allowing for an increase of pentoses release and a decrease of a degree of polymerisation of xylan oligomers in comparison with autohydrolysis (hot water).69 The obtained data shows that cellulose, despite being partially affected by either autohydrolysis or CO2-H2O process, is a dominant constituent of the processed solid and its relative concentration increases with the severity of the reaction once the dissolution of hemicellulose fraction occurs. The maximum glucan content of 74.9% in the processed solid was found at
30
Figure 4.2 –Composition of the solids and solid yield obtained after high-pressure CO2-H2O
4.2.5. Characterisation of cellulose crystallinity of pre-treated solids
Fourier Transform Infrared (FT-IR) technique was selected to analyse the compositional changes regarding to cellulose crystallinity of the solid materials recovered from both autohydrolysis and high-pressure CO2-H2O.79,80,81 A LOI65 is a tool to measure the degree of crystallinity of cellulosic material and is defined as a ratio of absorption bands at 1430 and 838 cm-1. A band at 1430 cm-1, assigned to a symmetric CH2 bending vibration is “crystallinity band”, indicating that a decrease in its intensity reflects reduction in the degree of crystallinity of the samples. The FT-IR absorption band at 898 cm-1, assigned to C–O–C stretching at β-(1→4)-glycosidic linkages, is an “amorphous” absorption band and an increase in its intensity happening in the amorphous samples. The results obtained for untreated, and treated by autohydrolysis (
=0.02) and with CO2 ( =0.08) are given in Table 4.4 and Figure 4.3.
The analysis of the produced data shows that LOI for untreated sample is 3.28, while for autohydrolysis and CO2 treated solids is 4.56 and 3.92, respectively. It may indicate that the untreated sample has lower crystallinity than the treated ones. However the close inspection of the obtained data shows that there is a removal of the amorphous cellulose in the treated samples, and thus a reduction of the ratio is observed when compared with the LOI of the untreated sample.
0 10 20 30 40 50 60 70 80 90 100 -10 0 10 20 30 40 50 60 70 80 90
-3.32 -2.70 -2.43 -0.48 -0.42 -0.33 -0.13 -0.09 0.00 0.02 0.08 0.11 0.19
S o li d y ie ld ( g ·1 00 g
-1 fee
d sto ck) S o li d c o m p o si tion ( g ·1 00 g
-1 p
ro ce ssed soli d s) CSpCO2
%Gn %Kl %Xn
31
Table 4.4 –The LOI index for untreated, autohydrolysis and CO2-treated wheat straw
A898 A1437
Untreated 0.115 0.376 3.27
Autohydrolysis ( =0.02) 0.084 0.383 4.56
High-pressure CO2-H2O ( =0.08) 0.079 0.311 3.94
cm-1
800 850 900 950 1000 1400 1450 1500 1550
Figure 4.3 –The FT-IR spectra of untreated (black line), autohydrolysis (red line) and CO2 processed wheat
straw (green line) showing the regions for LOI determination. The adequate bands (898 and 1437 cm-1) are marked by dashed lines.