______________________________
Corresponding author: Mirjana Jankulovska, Faculty of Agricultural Sciences and Food, bul. Aleksandar Makedonski bb, 1000 Skopje, Macedonia
tel: ++389 2 3115 277, e-mail: [email protected]
UDC 575.22: 633 Original scientific paper
INTERRELATIONSHIP BETWEEN YIELD AND YIELD RELATED TRAITS OF SPRING CANOLA (BRASSICA NAPUS L.) GENOTYPES
Sonja IVANOVSKA1, Cane STOJKOVSKI1, Zoran DIMOV1, Ana MARJANOVIC- JEROMELA2, Mirjana JANKULOVSKA1, and Ljupco
JANKULOSKI1
1
Faculty for Agricultural Sciences and Food, Skopje, Macedonia 2
Institute of Field and Vegetable Crops, Novi Sad, Serbia
Ivanovska S., C. Stojkovski, Z. Dimov, A. Marijanovi -Jeromela, M. Jankulovska and Lj. Jankuloski (2007): Interrelationship between yield and yield related traits of spring canola (Brassica napus L.) genotypes.– Genetika, Vol. 39, No. 3, 325 -332.
Number of pods per plant (p=0.759 and p=0.877 for Skopje and Strumica, respectively) and seed weight per pod (p=0.216 and p=0.225) had the highest direct effect on seed yield in both locations followed by 1000 seed weight (p=0.056 and p=0.010). The coefficient of determination (R2) was 0.943.
Key word: path-coefficient, spring oilseed rape, simple correlation
coefficient
INTRODUCTION
Canola (Brassica napus L.) is one of the major oilseed crops grown worldwide. The major objective for oilseed rape breeders is seed yield improvement. Yield is a complex trait characterized by low heritability and affected by genotype x environment interactions. The genetic background of any pair of characters, whether yield, height, or maturity characters is unlikely to be under totally separate control, mainly due to linkage or pleiotropy. For plant breeders is therefore necessary to examine the relationships between pairs of characters in order to decide upon the appropriate selection criteria for a breeding program (ENGQVIST and BECKER, 1993). Correlations between the yield and yield determinating traits have already been analyzed in rapeseed (OLSSON, 1960; THURLING, 1974; THURLING and VIJENDRA DAS, 1979; TAYLOR and SMITH, 1992; ENGQVIST and BECKER, 1993; OZER et al., 1999; ALI et al., 2003; MARINKOVIC et al., 2003). But, use of simple correlation analysis could not fully explain the relationship among the characters.
Path coefficient analysis is a statistical tool developed by WRIGHT (1921). The advantage of path analysis is that it permits the partitioning of the correlation coefficient into its components- one component being the path coefficient (or standardized partial regression coefficient) that measures the direct effect of a predictor variable upon its response variable; the second component being the indirect effect(s) of a predictor variable on the response variable trough the predictor variables (DEWEY and LU, 1959). The proportion of variance in the response variable explained by the variance in the predictor variable (partial coefficient of determination) is the square of the path coefficient.
Therefore, the path coefficient analysis has been used by many researchers (MARINKOVIC, 1992; SAMONTE et al., 1998; ALI et al., 2002; MOHAMMADI et al., 2003; DAS et al., 2004) in different crops breeding, for complete determination of impact of independent variable on dependent one. The objective of this study was to determine the interrelationships between yield and some yield components and to identify characters with significant effects on yield for potential use as selection criteria.
MATERIAL AND METHODS
periods (spring 2003, fall 2003, fall 2004 and spring 2005) on three different dates (spring sowing on 20 March, 30 March and 10 April, and fall sowing on 20 September, 30 September and 10 October) at two locations: Skopje (42º00 N, 21º27 E) and Strumica (41º26 N, 22º38 E).
The experiment was arranged in a randomized complete block design with four replications. The seed was sown by hand in seven rows 3m long, with 20 cm distance between rows. At the harvest, 100 plants were taken from the middle 5 rows of each plot. Plant height, number of primary branches (including the main raceme) and number of pods per plant were determined at the field. 50 pods from every plant were measured for pod length, number of seeds per pod and seed weight per pod in laboratory. From plants with less than 50 pods, all pods were analyzed. A 1000 seed sub-sample was taken from every plant for determination of 1000 seed weight. Seed yield per plant represents weight of all seeds from particular plant.
Correlation coefficients between all pairs of variables and standardized regression coefficients were obtained using SPSS 11.0 statistical software. The path coefficient analyses were conducted according to LI (1975). Grain yield per plant was kept as a resultant variable and all other component characters as causal variables.
RESULTS AND DISCUSSION
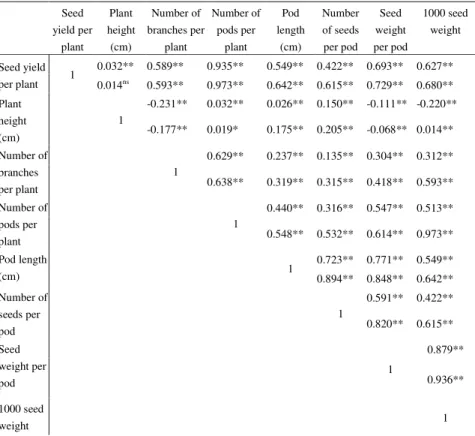
The correlation between all pairs of variables is given in Table 1, separately for Skopje and Strumica. As can be seen from the table, all traits were positively and significantly correlated with seed yield, except plant height in Strumica.
Table 1. Simple correlation coefficients between studied traits in Skopje (the upper value per row) and in Strumica (the lower value per row)
Seed yield per plant Plant height (cm) Number of branches per plant Number of pods per plant Pod length (cm) Number of seeds per pod Seed weight per pod 1000 seed weight
0.032** 0.589** 0.935** 0.549** 0.422** 0.693** 0.627** Seed yield
per plant 1 0.014ns
0.593** 0.973** 0.642** 0.615** 0.729** 0.680**
-0.231** 0.032** 0.026** 0.150** -0.111** -0.220** Plant
height (cm)
1
-0.177** 0.019* 0.175** 0.205** -0.068** 0.014**
0.629** 0.237** 0.135** 0.304** 0.312** Number of
branches per plant
1
0.638** 0.319** 0.315** 0.418** 0.593**
0.440** 0.316** 0.547** 0.513** Number of
pods per plant
1
0.548** 0.532** 0.614** 0.973**
0.723** 0.771** 0.549** Pod length
(cm) 1 0.894** 0.848** 0.642**
0.591** 0.422** Number of
seeds per pod
1
0.820** 0.615**
0.879** Seed weight per pod 1 0.936** 1000 seed
weight 1
*,* Correlation is significant at the 0.01 level and 0.05 level respectively; ns- nonsignificant
Path coefficient analysis was performed in order to obtain and interpret information on the nature of interrelationships between grain yield and yield related traits in both locations where the experiment was conducted (Table 2).
Table 2. Pathways of association between yield and yield related traits in Skopje (the upper value per row) and in Strumica (the lower value per row)
Indirect effect via
Character Direct effect Plant height (cm) Number of branches per plant Number of pods per plant Pod length (cm) Number of seeds per pod Seed weight per pod 1000 seed
weight Correlation
0.045** -0.009 0.024 -0.001 0.009 -0.024 -0.012 0.032** Plant height
(cm) 0.011** 0.000 0.010 0.017 0.003 -0.008 -0.015 -0.002 0.014ns
0.040** -0.010 0.478 -0.009 0.008 0.066 0.018 0.589** number of
branches per
plant -0.054** -0.002 0.000
0.559 0.005 -0.013 0.094 0.004 0.593**
0.759** 0.001 0.025 -0.017 0.019 0.118 0.029 0.935** number of
pods per
plant 0.877** 0.001 -0.035
0.000
0.008 -0.022 0.138 0.006 0.973**
-0.038** 0.001 0.009 0.334 0.043 0.167 0.033 0.549** pod length
(cm) 0.015** 0.002 -0.017 0.480 0.000 -0.037 0.192 0.007 0.642**
0.059** 0.007 0.005 0.240 -0.028 0.128 0.011 0.422** number of
seeds per
pod -0.041** 0.002 -0.017 0.467 0.013 0.000
0.185 0.006 0.615**
0.216** -0.005 0.012 0.415 -0.029 0.035 0.049 0.693** seed weight
per pod (g) 0.225** -0.001 -0.023 0.539 0.013 -0.034 0.000 0.010 0.729**
0.056** -0.010 0.012 0.389 -0.022 0.011 0.190 0.627** 1000 seed
weight (g) 0.010ns
-0.002 -0.023 0.499 0.011 -0.025 0.211 0.000
0.680**
**,* Correlation is significant at the 0.01 level and 0.05 level respectively; ns- nonsignifican
Number of pods per plant (p=0.759 and p=0.877 for Skopje and Strumica, respectively) and seed weight per pod (p=0.216 and p=0.225) had the greatest direct effect on seed yield in both locations. THURLING (1974), OZER et al. (1999) and ALI et al. (2002) also reported highest direct effect of pods per plant on seed yield which differs from the findings of MARINKOVIC et al. (2003). ALI et al. (2003) found that the direct effect of the harvest index on seed yield was highest and positive, followed by seed weight and number of pods per plant.
1000 seed weight had positive (and highly significant in Skopje) direct effect on seed yield (p=0.056 and p=0.010 for Skopje and Strumica, respectively) which is in relation with the results of OZER et al. (1999).
CONCLUSIONS
All traits included in the analysis were positively and significantly correlated with seed yield, except plant height in Strumica. Seed yield had highest correlation with number of pods per plant (r= 0.935 and r= 0.973 for Skopje and Strumica, respectively), followed by seed weight per pod (r= 0.693 and r= 0.729) and 1000 seed weight (r= 0.627 and r= 0,680).
The path coefficient analysis confirmed the findings of the correlation analysis in general, but also provided additional information on interrelationships between the pairs of independent variables. Based on the obtained results, number of pods per plant (p=0.759 and p=0.877 for Skopje and Strumica, respectively), seed weight per pod (p=0.216 and p=0.225) and 1000 seed weight (p=0.056 in Skopje) exhibited highest direct effect on seed yield per plant. Because of that, these yield related traits can be considered to be effective as selection criteria for seed yield improvement in spring canola genotypes.
Received February 28th, 2007
Accepted August 17th
, 2007
REFERENCES
ALI N., F. JAVIDFAR and A.A. ATTARY (2002): Genetic variability, correlation and path analysis of yield and its components in winter rapeseed (Brassica napus L.). Pak. J. Bot., 34(2):145-150 ALI N., F. JAVIDFAR, J.Y. ELMIRA and M.Y. MIRZA (2003): Relationship among yield components and selection criteria for yield improvement in winter rapeseed (Brassica napus L.). Pak. J. Bot. 35(2):167-174
DAS K.M., R.G. FUENTES and C.M. TALIAFERRO (2004): Genetic variability and trait relationships in switchgrass. Crop Sci. 44:443-448
DEWEY D.R. and K.H. LU (1959): A correlation and path-coefficient analysis of components of crested wheatgrass seed production. Agron. J. 51:515-518
DIEPENBROCK W. (2000): Yield analysis of winter oilseed rape (Brassica napus L.): a review. Field Crops Res. 67:35-49
ENGQVIST M. G. and BECKER, H.C. (1993): Correlation studies for agronomic characters in segregating families of spring oilseed rape (Brassica napus). Hereditas 118:211-216
LI C.C. (1975): Path analysis: A Primer. Boxwood Press, Pacific Grove, CA.
MARINKOVIC R. (1992): Path coefficient analysis of some yield components of sunflower. Euphytica, 60:201-205
MARINKOVIC R., A. MARJANOVIC-JEROMELA, J. CRNOBARAC and J. LAZAREVIC (2003): Path-coefficient analysis of yield components of rapeseed (Brassica napus L.). Proceedings of the 11th
International Rapeseed Congress. Copenhagen, Denmark. p: 988-991
MOHAMMADI S.A., B.M. PRASANNA, and N.N. SINGH (2003): Sequential path model for determining interrelationships among grain yield and related characters in maize. Crop. Sci. 43 :1690-1697
OZER H. E. ORAL and U. DOGRU (1999): Relationship between yield and yield components on currently improved spring rapeseed cultivars. Turk. J. Agric. For. 23:603-607
SAMONTE S.O.P.B., L.T. WILSON, and A.M. MCCLUNG (1998): Path analyses of yield and yield-related traits of fifteen diverse rice genotypes. Crop. Sci. 38:1130-1136
TAYLOR A.J. and C.J. SMITH (1992): Effect of sowing date and seeding rate on yield and yield components of irrigated canola (Brassica napus L.) grown on a red-brown earth in south-eastern Australia. Aust. J. Agric. Res. 43:1629-1641
THURLING N. (1974): Morphophysiological determinants of yield in rapeseed (Brassica campestris and Brassica napus ). II. Yield Components. Aust. J. Agric. Res. 25:711-721
THURLING N. and L.D. VIJENDRA DAS (1979): The relationship between pre-anthesis development and seed yield of spring rape (Brassica napus L.) Aust. J. Agric. Res. 31:25-36
ME UZAVISNOST PRINOSA I KOMPONENTI PRINOSA GENOTIPOVA JARE ULJANE REPICE (Brassica napus L.)
Sonja IVANOVSKA1, Cane STOJKOVSKI1, Zoran DIMOV1, Ana MARJANOVI - JEROMELA2, Mirjana JANKULOVSKA1,
i Ljup o JANKULOSKI1
1
Fakultet za poljoprivredne nauke i hranu, Skoplje, Makedonija 2
Naucni institut za ratarstvo i povrtarstvo, Novi Sad, Srbija
I z v o d
Istraživanje je sprovedeno sa ciljem da se determinšu komponente prinosa koje mogu pretstavljati efektivniji kriterijum za selekciju nego prinos “per se”. Kod tri jara genotipa uljane repice (Brassica napus L.) su bila ispitivana svojstva: visina biljke, broj primarnih grana (uklju uju i i centralnu), broj ljuski po biljci, dužina ljuski, broj semena po ljusci, masa semena po ljusci i masa 1000 semena, kao i njihove korelacije sa prinosom semena po biljci. Broj ljuski po biljci je imao najve u vrednost koeficijenta korelacije sa prinosom po biljci (r= 0.935 i r= 0.973 u Skoplju i Strumici). Nešto manju vrednost je imao koeficijent korelacije za masu semena po ljusci (r= 0.693 i r= 0.729) i masa 1000 semena (r= 0.627 i r= 0.680). Analiza path koeficijenta je koriš ena za razdvajanje direktnih i indirektnih uticaja ispitivanih svojstava na prinos semena. Broj ljuski po biljci (p=0.759 i p=0.877 za Skoplje i Strumicu) i masa semena po ljusci (p=0.216 i p=0.225) su imale najve i direktni efekat na prinos semena po biljci u obe lokacije. Nešto manja vrednost ovog pokazatelja izra unata je za masu 1000 semena (p=0.056 i p=0.010). Koeficijent determinacije (R2) je iznosio 0.94