Vol.61, no.spe: e18000320, 2018
http://dx.doi.org/10.1590/1678-4324-smart-2018000320 ISSN 1678-4324 Online Edition
BRAZILIAN ARCHIVES OF BIOLOGY AND TECHNOLOGY
A N I N T E R N A T I O N A L J O U R N A L
Power Flow Analysis and Self-recovery of Electrical Energy
Distribution Network Using Artificial Neural Networks
Fabio da Silva
Avelar
1*,Paulo Cícero
Fritzen
1,Mariana Antônia Aguiar
Furucho
11 Programa de Pós-Graduação em Sistemas de Energia, Universidade Tecnológica Federal do Paraná, Curitiba, PR, Brasil.
ABSTRACT
A computational model for self-recovery of electricity distribution network was developed to simulate it, emulated by the IEEE 123 node model. The electrical system considered has automatic switches capable of identifying a momentary failure in the line and finding the best reconfiguration for its reclosing. An artificial neural network (ANN), backpropagation, was used to classify the type of failure and determine the best reconfiguration of the distribution network. Initially, five power failure scenarios were simulated in certain different parts of the power grid, and power flow analysis via OpenDSS was performed. Next, the most suitable switching was observed within the shortest time interval to restore the power supply. With the purpose of better visualization to identify the reclosing, an implementation was carried out via ELIPSE SCADA. In this way, it is possible to identify the faulted segment in order to isolate it, leaving the smallest number of consumers without power supply in shortest possible time. With the results of the simulations, tests and analyzes were performed to verify their robustness and speed, in the expectation that the model developed be faster than an experienced Operating Distribution Center.
Keywords: Distribution Networks, Optimization, Self-recovery of networks, Smart Grid.
INTRODUCTION
The availability of electric energy represents an improvement in the quality of life of the population. As soon as an electric energy distribution system is installed, the local population immediately has countless benefits, both from the point of view of greater domestic comfort and better possibilities of employment, production towards more equipment and machines in operation, associating this with a higher production [1]. In this context, the constant search for the improvement in the quality of distributed electricity to consumers has been a motivating factor for a series of changes, both in the legal and regulatory instruments, and in the organization of companies in the direction of their strategies [2].
According to [3], self-healing is a system capable of detecting, analyzing, responding and restoring faults in the electrical energy network (EE) automatically (and in some cases instantaneously). This system uses real-time information, generated by sensors arranged in the distribution network to respond reactively (when service has already occurred) or proactive (still without restriction to the contracted service) to network problems, automatically avoiding or mitigating blackouts or problems with the quality of energy and the discontinuity of services.
As one of the features of the smart grid, self-healing aims to improve network reliability and has a rapid response when a Distribution Network (RD) failure occurs, isolating it and reducing the period of power failure in the network [4].
The benefits of applying the concept of self-healing in electrical systems include: (i) rapid restoration of the system to the operating mode; (ii) restoration of more loads and (iii) less need to send field teams to reconfigure the network [5].
Therefore, knowing the potential of the smart grid and its functionalities, such as self-healing, it is possible to solve the problem of disconnection of electricity distribution networks. For this, an artificial neural network, backpropagation, was applied to reconfigure an electrical energy distribution network in adequate time. The purpose of this work is to restore an electricity distribution network, represented by the IEEE model 123 nodes, according to the National Electric Energy Agency.
The modern power grid has evolved into a highly interconnected, complex and interactive system. The growing demand for energy independence, modernization of old infrastructure with new technologies, integration of multiple renewable energies and storage, more efficient use of energy, self-healing and resilience to natural disasters and attacks, coupled with the pressure for sustainable development, have motivated the development of intelligent network in the 21st century [6].
MATERIAL AND METHODS
This article has the character of experimental bibliographical. It is based on information from the IEEE Xplore Magazine regarding self-recovery in the areas of electricity distribution network and information from COPEL (Local Electric Power Distributor) and ANEEL (National Electric Energy Agency).
Artificial Neural Network (ANN)
With respect to the storage of information, it can be emphasized that each interaction between the simple units is represented by an associated weight, varying according to the efficiency of the connection. The assessment of the environment provides information to build a knowledge base and is part of the learning process, and this process is basically responsible for adapting weights to the connections made in response to environmental stimuli [7].
In this paper we used an artificial neural network (ANN), backpropagation, which considers five different types of failure to solve the reclosing restoration problem.
IEEE 123 nodes test feeder and tools used
In this work the proposal is a self-healing and restoration technique, in an IEEE 123 node test feeder model [8]., because it is widely used and diffused in the academic environment, using Artificial Neural Network (ANN).
Firstly, a study was performed on the power flow in the model through OpenDSS software. Using the software information provided by the simulations, a database was built, consisting of more than two thousand information per failure. From the possession of the values of the currents in the branches of the electric network, 5 scenarios of failures in this network were built. These scenarios were then simulated by OpenDSS.
This database was then used to train ANN, which once trained, several tests were performed to obtain the desired information, thus evaluating the classification of the resulting failure type.
Since the switch was already known, a graphical interface was built by using the software ELIPSE, in order to simulate a Distribution Operation Center (DOC).
IEEE 123 node test feeder model
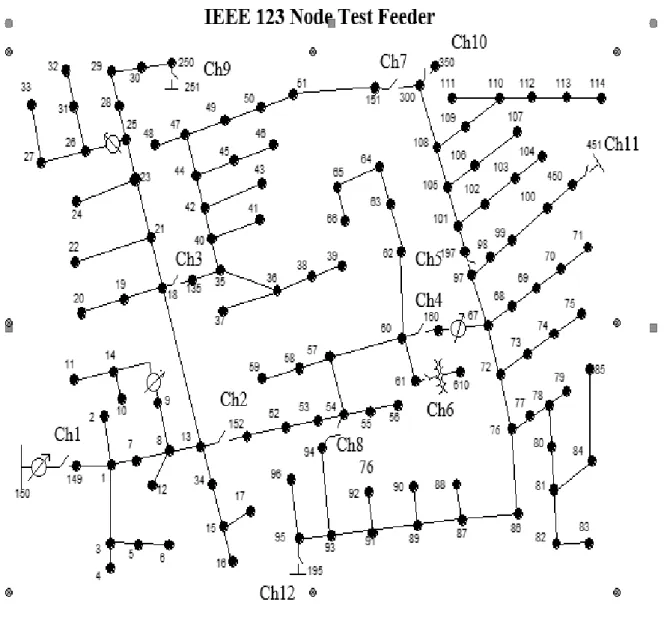
The IEEE 123 nodes test feeder model was chosen because it is an already consolidated model, operating at a nominal voltage of 4.16 kV. Although this is not a popular voltage level, it provides voltage drop problems that must be solved with the application of voltage regulators and shunt capacitors.
Figure 1- shows the IEEE 123 node test feeder model.
The Open Distribution System Simulator
The Open Distribution System Simulator (OpenDSS, or simply DSS) is a simulation tool for electricity distribution systems.
OpenDSS refers to the open source DSS implemented as a standalone executable program for the in-process Dynamic Link Library (DLL) server designed to be moved from a variety of existing software platforms. The executable version has a basic user interface.
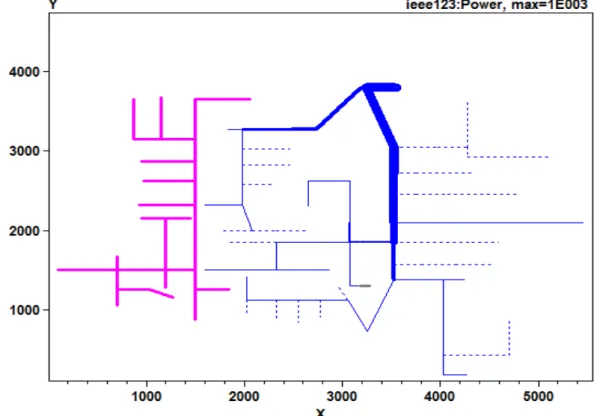
Figure 2 represents the IEEE 123 node test feeder model in OpenDSS. In it, there is a main power impeding the supply the electric circuit loads, due to a fault in the substation premises.
Figure 2 - shows the scenario of simulation via the software OpenDSS.
Table 1 shows the failures of the IEEE model and OpenDSS solutions. The normal line represents the default configuration of the software. Within a failure there are alternatives to reestablish electric power, depending on where it is located. The letters "a, b, c, d and e" are the possible alternatives without a simultaneous failure, and the numbers 0 and 1 represent the open and closed key, respectively.
Treatment of power flow results with artificial intelligence
With the results of the OpenDSS simulations, a spreadsheet with the electric currents was elaborated in each part of the system, that is, each piece between two consecutive posts.
Table 1 - shows the failures of the IEEE model and OpenDSS solutions.
Failure ch1 ch2 ch3 ch4 ch5 ch6 ch7 ch8 ch9 ch10 ch11 ch12
Normal 1 1 1 1 1 1 0 0 0 0 0 0
Failure1
a 1 0 0 1 1 1 1 0 0 1 0 0
b 1 0 0 1 1 1 1 0 0 0 1 0
c 1 0 0 1 1 1 1 0 0 0 0 1
Failure2
a 1 1 0 1 1 1 0 0 0 0 0 0
b 1 1 0 1 1 1 0 0 1 0 0 0
c 1 1 0 1 1 1 0 0 0 1 0 0
d 1 1 0 1 1 1 0 0 0 0 1 0
e 1 1 0 1 1 1 0 0 0 0 0 1
Failure3
a 1 0 1 0 1 1 1 0 0 0 0 0
b 1 0 1 0 1 1 1 0 1 0 0 0
c 1 0 1 0 1 1 1 0 0 1 0 0
d 1 0 1 0 1 1 1 0 0 0 1 0
e 1 0 1 0 1 1 1 0 0 0 0 1
Failure4
a 1 1 1 0 0 1 1 0 0 0 0 0
b 1 1 1 0 0 1 1 0 1 0 0 0
c 1 1 1 0 0 1 1 0 0 1 0 0
Failure5
a 1 1 1 1 0 1 0 0 0 0 0 0
b 1 1 1 1 0 1 0 0 1 0 0 0
c 1 1 1 1 0 1 0 0 0 0 1 0
d 1 1 1 1 0 1 0 0 0 0 0 1
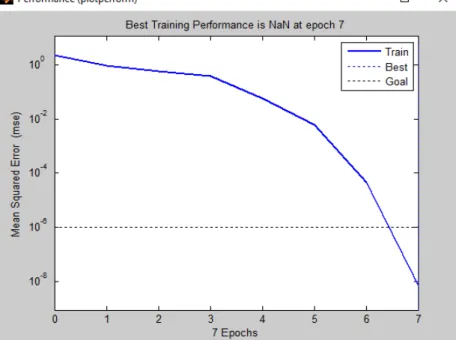
Figure 3 shows the training performance graph. It is verified that before reaching the seventh epoch the mean square error is reached within the established limits.
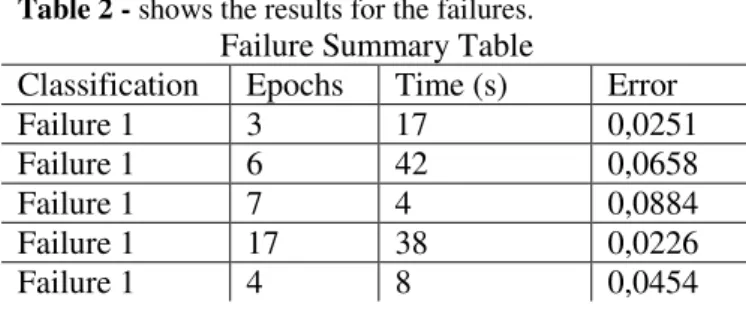
Table 2 shows the results of the training performed in the neural network for each type of failure, the number of times that each training took to reach the solution, the time in seconds and the mean square error for each situation.
Table 2 - shows the results for the failures.
Failure Summary Table
Classification Epochs Time (s) Error
Failure 1 3 17 0,0251
Failure 1 6 42 0,0658
Failure 1 7 4 0,0884
Failure 1 17 38 0,0226
Failure 1 4 8 0,0454
Elipse Simulation Software
One way to illustrate the necessary switching in a post-failure situation in the 123 node distribution network was through the Elipse software.
Elipse is ideal for mission-critical systems and control centers are a well-established SCADA tool for monitoring and controlling of processes, providing scalability and constant evolution for various types of applications, from simple HMI interfaces to complex real-time operation centers [9].
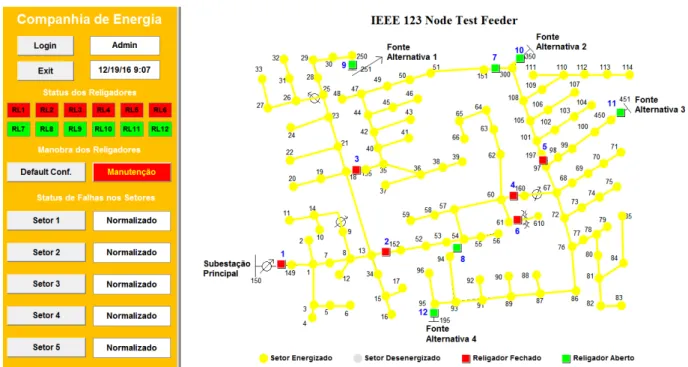
In Figure 4 a supervisory example is presented in a Distribution Operation Center (COD) through Elipse Software. The interface is user friendly and easy to view. Comparing the graphical part in DSS with the Elipse Software, the difference in this aspect is remarkable, because the visualization is easier on the interface in Elipse than in OpenDSS.
In Figure 4 a normal configuration of the IEEE 123 node test feeder model is presented, the yellow color being represented by the line in operation, keys in green are normally open, in red, normally closed.
Figure 4 - shows the normal configuration of the IEEE model.
Figure 5 - shows results from failure simulations via Elipse Software.
RESULTS AND DISCUSSION
According to [10], the solution of the problem of reestablishment of Electric Energy Distribution Systems (EEDS) is important. Thus, several works have been developed as: Comprehensive Search Methods [11], Automation Logics; Intelligent Systems [12], [13] [7].
Among the researches, it was observed that the researchers used many techniques of artificial intelligence to solve this type of problem, but little research was done using ANN for self-recovery, which motivated the choice of the technique.
In this way, it was possible to obtain the currents of each section through the power flow performed in the OpenDSS, and with this information to carry out the classification of the types of failures through an ANN and the demonstration of this information via Elipse Software. This is similar to what [13] has researched.
The way the problem was solved was innovative with respect to time, within the parameters stipulated by the National Electric Energy Agency (NEEA), that is, the recovery of the network took less than 3 minutes.
In Table II it can be noted that the time to perform the ANN training was adequate to what NEEA establishes.
The time in excess can be explored in the treatment of other variables, such as in the communication between the automation and the keys.
CONCLUSION
Through the DSS, the IEEE 123 node test feeder network was selected. Some adaptations were made, including keys that were disabled in the default configuration, which enabled them to be fed, in order to increase the reliability of the system.
For the study, these secondary feeds are capable of supplying the entire system's needs, given the new reality, since a defective part is isolated and will no longer participate in the total system load.
Another important point is how the failures were selected: by sectors, classifying them in five, that is, any failure within that region will provide the same switching solution to isolate it, although there may be alternative power sources through the failures.
In order to make the solution friendly to the operators of an electrical power system or Distribution Operating Center (DOC), Elipse Software was used and made clearer what were the alternatives for the post-failure situation, that is, the solution of the problem. It has shown that this type of solution was efficient in solving the failures. No simultaneous failures were considered, but the method can be applied in other systems to solve other failures in electricity distribution networks.
Thus, it is necessary to perform other experiments, to confirm the efficiency of the method in real time and make this new technique known.
REFERENCES
1. Mehl E L M., “Qualidade da Energia Elétrica,” pp. 1–8, 2013.
2. Bernardo, N. “Evolução da Gestão da Qualidade de Serviço de Energia
Elétrica no Brasil Evolução da Gestão da Qualidade de Serviço de Energia
Elétrica no Brasil,” 2013.
3. Vieira S, Granato,J;, “PLC como Tecnologia de Suporte à Smart Grid,” 2011.
4. IEA, “International Energy Agency Iea.,” in Technology Roadmap - Smart
Grid, 2011.
5. Oualmakran ,Y., “Self-healing for smart grids: Problem formulation and
considerations.,” in 3rd IEEE PES International Conference and Exhibition
2012, p. p.1–6.
6. Huang ,Q., Song ,Y., Sun,X., L. Jiang, and P. W. T. Pong, “Magnetics in
Smart Grid,” vol. 50, no. 7, 2014.
7. Decanini ,J. G. M. S., “Detecção, classificação e localização de faltas de
curto-circuito em sistemas de distribuição de energia elétrica usando sistemas
inteligentes,” Universidade Estadual Paulista., 2012.
8. IEEE, “Distribution Test Feeders,” 2014. [Online]. Available:
https://ewh.ieee.org/soc/pes/dsacom/testfeeders/.
9. Elipse, “No Title,” pp. 1–10, 2016.
10. Borges, T. T., “Restabelecimento de sistemas de distribuição utilizando fluxo
de potência ótimo,” UFRJ, 2012.
11. Glamocic, L. R., “Combinatory Search Method for Determining Distribution
Network Automation,” pp. 1–6, 2011.
12. Kaewmanee, S., Sirisumrannukul,J., , “Multiobjective service restoration in
distribution system using fuzzy decision algorithm and nodes-depth
encoding,” in In: 8th International Conference on Electrical
Engineering/Electronics, Computer, Telecommunications and Information
Technology, pp. 893 – 896, 2011.
13. Kondo D. V., A. D. E. Religadores, and A. Em, “Alocação de religadores
automatizados em sistemas de distribuição,” 2015.