Vol.49, n. 2 : pp. 323-337, March 2006
ISSN 1516-8913 Printed in Brazil BRAZILIAN ARCHIVES OF
BIOLOGY AND TECHNOLOGY
A N I N T E R N A T I O N A L J O U R N A L
Offshore Distribution Patterns of the Cyanobacterium
Trichodesmium erythraeum
Ehrenberg and Associated
Phyto- and Bacterioplankton in the Southern
Atlantic Coast
(Paraná, Brazil)
Adriana Siqueira∗, Hedda Elisabeth Kolm and Frederico Pereira Brandini
Marine Study Center; Federal University of Paraná - UFPR; C. P. 50.002; 83255-000; a.siqueira@ufpr.br; Pontal do Sul - PR - Brasil
ABSTRACT
Studies were carried out on Thrichodesmium erythraeum occurring on the inner shelf in the state of Paraná,Brazil.
Temperature, salinity, rainfall, wind velocity, total bacteria, bacterial biomass, chlorophyll-a, phytoplankton, Anabaena sp., Merismopedia sp. and T. erythraeum densities were measured in surface water. Centric and pennate
diatoms, Anabaena sp. and Merismopedia sp. were most abundant at 15 m isobath, while dinoflagellate abundance
was relatively constant among stations. Similarly, total bacterial densities were relatively homogeneous throughout
the sampling area, suggesting that blooms of T. erythraeum were not yet in the senescent phase. Results showed that
T. erythraeum was capable of surviving in relatively inhospitable environmental conditions, due to its ability to fix nitrogen and to photosynthesis at high light intensities.
Key words:Trichodesmium erythraeum, bloom, cyanobacteria, phytoplankton, south Brazil
∗ Author for correspondence
INTRODUCTION
Cyanobacteria are prokaryotes, gram-negative, photosynthetic microorganisms. Species with the ability to fix nitrogen are included in the Eubacteria group (Barbrook et al., 1998; Doyle, 1998). Cyanobacteria are distributed globally in soils, freshwater and marine environments. In marine environments, cyanobacteria may form blooms, similar to those of microalgae, which are often toxic to other organisms. Blooms are usually associated with eutrophication caused by the discharge of untreated domestic sewage and so primarily occur in estuaries and coastal waters. Yet, bloom complexity cause some authors to view the anthropogenic nutrient sources as
secondary triggering factors (Richardson, 1997).
The genus Trichodesmium is known to bloom
frequently in calm tropical and sub-tropical waters (Bidandda, 1997).
The dynamics of Trichodesmium and
dinoflagellates blooms occurring along the Brazilian shelves have been studied by Satô et al. (1963) in Pernambuco (northeastern state of Brazil), Rosa and Bucelato (1981) in Rio Grande do Sul (southern state of Brazil) and a few other studies in the state of São Paulo (southern Brazil; Gianesella-Galvão et al., 1995; Kutner and Sassi, 1978).
The first large-scale descriptions of the
distribution of Trichodesmium in southeastern
concentrations of Trichodesmium occur in areas
dominated by tropical waters and that
concentrations decline greatly in winter, when sub-Antarctic waters reach the region (Brandini, 1988). On the shelf in the state of Paraná, large
concentrations of cyanobacteria, mostly
Trichodesmium sp., were recorded in November
(late southern spring) 1987 at the water surface between the 25 and 60 m isobaths, and in the subsurface layers between the 100 and 300 m
isobaths (Brandini et al., 1988). Also, blooms of T.
erythraeum were observed in the states of São
Paulo and Paraná (southern Brazil), which were affected by the tropical waters of the Brazil Current (Fernandes and Brandini, 1999).
In February 2000, a bloom of T. erythraeum with
ca. 100 km of extension was observed at about 80 km from the coast, between the Superagüi Island (Paraná) and southern Cardoso Island (São Paulo) (CETESB, 2000). Due to the scarcity of studies of southern cyanobacterial blooms and the ecological importance of these nitrogen-fixing organisms, we initiated the study described herein. Our objective
was to investigate the distribution and seasonal
dynamics of T. erythraeum blooms and the
associated phytoplankton groups, and attempt to associate these dynamics with variations in the biotic and abiotic environment.
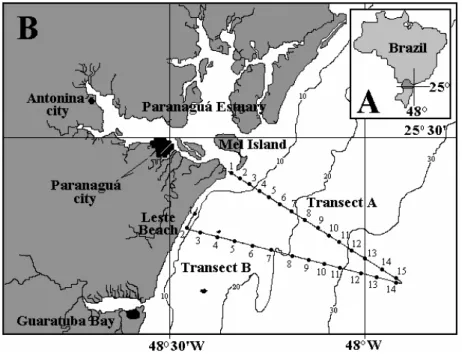
STUDY AREA
The coast of Paraná is 105 km in length, between 25º12’44”S - 48º01’15”W, and 25º58’38”S - 48º35’26”W (Fig. 1). Paranaguá and Guaratuba Bays are two large estuarine systems that include large freshwater inputs and relatively large quantities of both natural and anthropogenic organic and inorganic nutrients, which are then carried to the inner shelf, mainly during the rainy
season (summer) (Noernberg, 2001). The
continental shelf of Paraná is part of the South Brazil Bight (S.B.B.) and is relatively broad, with a maximum width of 180 km off the Mel Island.
Figure 1 - Map of the study area. A) location of the study region in Brazil; B) organization of transects A and B on the coastal shelf.
Three water masses characterize the local hydrographic system: Coastal Waters (CW), Tropical Waters (TW) and South Atlantic Central Waters (SACW) (Castro Filho et al., 1987; Emilsson, 1961). TW are generally warm,
oligotrophic surface waters, while SACW are cold but rich and found in the lower water column (Brandini et al., 1988; Brandini, 1990; Emilsson,
1961; Matsuura, 1986; Matsuura, 1996).
ecosystem is relatively low in the upper layers, but may increase greatly in deeper waters at the nutricline level, where maximum levels of
chlorophyll a have been recorded in austral
Summer (Brandini et al., 1988; Brandini, 1990).
MATERIAL AND METHODS
From November 1998 to March 1999, monthly sampling surveys were conducted using a S/V “Formalhaut” boat from the Brazilian Navy. Surface water was collected with a bucket, once per station per sample. Stations were sampled every 15 minutes along two transects established on the inner shelf, from the coast to 40 miles offshore (25º41’33”S - 48º23’49”W; Fig. 1). Due to climatic conditions of each trip, a minimum of 21 (in December) to a maximum of 25 (in November) locations were sampled.
Temperature was measured with a mercury thermometer and salinity was measured by refractometer (ATAGO, S/Mill, Japan). Rainfall and wind velocity were provided by the Marine Physics Laboratory of the Federal University of Paraná. Statistical analysis used the averages for rainfall and wind velocity calculated over a 4 day interval (i.e. the sampling day and the prior 3 days).
A random, 100 ml, sub-sample of the surface water was fixed with neutralized formalin solution (0.4%) with Bengal Rose stain (18 to 20 drops of a 1 mg/100 ml solution) for future phytoplankton and cyanobacteria counts. Samples were then kept in a sedimentation chamber for 24 hours after which they were examined with an inverted Zeiss microscope (Axiovert 100), following settling count technique (Utermöhl, 1958).
To count the number of filament groups, each
sample was filtered through a 100 µm mesh,
collected in a square Petri dish and viewed with an
Olympus (SZH) stereomicroscope. Average
number of cells within a filament and average cell length were calculated from a random sample of 50 filaments selected among the total samples. The
identification of T. erythraeum was made by the
kind collaboration of Dr. Luciano Fernandes of the
Federal University of Paraná. Chlorophyll-a
concentration was determined by fluorimetry, following Strickland and Parsons (1972). Due to
technical problems, no chlorophyll-a data were
available for February 24, 1999, and thus average
values were substituted on that day in the analyses to avoid missing values.
For the quantification of total bacteria, 15 ml of water samples were immediately upon collection preserved in 4% formaldeyde p.A. Bacterial count and biomass quantification was done following Parsons et al. (1984), using the fluorochrome
acridine orange. A conversion factor 0.4 pgC µm-3
was used, following Bjørnsen and Kuparinen (1991). Cluster Analysis was conducted using original, centered and square-root transformed data (Clark and Warwick, 1994). The Bray-Curtis index of similarity was used for distance estimation and clusters were formed using the
“unweighed pair-group average” method
(UPGMA) (Legendre and Legendre, 1983; Ludwig and Reynolds, 1988; Clark and Warwick, 1994).
Main tendencies of variation were detected through Principal Component Analysis (PCA). Original data were natural log (ln x) transformed and standardized. Linear correlation matrices of the biotic and abiotic variables with the plankton abundance were performed (Bouroche and Saporta, 1982; Ludwig and Reynolds, 1988). First, all stations were analyzed (PCA 1A and B - of the transects A and B); then, only distant stations (Cluster II to IV in transect A and II to VI in transect B) from the coast were analyzed (PCA 2A and B - of both transects). Missing data for stations located near the coast were replaced by the average value collected during all other months at the given station, while in the case of offshore stations, missing data were replaced by the value obtained at the prior station, in order to avoid
missing data in the analyses. Since cells of T.
erythraeum were extremely abundant, and hence
difficult to count, the number of filaments was used instead of the number of cells as an estimation of abundance.
RESULTS
Water temperature varied from 24oC (Tansect A:
Stations 1, 2, 3 and 4 on November 25, 1998) to
30oC (Transect B: Stations 8 and 9 on January 22,
1999). Generally, salinity increased, mainly in transect A, for the stations located between the 15
and 40 m isobaths.
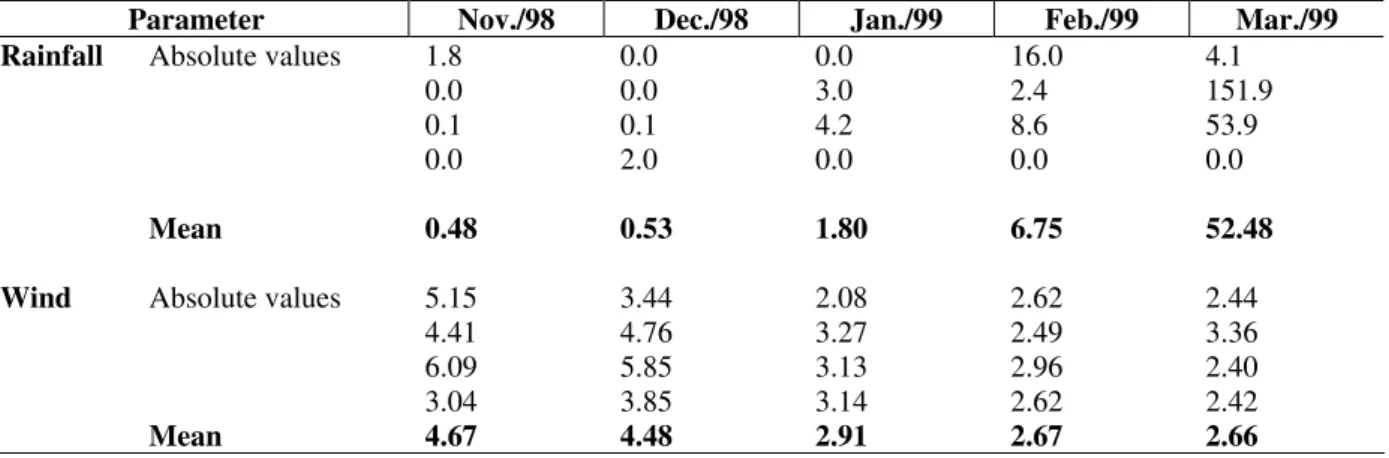
Table 1 - Daily arithmetical average of rainfall (mm) and wind velocity (m/s) registered in the three days prior to sample (from Nov/98 to Mar/99), and during the sampled days.
Parameter Nov./98 Dec./98 Jan./99 Feb./99 Mar./99 Rainfall Absolute values 1.8 0.0 0.0 16.0 4.1
0.0 0.0 3.0 2.4 151.9
0.1 0.1 4.2 8.6 53.9
0.0 2.0 0.0 0.0 0.0
Mean 0.48 0.53 1.80 6.75 52.48
Wind Absolute values 5.15 3.44 2.08 2.62 2.44
4.41 4.76 3.27 2.49 3.36
6.09 5.85 3.13 2.96 2.40
3.04 3.85 3.14 2.62 2.42
Mean 4.67 4.48 2.91 2.67 2.66
Transect A
1 2 3 4 5 6 7 8 9 10 11 12 13 14 15
Stations
0 1 2 3 4 5
T
o
ta
l
b
ac
te
ri
a
(1
0
6ce
ll
s.
m
l
-1)
25/11/98 21/12/98 22/01/99 24/02/99 24/03/99
Transect B
1 2 3 4 5 6 7 8 9 10 11 12 13 14 15
Stations
0 1 2 3 4 5
T
o
ta
l
b
ac
te
ri
a
(1
0
6ce
ll
s.
ml
-1)
25/11/98 21/12/98 22/01/99 24/02/99 24/03/99
The lowest average rainfall was 0.48 mm (November 25, 1998) while the highest was 52.5
mm (March 24, 1999). The highest average wind velocity during the study period was 4.67 m/s (November 25, 1998) and the lowest was 2.66 m/s (March 24, 1999) (Table 1). The maximum point wind velocity never exceeded 6 m/s, and can therefore be considered weak winds [Marone, pers. com].
Average total bacterial density was 1.9 x 10⁶ cells.
ml-1 in transect A, and 2.0 x 10⁶ cells.ml-1 in
transect B. The maximum density (4.7 x 10⁶
cells.ml-1) was observed on January 22, 1999 at
station 1, transect B, and the maximum (1.0 x 10⁶
cells.ml-1) was observed on January 22, 1999 at
station 7, transect B (Fig. 2). The common pattern during the study period comprised relatively high densities between the infra-littoral and the 10 m isobath, mainly in transect A (stations 1 to 3).
Overall average bacterial biomass was 80.4 µgC.l-1
(Transect A), and 83.17 µgC.l-1 (Transect B). The
maximum was 217 µgC.l-1 (Transect B: Station 1
on January 22, 1999) and the minimum was 49.1
µgC.l-1 (Transect A: Station 7 on November 25,
1998). Bacterial biomass was higher at all stations
located between the infra-littoral and the 10 m
isobath, mainly in transect A, as was the case for
total bacteria. Average chlorophyll-a concentration
was 2.47 µg.l-1 in transect A and 1.96 µg.l-1 in
transect B.
a)
Transect A
C
en
tr
ic
D
ia
to
m
s
(1
0
4 ce
ll
s.
l
-1 )
0 5 10 15 20 25 30 35
1 2 3 4 5 6 7 8 9 10 11 12 13 14
25/11/98 21/12/99 22/01/99 24/02/99 24/03/99
b)
Transect B
C
en
tr
ic
D
ia
to
m
s
(1
0
4 ce
ll
s.
l
-1 )
0 5 10 15 20 25 30 35
1 2 3 4 5 6 7 8 9 10 11 12 13 14
c)
P
en
n
at
e
D
ia
to
m
s
(1
0
4 ce
ll
s.
l
-1 )
0 4 8 12 16 20 24 28
1 2 3 4 5 6 7 8 9 10 11 12 13 14
d)
P
en
n
at
e
D
ia
to
m
s
(1
0
4 ce
ll
s.
l
-1 )
0 4 8 12 16 20 24 28
1 2 3 4 5 6 7 8 9 10 11 12 13 14
e)
Stations
D
in
o
fl
ag
el
la
te
s
(1
0
3 ce
ll
s.
l
-1 )
0 1 2 3 4 5 6 7 8
f)
Stations
Di
ni
fl
age
ll
at
es
(
10
3 ce
ll
s.l
-1 )
0 1 2 3 4 5 6 7 8
1 2 3 4 5 6 7 8 9 10 11 12 13 14 15
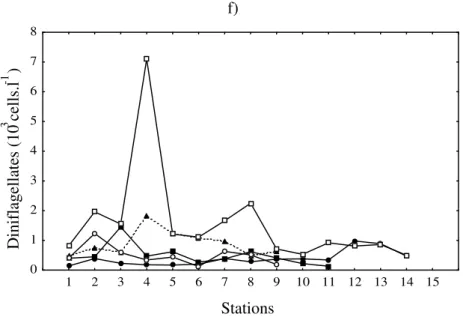
Figure 3 - Absolute values of cell density of: centric diatoms (a and b); pennate diatoms (c and d) and dinoflagellates (e and f) in the transects A and B.
a)
Transect A
A
n
a
b
a
en
a
s
p
.
(1
0
4 ce
ll
s.
l
-1 )
0 1 2 3 4 5 6
1 2 3 4 5 6 7 8 9 10 11 12 13 14 15
25/11/98 21/12/98 22/01/99 24/02/99 24/03/99
b)
Transect B
A
n
a
b
a
en
a
s
p
.
(1
0
4 ce
ll
s.
l
-1 )
0 1 2 3 4 5 6
1 2 3 4 5 6 7 8 9 10 11 12 13 14 15
c)
M
er
is
mo
p
ed
ia
s
p
.
(1
0
3 ce
ll
s.
l
-1 )
0 2 4 6 10 32
1 2 3 4 5 6 7 8 9 10 11 12 13 14 15
d)
M
er
is
m
o
p
ed
ia
s
p
.
(1
0
3 ce
ll
s.
l
-1 )
0 2 4 6 10 32
1 2 3 4 5 6 7 8 9 10 11 12 13 14 15
e)
Stations
T
.
er
yt
h
ra
eu
m
(
1
0
3 fi
l.
l
-1 )
0 2 4 6 12 60 320 20000
f)
Stations
T
.
er
yt
h
ra
eu
m
(1
0
3 fi
l.
l
-1 )
0 2 4 6 12 60 320 20000
1 2 3 4 5 6 7 8 9 10 11 12 13 14 15
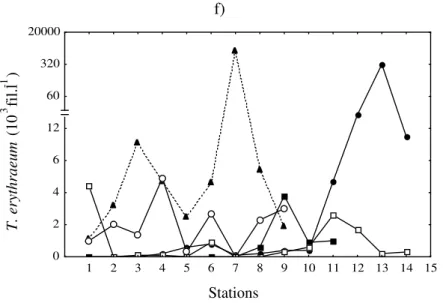
Figure 4 - Absolute values of cell density of: Anabaena sp. (a and b); Merismopedia sp. (c and d) and T. erythraeum (e and f) in the transects A and B.
The highest concentration (65.1 µg.l-1) was
observed at station 6, transect A, during a bloom
of T. erythraeum on December 21, 1998. The
lowest value (0.29 µg.l-1) was at station 9, transect
A, on January 22, 1999. In both transects, high
values of chlorophyll-a occurred at stations with
blooms of T. erythraeum. Otherwise, value were
relatively high from the coast to the 10 m isobath, mainly in transect A.
Centric and pennate diatom, and dinoflagellate abundances (maxima and minima) are described in Fig. 3. Average diatom densities were much higher extending from the coast to the 15 m isobath, after which they decreased towards the 40 m isobath. In contrast, dinoflagellate densities were relatively constant throughout the stations of transect A, while in transect B they were more abundant at stations 4 and 8 on March 24, 1999 and at
stations with Trichodesmium blooms (Transect A:
station 6 on December 21, 1998 and Stations 11 and 12 on January 22, 1999; Transect B: Stations 12 and 13 on November 25, 1998 and Station 7 on January 22, 1999).
Anabaena sp. and Merismopedia sp.
(cyanobacteria) were abundant in both transects up to the 15 m isobath, then decreased with the
distance from the shore. Maximum values were52
x 103 cells.l-1 at station 5, transect B, on December
21, 1998, and 29 x 103 cells.l-1 on February 24,
1999, at station 3, transect A, respectively (Fig. 4 a, b, c, d). Both were often absent between the 20
and 40 m isobaths. None or few filaments of T.
erythraeum were found in coastal stations (to the
15 m isobath), in late autumn and early spring. Blooms of these species were registered in late spring (November 25, 1998) and early summer (December 21, 1998 and January 22, 1999), between the 15 m and 40 m isobaths. A maximum
of 19 x 106 fil.l-1 was registered at station 6 of
transect A on December 21, 1998 (Fig. 4 e, f). Average length and average cell numbers of 50 randomly chosen filaments were 263 µm and 52 cells, respectively.
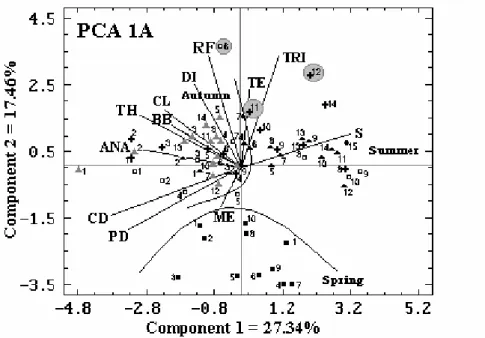
The first component of the PCA related to transect A explained 27% of the total variation of the abiotic and biotic variables and showed a strong tendency for higher salinity at stations 8, 9 and 10 on December 21, 1998 at stations 8, 9, 13 and 15 on January 22, 1999 and stations 5, 7, 8, 9, 10, 11, 12, 13 and 14 on February 24, 1999. Centric and
pennate diatoms, Anabaena sp., total bacteria,
bacterial biomass, and chlorophyll-a were higher
at stations 1, 2, and 3 on December 21, 1998, January 22, February 24, and March 24, 1999, station 4 on December 21, 1998 and station 13 on March 24, 1999 (Fig. 5 - PCA 1A).
The second principal component explained 17% of
the variation. Rainfall, temperature,
dinoflagellates, and T. erythraeum were higher at
station 6 on December 21, 1998 and stations 11
and 12 on January 22, 1999, and Merismopedia
The first component of the PCA related to transect
B explained 29% of the variation. T. erythraeum
abundance was higher at stations 7, 8, and 9 on January 22, 1999, and bacterial biomass, centric
and pennate diatoms, and Merismopedia sp. were
higher at stations 1, 2, 3, 4, 6, and 7 on November 25, 1998, at stations 1, 2, 3, 4, 5, 6, and 7 in December 21, 1998, and at station 6 in February 24, 1999 (Fig. 5 - PCA 1B).
The second component from the PCA explained 22% of the variation, and associated temperature, rainfall, total bacteria, and dinoflagellates being higher at stations 1, 2, 3, 4, 5, and 6 on January 22, 1999, and all stations on March 24, 1999
(autumn). Salinity and chlorophyll-a were higher
at stations 5, 8, 10, 11, 12, 13, and 14 on November 25, 1998 (spring), and at stations 9, 10, and 11 on December 21, 1998 (early summer) (Fig. 5 - PCA 1B).
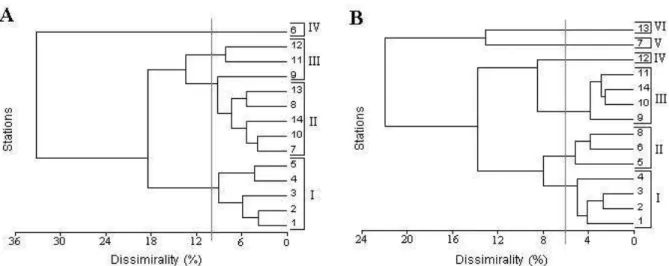
Cluster Analysis of the biotic variables of transect A formed the stations into four groups with a 10% dissimilarity. The first group of transect B, at 6% dissimilarity, included the four stations between the infralittoral and the 12 m isobath (Fig. 6). It is important to note that for both transects, group I included all stations influenced by the coastal environment and presenting relatively high values of biotic factors. Therefore, those stations (i.e. from 1 to 5 in transect A, and from 1 to 4 in transect B) were excluded from the subsequent statistical analysis (i.e. PCA).
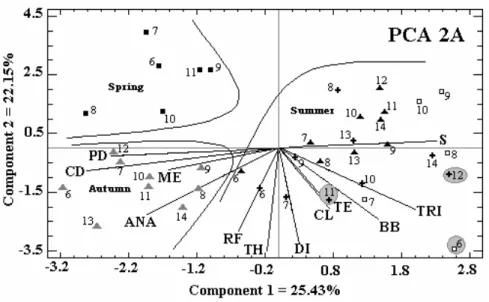
The first two principal components applied only to stations located between 15 and 40 m isobaths of transect A and between 12 and 40 m isobaths of transect B explained 48% of data variation in transect A (stations 6 to 14), and 47% of data variation (stations 5 to 14) in transect B.
The first principal component of transect A explained 25% of variability. Correlation was
positive for salinity,T. erythraeum and, to a lower
extent, for bacterial biomass, temperature and
chlorophyll a in the majority of the stations during
the summer and was positive for centric and
pennate diatoms, Merismopedia sp., and Anabaena
sp. at station 6 on February 24, 1999, and at all stations on March 24, 1999 (autumn). The second principal component of transect A explained 22% of the variation. Positive relationships between rainfall, total bacteria, dinoflagellates, and for
chlorophyll- a, temperature, and bacterial biomass
were found at stations 6 and 7 on January 22, 1999 (Fig. 7 - PCA 2A).
In transect B, the first component explained 25% of variability. Positive correlations were detected
for T. erythraeum and chlorophyll-a at: 1) stations
7 and 8 on January 22, 1999; 2) stations 8 and 9 in February 24, 1999 and to a lower extend at 3) stations 11 in November 25, 1998, and 4) stations 9, 10, and 11 in December 21, 1998. On the other hand, positive correlations of centric and pennate diatoms, total bacteria, bacterial biomass and
Anabaena sp. were found at stations 6, 7, and 9 in
November 25, 1998 at stations 5, 6, 7, and 8 in December 21, 1998 and at station 6 in February 24, 1999. The second component explained 22% of the variation and correlating salinity with 1) stations 5, 8, 10, 11, 12, 13, and 14 in November
25,1998 (spring) and 2) stations 9, 10, and 11 in
December 21, 1998. Temperature, rainfall, and dinoflagellates were inversely correlated with 1) stations 5, 6, and 9 in January 22, 1999, and 2) all stations in March 24, 1999 (autumn) (Fig. 7 - PCA 2B).
DISCUSSION
The average drift current velocity off Mel Island was 11 cm/s towards the north [Noernberg, pers. com.], suggesting that, in the absence of cold fronts, a particle could travel approximately 285 km within 30 days. Therefore, it was unlikely that
the blooms of T. erythraeum observed over two
consecutive months were the same. Although, in November 1998 and January 1999, blooms were registered in consecutive stations in transects A
and B, that possibly could be isolated groups of T.
erythraeum that came from a greater bloom that
formed previously in the south.
Isolated filaments of T. erythraeum were also
encountered throughout the study period. In January and February of 1999, they were characterized by relatively large numbers of trichomes, and filamentous cells were recorded in coastal stations, which suggested that warm months were associated with development of the cyanobacterium in this region. Realtively few
filaments of T. erythraeum were found close to the
S = Salinity; TE = Temperature; PL = Rainfall; CL = Chlorophyll a; CD = Centric Diatoms; PD =
Pennate Diatoms DI = Dinoflagellates; ANA =Anabaena sp.; ME =Merismopedia sp.; TRI =T.
erythraeum;TH =Total Bacteria; BB = Bacterial Biomass.
Figure 6 - Clusters from the group analysis of the study stations, based on the biotic measurements obtained between November/98 and March/99 in transects A and B. Numbers I, II, III, IV, V, and VI indicate the station groups.
During the remainder of the study period, filament densities were relatively constant along both transects, except at the station that recorded blooms. However, centric and pennate diatoms,
Anabaena sp. and Merismopedia sp. were
common between the infralittoral and the 15 m isobath. This indicate that these phytoplankters and cyanobacteria needed nutrient-rich waters with
low salinity to develop, unlike T. erythraeum that
favored oligotrophic, saline waters (Brandini and Moraes 1986).
Cluster analyses suggested that nutrient-rich waters, originating from the Paranaguá estuarine system, could spread farther at transect A, which was closer to the river mouth. Consequently, abundance of the organisms that relied on dissolved organic nutrients to grow was higher in transect A than in transect B. In stations that did
not experience blooms of T. erythraeum,
concentrations of dinoflagellates were relatively stable, except in March 1999 in transect B where cell densities were highest up to regions contiguous to the 12 m isobath. Dinoflagellates were relatively more abundant in Summer, early
Autumn and in the vicinity of T. erythraeum
blooms. Although results refers to total
dinoflagelates, heterotrophic dinoflagelates could also be considered that, according to Strasburger
et al.(1983), fed on planktonic bacteria and algae.
No data are apparently available that describe
whether dinoflagellates feed on T. erythraeum.
Associations between these organisms and the
blooms suggest that they may consume
cyanobacteria, heterotrophic bacteria, or
heterotrophic nanoflagellates. Furthermore,
similarly to T. erythraeum, they found an ideal
habitat and multiplied. On the other hand, it was possible that dinoflagellates utilized the nitrogen
fixed by the Trichodesmium in nitrogen poor
waters.
The PCA results applied to off-coast sampling points of transect A showed a positive correlation
between blooms of T. erythraeum and
environmental parameters such as salinity,
temperature and chlorophyll-a. The PCA analysis
also showed a positive correlation between the cyanobacteria bloom and bacterial biomass. According to Mesquita (1993), healthy alive phytoplankton repel bacteria cells, however, when die under situations of nutrient limitation, phytoplankton cells may be attacked by bacteria. Thus, phytoplankton are directly converted in detrite and bacterial biomass. The gas vacuoles
present in T. erythreum cells enable them to stay
on the surface even in scenescence. Statistical analysis did not detect any significant variation on total bacterial population among the blooms detected, neither on transects A and B, nor on the other oceanic sampling stations. These results led to the conclusion that the blooms were at their maximum development stage. The results showed
that the T. erythraeum blooms occurred in calm
S = Salinity; TE = Temperature; PL = Rainfall; CL = Chlorophyll a; CD = Centric Diatoms; PD =
Pennate Diatoms DI = Dinoflagellates; ANA =Anabaena sp.; ME =Merismopedia sp.; TRI =T.
erythraeum;TH =Total Bacteria; BB = Bacterial Biomass.
Figure 7 - Distribution of sampled points, and of the biotic and abiotic values of the stations distant from the coast in transect A (PCA 2A) and transect B (PCA 2B) with the axes being the first two principal components.
No cyanobacteria bloom was detected at the end of summer and begining of autumn.
During the summer period, the Brazilian Current with oligotrophic waters mix-up with the Coastal Continental Shelf Waters (CCSW) of Paraná State,
making them nutrient poor waters and favoring the
development of T. erythraeum blooms. With the
confirmed that blooms of T. erythraeum formed along Paraná coast and also confirmed the findings of Lee (1989), Bell (1992) and Rörig et al. (1998)
that T. erythraeum was a nitrogen-fixing and
silicate free growing organism; its photosynthesis was performed at high light intensities and it was adapted to survive in areas with low competition, different from other cyanobacteria.
ACKNOWLEDGEMENTS
The authors are grateful to the Coordenação de
Aperfeiçoamento de Pessoal de Nível Superior
(CAPES) for the graduate fellowship and
Capitania dos Portos do Estado do Paraná for
providing logistical support. We also thank Dr. Luciano Fernandes for his help on cyanobacteria identification, MSc. Nilva Brandini for her valuable contribution with phytoplankton analysis, Dr. Marco Fábio Maia Corrêa for his pertinent comments on the manuscript, and Dr. Ricardo de Queiroz, Dr. Theresinha Monteiro Absher and Dr. James Roper for reviewing the English.
RESUMO
O propósito principal da presente pesquisa foi
investigar as florações de Trichodesmium
erythraeum na plataforma continental interna do
Estado do Paraná, Brasil. Foram medidas, em
águas de superfície a temperatura, salinidade,
bactérias totais, biomassa bacteriana, clorofila-a,
densidade fitoplanctônica, densidade das
cianobactérias Anabaena sp., Merismopedia sp. e
T. erythraeum. Ao contrário dos dinoflagelados,
cuja abundância foi relativamente constante em todas as estações, as diatomáceas cêntricas e
penadas, Anabaena sp. e Merismopedia sp. foram
mais abundantes até a isóbata dos 15 m. A densidade de bactérias totais também foi relativamente homogênea na área amostrada, o que
sugere que as florações de T. erythraeum não se
encontravam em fase senescente. Os resultados
confirmam que T. erythraeum é capaz de
sobreviver em condições ambientais relativamente inóspitas devido à sua capacidade de fixar nitrogênio e efetuar a fotossíntese em altas intensidades de luz.
REFERENCES
Barbrook, A. C.; Lockhart P. J. and Howe C. J. (1998), Phylogenetic analysis of plastid origins based on secA sequences. Current Genetic,34, 336-341. Bell, P. R. F. (1992), Eutrophication and coral reefs:
some examples in the Great Barrier Reef lagoon.
Water Res., 26 : (5), 553-568.
Bidandda, B. (1997), Trichodesmium bloom in Gulf of Mexico, Summer 1995. In: Harmful Algae News
(IOC), 12/13, 2.
Bjørnsen, P. K. and Kuparinen, A. (1991), Determination of bacterioplankton biomass, net production and growth efficiency in the southern ocean. Mar. Ecol. Prog. Ser., 71, 185-194.
Bouroche, J. M. and Saporta, G. (1982), Análise de
dados. Rio de Janeiro: Zahar.
Brandini, F. P. and Moraes, C. L. B. (1986), Composição e distribuição do fitoplâncton em áreas costeiras e oceânicas da Região Sueste do Brasil.
Nerítica, 1 : (3),9-19.
Brandini, F. P. (1988), Composição e distribuição do fitoplâncton na região Sueste do Brasil e suas relações com as massas de água (Operação Sueste - julho/agosto 1982). Cienc. Cult., 40 : (4),334-341. Brandini, F. P.; Moraes, C. L. B. and Thamm, C. A.
(1988), Shelf break upwelling, subsurface maxima of chlorophyll and nitrite, and vertical distribution of a subtropical nano- and microplankton community off southeastern Brazil (November 1985). In: Encontro Brasileiro de Plâncton, 3., Caiobá. Anais… Caiobá, Paraná.
Brandini, F. P. (1990), Hydrography and characteristics of the phytoplankton in shelf and oceanic waters off Southeastern Brazil during Winter (July/August 1982) and Summer (February/March 1984).
Hydrobiologia, 196,111-148.
Castro Filho, B. M.; Miranda, L. B. and Myiao, S. Y. (1987), Condições hidrográficas na plataforma continental ao largo de Ubatuba: variações sazonais e em média escala. Bol. Inst. Oceanogr., 35 : (2), 135-151.
Clark, K. R. and Warwick, R. M. (1994), Change in marine communities: an approach to statistical
analysis and interpretation. Natural Environment
Research Council, UK.
Companhia de Tecnologia de Saneamento Ambiental (2000), Florações de Algas Azuis (Trichodesmium
erythraeum) no Litoral dos Estados de São Paulo e
Paraná. São Paulo: CETESB. (Relatório Técnico). Doyle, J. J. (1998), Phylogenetic perspectives on
nodulation: evolving views of plants and symbiotic bacteria. Trends in Plant Science,3,473-478.
Fernandes, L. F. and Brandini, F. P. (1999), Comunidades microplanctônicas no Oceano Atlântico Sul Ocidental: biomassa e distribuição em novembro de 1992. Rev. Bras. Oceanogr., 47 : (2),189-205. Gianesella-Galvão, S. M. F.; Costa, M. P. F. and
Kutner, M. B. (1995), Bloom de Oscillatoria
(Trichodesmium) erythraea (Ehr.) Kutz. in coastal
waters of the Southweast Atlantic. Publ. Esp. Inst.
Oceonograf., 11,133-140.
Kolm, H. E.; Schoenenberger, M. F.; Piemonte, M. R. P.; Souza, S. A.; Schnell and Scuhli, G.; Mucciato, M. B. and Mazzuco, R. (2002), Spatial Variation of Bacteria in Surface Waters of Paranaguá and Antonina Bays, Paraná, Brazil. Braz. Arch. Biol.
Technol., 45 : (1),27-34.
Kutner, M. B. and Sassi, R. (1978), Dinoflagellates from the Ubatuba region (Lat. 20º30’S - 45º60’ W). In: Brandini, F. P., Lopes, R. M.; Gutseit, K. S.; Spach, H. L and Sassi, R. (1997), Planctonologia na
Plataforma Continental do Brasil. Revizee -
Avaliação do Potencial Sustentável de Recursos Vivos na Zona Econômica Exclusiva.
Lee, R. E. (1989), Phycology. 2. ed. New York: Cambridge University Press. pp. 55-93.
Legendre, L. and Legendre, P. (1983), Numerical
Ecology. Amsterdam; Oxford; New York: Elsevier
Scientific Publ. Company.
Ludwig, J. A. and Reynolds, J. F. (1988), Statistical
ecology. A primer methods and computing. John
Wiley and Sons.
Matsuura, Y. (1986), Contribuição ao estudo da estrutura oceanográfica da região sudeste entre Cabo Frio (RJ) e Cabo de Santa Marta Grande (SC). Cienc.
Cult., 38 : (8), 1439-1450.
Matsuura, Y. (1996), A probable cause of recruitment failure of the brazilian sardine Sardinella aurita population during the 1974/75 spawning season. S.
Afr. J. mar. Sci., 17,29-35.
Mesquita, H. S. L. (1993), Densidade e distribuição do bacterioplâncton nas águas de Ubatuba (23ºS 45ºW), Estado de São Paulo. Bol. Inst. Oceanogr., 10,45-63. Noernbeng, M. A. (2001), Processos Morfodinâmicos
no Complexo Estuarino de Paranaguá - Paraná -
Brasil: um estudo a partir de dados in situs e
Landsat-TM . Tese (Doutorado), Universidade Federal do Paraná, Paraná, Brasil.
Parsons, T. R.; Maita, Y. and Lalli, C. M. (1984), Direct Counting of Bacteria by Fluorescence Microscopy.
In: A Manual of Chemical and Biological Methods
for Seawater Analysis. Pergamon Press.
Richardson, K. (1997), Harmful or exceptional phytoplankton blooms in the marine ecosystem. Adv.
Mar Biol., 31,301-385.
Rörig, L. R.; Yunes, J. S.; Kuroshima, K. N.; Schetinni, C. A. F.; Pezzuto, P. R. and Proença, L. A. O. (1998), Studies on the ecology and toxicity of Trichodesmium spp. Blooms in southern brazilian coastal waters.
Harmful Algae, UNESCO.
Rosa, Z. M. and Bucelato,T. C. (1981), Sobre a ocorrência de floração de Gyrodinium aereolum Hulburt (Dynophycea) no litoral sul do Estado do Rio Grande do Sul. Iheringia - Botânica, 21,169-179. Satô, S.; Paranaguá, M. N. and Eskinazi, E. (1963), On
the mechanism of the red tide Trichodesmium. In: Recife northeastern Brazil, with some considerations of the relation to the human disease “Tamandaré Fever”. Trab. Oceanogr. Univ. Fed., PE, 5,7-49. Strasburger, E.; Noll, F.; Schenck, H. and Schimper,
A. F. W. (1983), Lehrbuch der Botanik. Gustav. Fischer. Verlag., Stuttgart, New York.
Strickland, J. L. H. and Parsons, T. R. (1972), A Practical Handbook of Sea water Analysis 2nd Bull
Fish Res. Bd. Can., 122,1-172.
Utermöhl, H. (1958), Zur Vervollkomnung der quantitativen phytoplankton. Methodik. Mitt. int. Ver.
theor. angew.Limnol., 9,1-3.