(ADMS4LV) – Improved observability of LV grids based on advanced analytics
Konstantinos KOTSALOS André SIMÕES Luís MARQUES
EFACEC – Portugal EFACEC – Portugal EFACEC - Portugal
[email protected] [email protected] [email protected]
Filipe CAMPOS Clara GOUVEIA Henrique TEIXEIRA
EFACEC - Portugal INESC TEC – Portugal INESC TEC- Portugal
[email protected] [email protected] [email protected]
Gil SAMPAIO Jorge PEREIRA Luis SECA
INESC TEC – Portugal INESC TEC – Portugal INESC TEC – Portugal [email protected] [email protected] [email protected]
ABSTRACT
This paper aims to describe the main outcomes of the ADMS4LV project – Advanced Distribution Management System for Active Management of LV Grids. ADMS4LV is a R&D project that targets the development and demonstration of a system with adequate tools to optimise the management and operation of Low Voltage (LV) networks towards the effective implementation of Smart Grids. This work details the main functionalities of ADMS4LV and discusses their implementation. Results obtained from the demonstration, namely regarding the algorithms which using advanced data analytics, accomplish to operate LV networks with low observability (i.e., with few real-time measurements) and without having full knowledge of the networks’ technical characteristics, such as the consumers’ phase connection. The assessment of the results shows the adequacy of the ADMS4LV solutions for deployment in distribution networks with current infrastructures deferring unnecessary investments in sensory devices.
INTRODUCTION
Distribution Networks (DN) have been in the centre of interest of smart grids deployment, allowing the large-scale integration of Distributed Energy Resources (DER), such as Microgeneration (μG) units, Electric Vehicles (EVs), and the deployment of demand-side integration schemes [1]. The deployment of the smart grid concept has commenced not only through the ubiquitous deployment of advanced automation and metering apparatus along the Low Voltage (LV) grid, but also with the adoption of extensive monitoring and control functionalities, embedded in Advanced - Distribution Management System (A-DMS).
Despite the current rollout of Smart Meters (SMs) at consumers’ premises and Intelligent Electronic Devices (IEDs) such as sensing devices along the network, which can provide important data to the operator, in most cases the grid characteristics are not fully known (e.g. branches’ physical characteristics, phase connection of
the loads). In addition, the communication infrastructures for transmitting network data typically present augmented latency and thus, real-time data for the majority of network points are not available and/or synchronised.
Recent studies have addressed the possibility of considering controllable DERs beyond DSO assets for the optimisation of the LV grid’s operation, such as distributed Battery Storage System (BSS), controllable loads under demand response schemes and μG units [2-8]. Most of the research works in the literature do not consider the limited observability of LV networks for the optimisation of their operation. Therefore, advanced monitoring algorithms capable of estimating the operational state of the LV grid are needed to overcome the lack of measurements. Furthermore, such algorithms should also be capable of determining the unknown connection phases of end-consumers in order to make the possible control actions more effective.
This paper presents the conceptual architecture of the solutions developed under the scope of the project ADMS4LV [7] – Advanced Distribution Management System for Active Management of LV Grids. The ADMS4LV’s main focus is to develop and demonstrate advanced monitoring and control tools for the operation of future LV networks. Some of its key functionalities, which are presented and discussed in this work, take advantage of historical smart metering data for improving the characterisation of LV networks (e.g., connection phase identification) as well as their real-time observability with reduced real-time monitoring requirements. The increased observability is crucial to enhance the operation of these networks, therefore contributing to the overall optimisation of the electrical power systems.
SYSTEM OVERVIEW AND DESCRIPTION
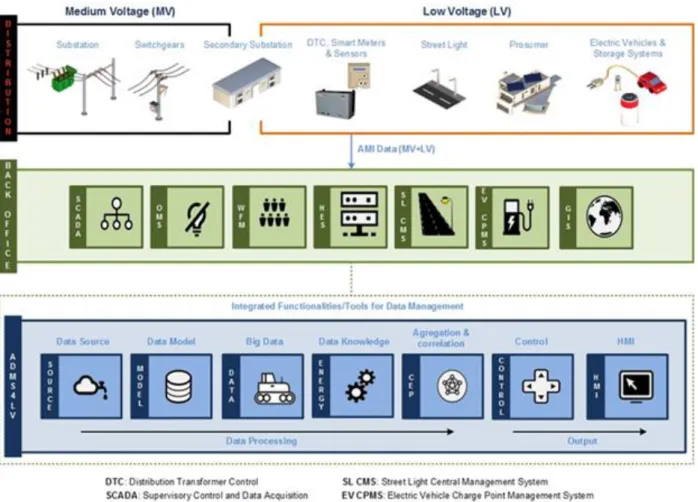
The ADMS4LV architecture is depicted in Figure 1. Through the management of high quantities of data (Big Data) using processing techniques (Aggregation and Correlation) to extract relevant features that, combined
with the known characteristics of the network (Data Model) and the relations between the electric variables (Data Knowledge), it is possible to infer about the real operation conditions of the network and to provide automatic controls to maintain its safety and efficient operation. The main features of ADMS4LV project is to take advantage of historical smart metering data for improving the characterisation of LV networks (e.g. phase identification) and its observability in real-time with reduced real-time monitoring requirements. Distinctive functionalities integrate this system, namely:
• Data management and processing module is responsible for verifying the consistency of the collected data and reconstruct historical missing data. In case of systematic failures or errors, alarms can be triggered for an efficient identification of possible equipment’s communication failure. The data can then be used in other network applications (e.g., voltage control) as well as by the other modules since their efficiency is dependent on the consistency and integrity of the information provided. • State Estimation and IED selector: since one
of the goals of ADMS4LV is to increase the
DSO’s awareness about the network operation conditions, this tool will be responsible for providing a reliable operational state of the network. It is based on Artificial Intelligence (AI) techniques that are able to estimate the operational state of the network with limited knowledge of their topology and characteristics, and a reduced number of real-time measurements [9, 10]. The group of IEDs and SMs communicating in real-time will dynamically change according to their location, the network’s topology and location of flexible DER, in order to maximise the network’s observability, while minimising the number of measurements required. This module is able to estimate both voltage magnitudes on nodes and power consumptions, but in the present work only voltage magnitudes results are shown. • Phase identification module of the ADMS4LV
is able to map the phase connection of LV consumers (with installed SMs) through the treatment of the time series measurements provided by the AMI deployed in LV networks.
This information is crucial for other network applications, such as active control tools for the LV networks and other power flow-based applications. The main advantage of this module is that it allows network mapping without the need of extensive field work, taking into account the voltage profiles provided by the SMs.
CASE STUDY
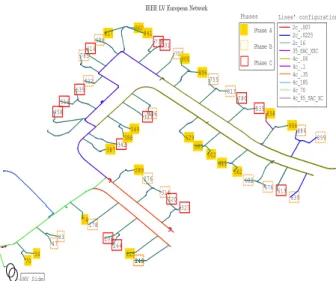
The ADMS4LV solution is being validated in laboratory environment before the deployment in a large-scale real-field demonstrator to ensure the effectiveness of all tools. For this purpose, a case study of a typical Portuguese LV network – adapted from the test case IEEE European LV Test Feeder was used [11]. The LV network used as test case is a 4-wire multi-grounded network (three-phase plus neutral) with load unbalancing along the network. In Figure 2 the single line diagram of the network used as case study is shown.
Figure 3 – Network used as test case.
A total of 55 consumers are present in the network. Their contracted powers vary in a range between 3.45 kVA and 10.35 kVA (single and three-phase loads) and each one following different load profiles in order to represent different customers. The power factor of end-consumers has been assumed to vary randomly between 0.8 and 1. In order to simulate different consumers’ behaviours scenarios, a Gaussian Distribution with mean equal to the base diagram (one per consumer) and a standard deviation of σ=10% was considered. A power flow algorithm was then used to generate one year of data, emulating real metering data. This approach enables a proper assessment of ADMS4LValgorithms by considering a realistic behaviour of a LV network.
RESULTS
In the sub-sections below the main results obtained for both state estimation and phase identification modules are described.
State Estimation
Table 1 summarises the scenarios used to test the state estimation module. Each defined scenario differs from the others in the number of SMs or IEDs that were used to compute the operational state of the network, i.e., those which will provide real-time measurements during the tool’s real-time operation. The selection of the IEDs to be used for each scenario is given by the IED selector algorithm, which defines a list of priority devices and their correspondent alternatives (if the priority ones are not available – e.g., offline) that can be used by the State Estimator in real-time. Such IEDs’ list is determined from a sensitivity and correlation analysis of the historical SMs’ records. It should be referred that the IED installed at the LV side of the secondary substation (DTC in Figure 1) is always considered (when available) and it is not taken into account in the number of SMs of Table 1.
Table 1 – State estimation test scenarios.
Scenario
No. No. of SMs Used % of SMs Used
1 6 11%
2 21 38%
3 39 71%
It is important to state that the one year of generated data was used to train the state estimation tool [9, 10] and that the presented results were computed based on only one state estimation running, i.e., the state estimation tool was only assessed for one time instant.
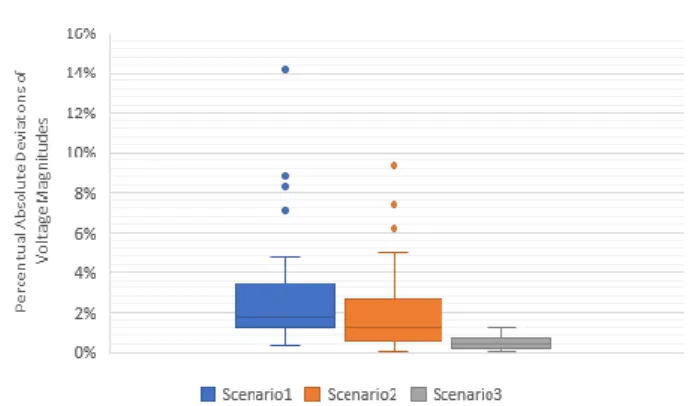
In Figure 3, the chart with the distribution of all the absolute deviations between the real and the estimated node voltage magnitudes (in percentage of the real values) is depicted for the three considered scenarios. As it can be seen, scenario 1 presents the higher percentage of deviation since the total number of real-time measurements used for computing the grid operational state is about 11%. However, the percentage deviation is decreased when a higher number of SMs is considered, as it can be noticed in scenarios 2 (only 38% of SMs was used) and 3 (71% of SMs were used), which attests the adequacy of this algorithm to avoid gathering all the real measurement data from the field. In fact, the mean deviation for scenario 2 is around 2.0% whereas for scenario 3 it is around 0.44%.
Looking at Table 2, where the quartile analysis for voltage magnitudes deviations is presented, it can be seen that the uncertainty in estimating the network state vectors (i.e., in this case voltage magnitudes) decreases with the increase of the number of real-time
measurements used to perform the state estimation.
Figure 4 – Quartile chart for the absolute deviations between real and estimated voltage magnitudes in percentage of the real values.
Table 2 – Quartile analysis: absolute deviations of the voltage magnitudes.
Deviation (V) Scenario 1 Scenario 2 Scenario 3
Minimum Value 0.85 0.11 0.02
1st Quartile 2.93 1.37 0.36
2nd Quartile 4.27 2.85 0.92
3rd Quartile 7.99 6.29 1.61
Maximum value 33.47 22.21 2.80
To sum up, the results show that with only 11% of real-time measurement data from the field (scenario 1), a good trade-off between the quality of the estimations and the amount of data required to be used can be achieved. Thus, the observability of existing networks can be improved and achieved without the need of deploying sensing and other IEDs in the entire network, which reduces the investment needs.
Phase Identification
For testing the phase identification algorithm, six different scenarios were considered that are shown in Table 2. The main variable in this case is the number of SMs for which the phase connection to the grid is known.
Table 3 – Phase identification test scenarios.
Scenario No. No. of Unknown Meters % of Unknown Meters 1 5 9% 2 10 18% 3 20 36% 4 35 64% 5 45 82% 6 50 91%
In Figure 6 the results of the phase identification are illustrated for each of the scenarios above identified. It
can be observed that the phase identification module is able to correctly identify the SMs’ phase connection even when a high percentage of SMs with unknown phase connection exists. In fact, only for scenario 6, where most of the SMs’ phase connection is unknown (91%), the accuracy is lower than 100% (about 70%), i.e., the phase identification module did not correctly identify the phase connection of all SMs. In this case, the phase connection of these SMs can be tackled by performing on-site inspections. Although such field work can be time consuming and costly for the grid operator, the employment of the phase identification module contributes to minimise these issues since only a small percentage of SMs would need to be intervened (less than 15% of the total SMs in the performed tests, i.e., only 8 out of the 55 SMs).
Figure 5 – Accuracy of phase identification for each scenario.
CONCLUSIONS
The main aspect of ADMS4LV project’s solutions refer to its capability of managing the LV network in coordination with the upstream MV network, even when most of the network’s characteristics are not known. Additionally, by solely using the most relevant measurements, it guarantees the observability of the network and reduces the amount of data required. Moreover, it is adaptive to the system’s dynamic behaviour introduced by changes in the characteristics of the networks’ nodes (e.g., installed DER).
The results show a high accuracy of the algorithms employed for carrying out the network’s monitoring, attesting the adequacy of this solution. The state estimation algorithm presents adequate results even when only a few real-time measurements are gathered from the field. The group of IEDs and SMs communicating in real-time is determined by the IED selector algorithm, which contributes to reduce the necessary data to perform state estimation. The phase identification functionality shows high accuracy even when above of 85% of the consumers’ phase connection is not known. This highlights the advantage of this module to increase the LV networks’ characterisation.
ACKNOWLEDGMENTS
This work has been developed in the scope of the “ADMS4LV – Advanced Management System for Active Management of Low Voltage Grids” project, under the program PORTUGAL 2020.
REFERENCES
[1] A. Madureira, L. Seca, and J. P. Lopes, Coordinated
Voltage Control in Distribution Systems under the Smart Grid Concept, in Proceedings CIRED 2012 Workshop, Integration of Renewables into the
Distribution Grid, 2012.
[2] S. Bruno. and M. La Scala, Unbalanced
Three-Phase Optimal Power Flow for the Optimization of MV and LV Distribution Grids. From Smart Grids to
Smart Cities: New Challenges in Optimizing Energy Grids, 2017: p. 1-42.
[3] P.C Olival, A.G. Madureira, and M. Matos,
Advanced voltage control for smart microgrids using distributed energy resources. Electric Power
Systems Research, 2017. 146: p. 132-140.
[4] K. Kotsalos, N. Silva, I. Miranda, and H. Leite,
Scheduling of operation in Low Voltage distribution networks with multiple Distributed Energy Resources. in CIRED 2018 Workshop, Ljubljana.
[5] S. Karagiannopoulos, L. Roald, P. Aristidou, and G. Hug. Operational Planning of Active Distribution
Grids under Uncertainty. in Proceedings of IREP'2017 Symposium. 2017.
[6] P. Fortenbacher, M. Zellner, and G. Andersson.
Optimal sizing and placement of distributed storage in low voltage networks. in 2016 Power Systems Computation Conference (PSCC). 2016.
[7] N. Silva, et al. LV SCADA-How to Effectively
Manage LV Networks with Limited Topology and Electrical Characteristics Data. in CIRED2015-23rd International Conference on Electricity Distribution. 2015.
[8] F. Campos, L. Marques, N. Silva, F. Melo, L. Seca, C. Gouveia, A. Madureira, and J. Pereira,
ADMS4LV – Advanced Distribution Management System for Active Management of LV Grids, in Proceedings CIRED 2017, Glasgow.
[9] P. N. P. Barbeiro, J. Krstulovic, H. Teixeira, J.
Pereira, F. J. Soares, and J. P. Iria, State estimation
in distribution smart grids using autoencoders, in
IEEE 8th International Power Engineering and Optimization Conference (PEOCO), Langkawi 2014.
[10] P. N. P. Barbeiro, H. Teixeira, J. Krstulovic, J. Pereira, and F. J. Soares, Exploiting autoencoders
for three-phase state estimation in unbalanced distributions grids, in Electric Power Systems Research, 2015, vol. 123, 108-118.
[11] K. P. Schneider, B. A. Mather, B. C. Pal, C. W. Ten, G. J. Shirek, H. Zhu, J. C. Fuller, J. L. R. Pereira, L. F. Ochoa, L. R. de Araujo, R. C. Dugan, S.
Matthias, S. Paudyal, T. E. McDermott, and W Kersting, “Analytic Considerations and Design Basis for the IEEE Distribution Test Feeders,” IEEE Transactions on Power Systems, vol. PP, no. 99, pp. 1-1, 2017.