A
A
s
s
s
s
e
e
s
s
s
s
i
i
n
n
g
g
t
t
h
h
e
e
i
i
m
m
p
p
a
a
c
c
t
t
o
o
f
f
t
t
h
h
e
e
L
L
i
i
s
s
b
b
o
o
n
n
S
S
t
t
r
r
a
a
t
t
e
e
g
g
y
y
o
o
n
n
t
t
h
h
e
e
E
E
u
u
r
r
o
o
p
p
e
e
a
a
n
n
S
S
o
o
c
c
i
i
a
a
l
l
M
M
o
o
d
d
e
e
l
l
–
–
W
W
h
h
a
a
t
t
c
c
h
h
a
a
n
n
g
g
e
e
s
s
w
w
i
i
l
l
l
l
t
t
h
h
e
e
E
E
u
u
r
r
o
o
p
p
e
e
2
2
0
0
2
2
0
0
S
S
t
t
r
r
a
a
t
t
e
e
g
g
y
y
b
b
r
r
i
i
n
n
g
g
?
?
P
P
a
a
u
u
l
l
o
o
M
M
a
a
r
r
q
q
u
u
e
e
s
s
I
I
s
s
a
a
b
b
e
e
l
l
S
S
a
a
l
l
a
a
v
v
i
i
s
s
a
a
S
S
é
é
r
r
g
g
i
i
o
o
L
L
a
a
g
g
o
o
a
a
2
2
0
0
1
1
1
1
W
W
P
P
n
n
.
.
º
º
2
2
0
0
1
1
1
1
/
/
1
1
6
6
DOCUMENTO DE TRABALHO WORKING PAPERDINÂMIA’CET – IUL, Centro de Estudos sobre a Mudança Socioeconómica e o Território ISCTE-IUL – Av. das Forças Armadas, 1649-026 Lisboa, PORTUGAL
Tel. 217938638 Fax. 217940042 E-mail: [email protected] http://dinamiacet.iscte-iul.pt/
A
A
s
s
s
s
e
e
s
s
s
s
i
i
n
n
g
g
t
t
h
h
e
e
i
i
m
m
p
p
a
a
c
c
t
t
o
o
f
f
t
t
h
h
e
e
L
L
i
i
s
s
b
b
o
o
n
n
S
S
t
t
r
r
a
a
t
t
e
e
g
g
y
y
o
o
n
n
t
t
h
h
e
e
E
E
u
u
r
r
o
o
p
p
e
e
a
a
n
n
S
S
o
o
c
c
i
i
a
a
l
l
M
M
o
o
d
d
e
e
l
l
–
–
W
W
h
h
a
a
t
t
c
c
h
h
a
a
n
n
g
g
e
e
s
s
w
w
i
i
l
l
l
l
t
t
h
h
e
e
E
E
u
u
r
r
o
o
p
p
e
e
2
2
0
0
2
2
0
0
S
S
t
t
r
r
a
a
t
t
e
e
g
g
y
y
b
b
r
r
i
i
n
n
g
g
?
?
Paulo Marques ♣ Isabel Salavisa ♣♣ Sérgio Lagoa ♣♣♣
WP n.º 2011/16
1. Introduction ... 3
2. Constraints to the reform of the European Social Model ... 4
2.1. Challenges to the European Social Model in the early 2000s ... 4
2.2. Institutional constraints: the European diversity, the deepening of the internal
market and the core of the European identity ... 6
3. The reform of the European Social Model ... 7
4. Assessing the social cohesion diversity ... 11
5. Assessment of the ESM’s reform: an econometric analysis ... 18
5.1. At‐risk‐of‐poverty rate: the importance of redistributive policies ... 19
5.2. Inequality of income distribution: the role of activation and education ... 20
Conclusion ... 22
References ... 24
Annex ... 27
♣Instituto Universitário de Lisboa (ISCTE-IUL), DINÂMIA’CET-IUL, Lisboa, Portugal Email: [email protected]. ♣♣Instituto Universitário de Lisboa (ISCTE-IUL), DINÂMIA’CET-IUL, Lisboa, Portugal Email: [email protected] ♣♣♣Instituto Universitário de Lisboa (ISCTE-IUL), DINÂMIA’CET-IUL, Lisboa, Portugal Email: [email protected]
DINÂMIA’CET – IUL, Centro de Estudos sobre a Mudança Socioeconómica e o Território ISCTE-IUL – Av. das Forças Armadas, 1649-026 Lisboa, PORTUGAL
Tel. 217938638 Fax. 217940042 E-mail: [email protected] http://dinamiacet.iscte-iul.pt/
2
A
A
s
s
s
s
e
e
s
s
s
s
i
i
n
n
g
g
t
t
h
h
e
e
i
i
m
m
p
p
a
a
c
c
t
t
o
o
f
f
t
t
h
h
e
e
L
L
i
i
s
s
b
b
o
o
n
n
S
S
t
t
r
r
a
a
t
t
e
e
g
g
y
y
o
o
n
n
t
t
h
h
e
e
E
E
u
u
r
r
o
o
p
p
e
e
a
a
n
n
S
S
o
o
c
c
i
i
a
a
l
l
M
M
o
o
d
d
e
e
l
l
–
–
W
W
h
h
a
a
t
t
c
c
h
h
a
a
n
n
g
g
e
e
s
s
w
w
i
i
l
l
l
l
t
t
h
h
e
e
E
E
u
u
r
r
o
o
p
p
e
e
2
2
0
0
2
2
0
0
S
S
t
t
r
r
a
a
t
t
e
e
g
g
y
y
b
b
r
r
i
i
n
n
g
g
?
?
11 AbstractWith the international crisis and the launching of the strategy Europe 2020 a cycle of European policy has come to an end. The purpose of this article is to conduct an empirical analysis of the Lisbon Strategy’s capacity to reshape the European Social Model (ESM) in the period 2000-10. In this paper, we argue that the ESM has been reshaped over the past decades towards an emphasis on activation policies rather than in income redistribution policies. This shift resulted from an attempt to match four dimensions: the deepening of the internal market, the Europeanization of employment and social policies, the European diversity regarding employment relations and social policies, and the goal of sustaining the core of European identity. During the period 2000-10, social cohesion has declined slightly, but a convergence process occurred in terms of the main social indicators. Econometric results indicate that activation policies and education levels play an important role in reducing inequality, whereas passive measures and the expenditure on social protection are more prone to fight poverty. The expenditure on R&D is important both to tackle poverty and to decrease inequality. Therefore, we conclude that a combination of passive and active measures is crucial both to maintain high levels of social cohesion and to modernize the ESM.
Keywords: Lisbon Strategy; Europe 2020; European Social Model; Activation; Social Cohesion
1 Paper presented at the EAEPE (European Association for Evolutionary Political Economy) Conference
on “Schumpeter’s Heritage – The Evolution of the Theory of Evolution”, 27-30 October 2011, Vienna, Austria.
DINÂMIA’CET – IUL, Centro de Estudos sobre a Mudança Socioeconómica e o Território ISCTE-IUL – Av. das Forças Armadas, 1649-026 Lisboa, PORTUGAL
Tel. 217938638 Fax. 217940042 E-mail: [email protected] http://dinamiacet.iscte-iul.pt/
3
1. Introduction
The future of the European Social Model (ESM) is a critical issue. Throughout the last decade the EU and its social model were significantly modified. This paper will focus on the 2000-2010 decade, analysing how the Lisbon Agenda reshaped the European Social Model (ESM). Launched in 2000 with the purpose of reforming the ESM, it was replaced in 2010 by the new strategy – Europe 2020. Now, it is probably the right time to reflect upon the achievements of the Lisbon Agenda. As regards the social dimension of the Lisbon Strategy, there is an extensive literature, which focuses mainly on innovations in terms of governance, particularly the Open Method of Coordination (De la Porte and Pochet, 2002), and the process of Europeanization of social policies. Besides, European institutions have empirically assessed the actual impact of the Lisbon Agenda. Our main contribution consists of conducting an empirical study of the Lisbon Strategy’s social impact within a framework that relies upon the challenges the ESM has faced. Thus we examine the role played by the Lisbon Strategy in reshaping the ESM, assessing its transformation and the impact it had on social cohesion.
As a result of the challenges faced by the EU in the early 2000s, the ESM has undergone substantial shifts, towards the provision of activation rather than income redistribution (Pascual, 2007; Rodrigues, 2009; Jepsen and Pascual, 2006). We will further argue that this transition derived from two factors. Firstly, given the history of the European construction, there was an attempt to reconcile the core of European identity with the deepening of the internal market. The so called European identity is based on the existence of an alternative model, with greater social cohesion, one that is different from a pure-market approach like the one which is advocated by the United States. Secondly, to deal with the heterogeneity across countries, the Europeanization of employment and social policies has been achieved through the transition towards activation, a concept that can be ‘adapted’ by each country, given that it does not exist a unique activation model. In short, we try to claim that a new paradigm has emerged, which is compatible with the internal market, the European diversity, the need to Europeanize social and employment policies, and the goal of sustaining the levels of social cohesion.
The article is organised in the following way. Firstly, we begin by discussing the changes experienced by the ESM over the past decade, debating the challenges it has faced, discussing how the process of Europeanization of social policies has been articulated with European diversity, and conclude by presenting the main features of the new paradigm. Secondly, we conduct an extensive empirical analysis for the period 2000-2010. Finally, we draw several conclusions and we put forward the implications of our research.
DINÂMIA’CET – IUL, Centro de Estudos sobre a Mudança Socioeconómica e o Território ISCTE-IUL – Av. das Forças Armadas, 1649-026 Lisboa, PORTUGAL
Tel. 217938638 Fax. 217940042 E-mail: [email protected] http://dinamiacet.iscte-iul.pt/
4
2. Constraints to the reform of the European Social Model
Before presenting the main features of the new paradigm, we will discuss two aspects that contributed to its emergence: firstly, the challenges that the EU was facing in the early 2000s, and secondly how the institutional characteristics of the European construction have constrained the reform of the ESM. Indeed, the EU has tried to overcome the tension between the European diversity in terms of employment and social policies and the increasing call for European policies in these fields (which up to that point had remained mainly at the national level), especially because of the deepening of the internal market.
2.1. Challenges to the European Social Model in the early 2000s
As highlighted in the literature, a set of interconnected factors challenged the ESM in the early 2000s, namely the globalisation process, the European incapacity to achieve an economic growth comparable to that of their main competitors, and the ageing tendency in Europe.
Any analysis regarding the future of the ESM has to address the globalisation process. Three aspects show how globalisation is relevant. Firstly, there is a problem resulting from the competition for taxes which has been boosted by the dramatic increase of the international mobility of capitals. Given that the social policies are financed by general taxation (from households and firms), the ESM faces pressures from that competition (Ferrera, Hemerijck and Rhodes, 2001:168). Secondly, the increasing global financial integration has given more political power to capital. Indeed, the multinationals’ weight in several countries has weakened unions’ power and forced concessions (Ferrera, Hemerijck and Rhodes, 2001:169). In addition, trade and capital market liberalisation have also contributed to reinforce the ideological opposition to generous welfare systems (Ferrera, Hemerijck and Rhodes, 2001:169). Thirdly, there is a new factor that is undermining Europe’s well being in the long-term. A set of challenges (energy, environment, health and epidemiology, food safety, etc.) cannot be overcome through a national or continental approach. Thus, the EU, taking into account the growing global integration, will not be able to maintain the former level of welfare if other countries and continents move towards a different path (Soete, 2009:42).
Regarding Europe’s economic growth, there are several signs that Europe is declining, since it is lagging behind its main competitors and has not been able on a whole to cope with the economic dynamism of the emerging countries (India and China, mainly). Faini analysed the data on this topic, adopting a longitudinal approach and he identifies three main
DINÂMIA’CET – IUL, Centro de Estudos sobre a Mudança Socioeconómica e o Território ISCTE-IUL – Av. das Forças Armadas, 1649-026 Lisboa, PORTUGAL
Tel. 217938638 Fax. 217940042 E-mail: [email protected] http://dinamiacet.iscte-iul.pt/
5
periods: in the first (1870-1950), Europe has lost ground compared with the United States (US); in the second (1950-mid1970), the difference between the US and Europe has decreased. From the mid-1970s (the third period) the European catching-up has stopped. The reasons behind this last trend were the huge differences in the labour market (the employment rate in the US was much higher) and the trend to work fewer hours in Europe. In the third period (from 1995 onwards), the US has been deepening their leadership, however there is a different reason for this situation. The source of the change was the wider use of information technology in the US. As a result, throughout this period, US’s productivity has grown more rapidly than Europe’s productivity (Faini, 2006:84-86)
Concerning the ageing population in Europe, several studies point to a change in the age-profile. Since the 70s there were several changes in Europe’s demography, “in 1970, Germany, France and Italy (…) represented, respectively, 2.12%, 1.37%, and 1.46% of the world population. Thirty years later, its part in the world population has decreased to 1.36%, 0,99%, and 0,95% respectively. This is a massive decline” (Faini, 2006:71). Although the US have also decreased their proportion in the world population, the difference was not as significant as for Europe (Faini, 2006:71). On the other hand, people are living longer, mortality rates are decreasing, and fecundity rates have been falling. Indeed, in Europe, the average number of children per woman (the current fertility rate) is low (1.5 children for EU-25) significantly below the replacement rate of 2.1 (European Commission, 2006:3). At the economic level, the implications are obvious: active population will decrease in Europe in the short term. The dependency ratio (the number of people aged 65 years and above relative to those aged from 15-64) is set to double and reach 51% by 2050 (European Commission, 2006:4).
To sum up, as we have seen, in the early 2000s, the EU was facing several challenges, namely the globalisation process, the European incapacity to keep up with the economic growth of their main competitors, and the ageing trend. However, as we will see in the next section, each country reacted in a different way, and the Europeanization of employment and social policies was constrained by this fact.
DINÂMIA’CET – IUL, Centro de Estudos sobre a Mudança Socioeconómica e o Território ISCTE-IUL – Av. das Forças Armadas, 1649-026 Lisboa, PORTUGAL
Tel. 217938638 Fax. 217940042 E-mail: [email protected] http://dinamiacet.iscte-iul.pt/
6
2.2. Institutional constraints: the European diversity, the deepening of the internal market and the core of the European identity
Even though during the 2000’s European countries have faced several common challenges, they did not react in the same way. Indeed, the way the ESM has been reshaped throughout the past decade (we will go further on this issue in the next section) reflects the European diversity. In this section we attempt to explain what we do mean by diversity. Furthermore, we discuss why the Europeanization of employment and social policies has been speeded up. Finally, we debate how this attempt to Europeanize social and employment policies has been matched with the European diversity and the deepening of the internal market. In short, we discuss the process that has led to the emerging importance of activation policies.
The convergence hypothesis is based on the idea that international competition has forced all countries to converge into a unique model – the Anglo-Saxon liberal model (Hall and Soskice, 2001:56). However, as the European reality clearly shows, huge institutional differences continue to exist. In the field of comparative political economy, several theories have attempted to explain these differences (Streeck, 2010; Crouch, 2005). Furthermore, these theories also try to explain why different countries do pursue different trajectories, although they share the same external challenges and constraints. Among them, and regardless of its weaknesses2, the Varieties of Capitalism (VoC) approach (Hall and Soskice, 2001) had an enormous impact on the literature of comparative political economy (Streeck, 2010:24).
The VoC approach argues that differences among countries rely on different institutional comparative advantages (Hall and Soskice, 2001:38), and each country attempts to create favourable complementarities (Hall and Soskice, 2001:17) to support different coordination mechanisms (strategic versus market). Regarding complementarities they “suggest that nations with a particular type of coordination in one sphere of the economy should tend to develop complementary practices in other spheres as well” (Hall and Soskice, 2001:18). The most successful economies are those that manage successfully this process. Hall and Soskice point out two ideal-types: Coordinated Market Economies (CMEs) and Liberal Market Economies (LMEs). Following the VoC approach, the trajectory of each model is determined by an attempt to maintain its institutional comparative advantages, i.e. change is triggered by the historical trajectory, when a country faces challenges, the way it reacts is shaped by an attempt to maintain a set of comparative institutional advantages (Hall,
2 This article does not attempt to survey the existing theories on the field of comparative political
economy. The use of the VoC approach attempts to explain how different countries may pursue different trajectories although they share the same challenges and constraints.
DINÂMIA’CET – IUL, Centro de Estudos sobre a Mudança Socioeconómica e o Território ISCTE-IUL – Av. das Forças Armadas, 1649-026 Lisboa, PORTUGAL
Tel. 217938638 Fax. 217940042 E-mail: [email protected] http://dinamiacet.iscte-iul.pt/
7
2007). Regarding the challenges we have presented above, we argue that the way each country has reacted to them has been determined by the existing institutional differences.
Nevertheless, besides institutional differences, the deepening of the internal market required more European intervention in the field of employment and social policies. Throughout the 1990s it has become clear that there was an asymmetry between economic and monetary policies, that have been progressively ‘Europeanized’, and social and employment policies, which have remained at the national level (Scharpf, 2002; Goetschy, 2003, Goetschy, 2006:55). On the other hand, there was a growing concern about how to sustain the core of European identity: the existence of higher social cohesion and a high degree of workers involvement. Therefore, the Europeanization of social and employment policies has emerged as a topical issue. Although some authors point to the fact that this process constituted a neoliberal attempt to deregulate the labour markets and social policies (Amable, 2011; Apeldoorn, Drahokoupil, and Horn, 2009), the new direction of the ESM was seeking to sustain social cohesion in a new context, one in which the European integration process and globalization would play a major role. Thereafter, the Europeanization of social and employment policies has been strongly constrained by the European diversity, the deepening of the internal market, and the attempt to sustain the core of European identity, i.e. the European institutions have tried to match these three dimensions.
In short, besides tackling a set of challenges, the ESM reform reflects an attempt to Europeanize employment and social policies in a way that is compatible with the deepening of the internal market and the European diversity. We argue in the next section that such compromise was achieved through the concept of activation.
3. The reform of the European Social Model
The use of the ESM term is not a recent ‘discovery’ as it has been used for a long time by the European institutions. Indeed, “Jacques Delors was one of the first people to popularise the term European Social Model in the mid-1980s by designating it as an alternative to the American pure-market form of capitalism” (Jepsen and Pascual, 2006:25). On the other hand, one of the first definitions of the ESM appears in the White Paper on Social Policy (European Commission, 1994). These definitions were quite broad, since they involved aspects that went beyond the European social dimension, including issues such as democracy and individual freedom. In the context of the European Council of Lisbon (2000), the concept started to be dealt with from a different perspective. The emphasis was put on the modernisation of the ESM. In fact, the Lisbon Council underlined the need for training and education, for the
DINÂMIA’CET – IUL, Centro de Estudos sobre a Mudança Socioeconómica e o Território ISCTE-IUL – Av. das Forças Armadas, 1649-026 Lisboa, PORTUGAL
Tel. 217938638 Fax. 217940042 E-mail: [email protected] http://dinamiacet.iscte-iul.pt/
8
adaptation of skills and lifelong learning, for the reform of the social security system and for the promotion of social inclusion (Jepsen and Pascual, 2006:26).
The new strategic orientation of the Welfare State, materialised in the European Employment Strategy and the Lisbon Strategy (re-launched in 2010 under the designation of Europe 2020), puts the emphasis on the increase of employment levels and the transition to a knowledge-intensive economy. Indeed, in 2000, the Lisbon Strategy was drawn on three assumptions: (i) it will not be easy to support the ESM without a more competitive Europe; (ii) the ESM needs to be renewed, according to the necessity of an increased stimulus to the new competitive factors; (iii) the main element is the transition to a knowledge (society) economy (Rodrigues, 2002; Rodrigues, 2004, Salavisa, 2006). In sum, the attempt to reform the ESM was made through policies aiming to increase employment, with an emphasis on the Europeanization of social and employment policies.
Several authors point to the fact that the relation between social policy and the labour markets has been reinforced. The scope of social policy changed radically because the struggle against poverty and social exclusion is not exclusively made through the income redistribution policies, which tended to correct the “market imperfections”. Policies emerged aiming to enable individuals, giving them the tools that will allow them to return to the labour market. The ESM reform is to be drawn upon the social transformation of needs and risks, i.e., “the main welfare necessities of the household (…) are connected less with income transfers and more with the access to services” (Esping-Andersen, 2000:89). Giddens prefers to call them the positive welfare, i.e., a positive change of life style, because, in his view, the Welfare State not only has to do with risk prevention (Esping-Andersen, 2007), but also with the creation of capabilities. Rodrigues called this paradigm shift as a reinterpretation of the values that sustain the ESM, i.e., “security should be for change, and not against change; when the focus is not only on income guarantees but also on enabling and building capabilities” (2009:56). Streeck (2001:26) calls this new paradigm the ‘competitive solidarity’, given that the emphasis is on increasing the individual’s capacity to compete. However, we may sum up these three perspectives in one single word – activation.
The concept of activation and the different national models
The debate about the activation concept is indeed important, due to the impact it has on social policy. Concerning this issue, we stress the work by Pascual (2007:11-34). According to her, the concept has three main characteristics: an individualised approach; an emphasis on employment; and contractualisation as a core principle. First, the aim is to change individual behaviour, i.e. the individual is the main responsible for his own insertion in the labour
DINÂMIA’CET – IUL, Centro de Estudos sobre a Mudança Socioeconómica e o Território ISCTE-IUL – Av. das Forças Armadas, 1649-026 Lisboa, PORTUGAL
Tel. 217938638 Fax. 217940042 E-mail: [email protected] http://dinamiacet.iscte-iul.pt/
9
market. Second, rather than correct market failures (through redistribution policies), the new paradigm is now trying to raise employment levels. Finally, contratualisation emerges as the metaphor of this transition. In order to have access to benefits, individuals have to sign a contract, in which they commit to actively find a new job.
Furthermore, as we have pointed out above (see Section 2.2.), regarding social and employment policies, huge differences still remain across Europe. Concerning activation, it does not exist a unique model. Indeed, this is one of the reasons why activation is playing a central role at the European level. Activation can be ‘adapted’ by each country. With reference to different models of activation, Pascual proposes two different approaches: the moral-therapeutic and the one that aims to match the workers and the labour market needs (2007:294-299). The first type of intervention is based on the perspective that individuals are passive by nature and, therefore, the state as to force them to return to the labour market. In this approach there are two variants: the moral one, which postulates that the individuals have a innate tendency to do nothing (e.g. United Kingdom); and the therapeutic one, which is based on the assumption that individuals possess certain flaws and that the role of the State consists of helping individuals to ‘free themselves from themselves’ (e.g. Netherlands). The second type of approach is based on different assumptions, since individuals are regarded as autonomous. According to this perspective, the role of the State consists of providing the tools so that the individuals can adapt to new requirements from the labour markets. In this way, there are also two ramifications: the pro-active one, which relies on the supply of education and individual skills that are necessary to manage a career (e.g. Sweden); and the defensive one, which aims to adapt the costs with the new work requirements, reducing the contributions from the employers or subsidising employment among certain groups (e.g. France).
Turning to the discussion we had before, each activation model is associated with different production regimes. Although at first sight it seems difficult to combine the VoC theory with a common strategy at the European level, given that this theory emphasizes the national level (Hodson and Simoni, 2009:118), this was possible because the concept of activation can be used flexibly and the governance method (the OMC) allows differences among countries. Although some VoC scholars argue that a common innovation policy is undesirable (Hodson and Simoni, 2009:122-125), because a key difference between LMEs and CMEs is precisely the pattern of innovation, they recognize that the Lisbon’s approach to employment and social policies is compatible with European diversity (Hodson and Simoni, 2009:122). Indeed, in each country employers look for public policies that reinforce the institutional comparative advantages of that country (Wood, 2001:249-253). In CMEs, activation can be used as a way to foster specific skills (e.g. through training policies) or as a
DINÂMIA’CET – IUL, Centro de Estudos sobre a Mudança Socioeconómica e o Território ISCTE-IUL – Av. das Forças Armadas, 1649-026 Lisboa, PORTUGAL
Tel. 217938638 Fax. 217940042 E-mail: [email protected] http://dinamiacet.iscte-iul.pt/
10
way to create more flexibility in the marginal jobs, i.e. those that do not belong to the core industries in which the comparative advantage of each country rely upon (Hodson and Simoni, 2009:122). In LMEs, activation is defined as a way to create even more flexibility in the labour markets.
Indeed, three main reasons explain why the activation paradigm was used to reform the ESM, reconciling the challenges that the model was facing with the constraints imposed by the characteristics of the European integration: diversity, deepening of the internal market and European identity. Firstly, what has happened was not a full Europeanization of social and employment policies, as Streeck pinpoints: European countries “are being ‘Europeanized’, not through hierarchical centralization, but through growing awareness of national actors and institutions of their European context, as conditioned by their national interests and circumstances” (Streeck, 2001:24). The governance method, the Open Method of Coordination, reflects this option, given that cooperation depends of voluntary commitment, and there are no formal sanctions (Sharpf, 2002:652). Finally, the reform of the ESM followed this path, because the focus – the provision of activation – can have different meanings. As we have pointed out above, there are different models of activation (Pascual, 2007:275-316).
Secondly, this paradigm is not incompatible with the deepening of the internal market, given that, although it does not stress a pure market-driven approach, it accepts the market as the final arbiter, using Smith (1998:11) expression, it is a ‘market-adapting’ approach.
Thirdly, although the concept can be used differently, there is a ‘European approach’ to the concept, one that emphasizes the ‘investment side’, i.e. as a way to help individuals to move from one job to another. The emphasis at the European level on a type of activation that sees public polices as an investment, rather than adopting a moral/coercive approach (followed in the Anglo-Saxon countries) contributes to sustain the former levels of social cohesion. This fact helps to explain why the activation concept is compatible with the core of the European identity. Indeed, on measuring activation (through the indicator “public expenditure on active labour market policies”), the Eurostat includes measures such as: training, job rotation and job sharing, employment incentives, supported employment and rehabilitation, direct job creation and start-up initiatives.
To sum up, the activation paradigm has emerged to tackle a set of challenges that Europe was facing in the early 2000s. Furthermore, this new paradigm has been able to match European diversity with the need to increase European integration in the field of social and employment policies and the deepening of the internal market. Finally, the type of activation
DINÂMIA’CET – IUL, Centro de Estudos sobre a Mudança Socioeconómica e o Território ISCTE-IUL – Av. das Forças Armadas, 1649-026 Lisboa, PORTUGAL
Tel. 217938638 Fax. 217940042 E-mail: [email protected] http://dinamiacet.iscte-iul.pt/
11
that has been followed by the European institutions explains why the concept is compatible with the European identity.
4. Assessing the social cohesion diversity
Now, we look at how social cohesion has evolved in the EU in the period 2000-2010. This section is divided into three parts. In order to assess social cohesion, we will begin by examining the evolution of two central variables: at-risk-of-poverty rate after social transfers and inequality of income distribution3. Afterwards, to examine the diversity of the European model, the analysis will then go on to compare social cohesion in the EU with the US and Japan. We will conclude this part by making a brief reference to indicators that may shed light on other relevant aspects, namely the relationship between social cohesion and the labour market and other dimensions of poverty that are not measured by the at-risk-of-poverty rate after social transfers and the inequality of income distribution.
To begin with, the evolution of at-risk-of-poverty rate after social transfers can be seen in Table 1. Giving that one of the main objectives of the Lisbon Strategy was to reduce the poverty rate in the EU over the period 2000-2010, the most striking feature is that the risk-of-poverty has increased slightly in the EU154 over the period. Among the 15 countries surveyed, only in Ireland, France, Portugal, the Netherlands and the UK did the level of poverty decrease. In Belgium, Denmark, Germany, Spain, Luxembourg, Finland and Sweden the level of poverty has increased significantly. Austria, Greece and Italy maintained almost the same level of poverty.
However, if we compare the at-risk-of-poverty rate after and before social transfers (Table 2) we realise that the latter has increased more than the former, i.e. without social transfers the level of poverty would have increased even more. Notice also that the effectiveness of social transfers to reduce poverty has increased from 2000 to 2010. While in 2000 the at-risk-of-poverty rate after social transfers was 8 p.p. below the at-risk-of-poverty rate before social transfers, in 2010 such difference increased to 9.9 p.p.
Furthermore, Table 1 also shows the figures of each country in 2010. Those with higher poverty rates (between 17% and 20%) are Greece, Spain, Italy, Portugal and the UK. Belgium, Germany, Luxembourg and Ireland are in an intermediate position (between 14% and 17%). Countries with lower poverty levels (between 10% and 14%) are France, Netherlands, Austria, Finland, Denmark and Sweden. These data reveal important differences
3 These two variables were chosen also because they are available since 2000.
4 We analyse the EU15 because in 2000, when the Lisbon Strategy was launched, only fifteen countries
DINÂMIA’CET – IUL, Centro de Estudos sobre a Mudança Socioeconómica e o Território ISCTE-IUL – Av. das Forças Armadas, 1649-026 Lisboa, PORTUGAL
Tel. 217938638 Fax. 217940042 E-mail: [email protected] http://dinamiacet.iscte-iul.pt/
12
across Europe. Indeed, they corroborate the discussion that we made above on the existence of different models of capitalism and the fact that different patterns of social cohesion are associated with each model (Rueda and Pontusson, 2000; Baccaro, 2008; Estevez, Iversen and Soskice, 2001).
With reference to that discussion, Germany’s trajectory needs to be analysed with further attention. Although Germany has seen a deterioration of its social cohesion across all workers, another situation aggravating the problem is the dualisation of its labour market (Thelen and Wijnbergen, 2003; Hall, 2007; Thelen and Hall, 2009). While in the EU15 the at-risk-of-poverty rate has increased between 2005 and 2010 slightly the same for permanent and temporary workers (22%), in Germany the poverty rate has increased more for temporary workers than for permanent workers: 90% and 75%, respectively (Table 6). This indicates that those workers who have stable jobs (insiders) face less poverty constrains than those who deal with situations of temporary contracts (outsiders).
Table 1 – At-risk-of-poverty rate after social transfers 2000 2005 2008 2010 2000-2010 EU15 15 15.8 16.2 16.3 +1.3 Belgium 13 14.8 14.7 14.6 +1.6 Denmark 10* 11.8 11.8 13.3 +3.3 Germany 10 12.2 15.2 15.6 +5.6 Ireland 20 19.7 15 16.1 -3.9 Greece 20 19.6 19.7 20.1 +0.1 Spain 18 19.7 19.5 20.7 +2.7 France 16 13 12.9 13.5 -2.5 Italy 18 18.9 18.4 18.2 +0.2 Luxembourg 12 13.7 13.4 14.5 +2,5 Netherlands 11 10.7 10.5 10.3 -0,7 Austria 12 12.3 12.4 12.1 +0.1 Portugal 21 19.4 18.5 17.9 -3.1 Finland 11 11.7 13.6 13.1 +2.1 Sweden 9* 9.5 12.2 12.9 +3.9 UK 19 19 18.7 17.1 -1.9 Source: Eurostat *Data for 2001
DINÂMIA’CET – IUL, Centro de Estudos sobre a Mudança Socioeconómica e o Território ISCTE-IUL – Av. das Forças Armadas, 1649-026 Lisboa, PORTUGAL
Tel. 217938638 Fax. 217940042 E-mail: [email protected] http://dinamiacet.iscte-iul.pt/
13 Table 2 – Comparing at-risk-of-poverty rate after and before social transfers
Before Social Transfers After Social Transfers 2000 2010 2000 2010 EU15 23 26.1 15 16.2 Belgium 23 26.7 13 14.6 Denmark 29* 29.1 10* 13.3 Germany 20 24.2 10 15.6 Ireland 31 40.4 20 16.1 Greece 22 23.8 20 20.1 Spain 22 28.1 18 20.7 France 24 25.2 16 13.3 Italy 21 23.3 18 18.2 Luxembourg 23 29.1 12 14.5 Netherlands 22 21.1 11 10.3 Austria 22 24.1 12 12.1 Portugal 27 26.4 21 17.9 Finland 19 27.0 11 13.1 Sweden 17* 26.7 9* 12.9 UK 29 31.0 19 17.1 Source: Eurostat *Data for 2001
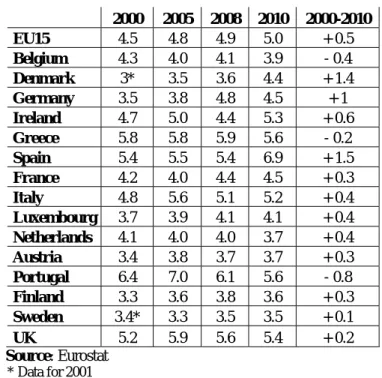
Turning now to the inequality of income distribution, we observe a slight increase on the indicator throughout the past decade, following the same pattern of the poverty rate (Table 4).
5
However, the number of countries with a decrease in inequality is smaller than the number of countries with a decrease in the poverty rate. Indeed, only Portugal, Belgium and Greece have seen a decrease on inequality. Comparing the relative positions of each country in 2010, those with higher inequality (between 5 and 6) are Ireland, Greece, Spain, Italy, Portugal and the United Kingdom. Denmark, Germany, France, Luxembourg and Austria are in an intermediate position (between 4 and 5). Countries with the lowest inequality levels (less than 4) are Belgium, Netherlands, Austria, Finland and Sweden. These results support the previous analysis, i.e. Continental and Nordic Europe are more prone to higher social cohesion whether Liberal and Southern countries tend to be more unequal.
Moreover, the standard deviation of the at-risk-of-poverty rate after social transfers in 2001, 2005, 2008 and 2010 points to a convergence of that indicator (Table 3). Also, Table 1 suggests the closing of the gap between countries, i.e. the fact that the lowest poverty rates tended to rise slightly and the highest poverty rates tended to decline slightly. Comparing the at-risk-of-poverty rate after social transfers with the inequality of income distribution it can
5 Inequality is measured as the ratio of total income received by the top quintile to that received by the
DINÂMIA’CET – IUL, Centro de Estudos sobre a Mudança Socioeconómica e o Território ISCTE-IUL – Av. das Forças Armadas, 1649-026 Lisboa, PORTUGAL
Tel. 217938638 Fax. 217940042 E-mail: [email protected] http://dinamiacet.iscte-iul.pt/
14
be seen that in the former the convergence trend is stronger (Table 3). It is difficult to confirm that the convergence process was a direct result of the ‘Europeanization’ of employment and social policies; however these figures show that European countries have converged in terms of the outcome of social policies.
Table 3 – Inequality of income distribution
2000 2005 2008 2010 2000-2010 EU15 4.5 4.8 4.9 5.0 + 0.5 Belgium 4.3 4.0 4.1 3.9 - 0.4 Denmark 3* 3.5 3.6 4.4 + 1.4 Germany 3.5 3.8 4.8 4.5 + 1 Ireland 4.7 5.0 4.4 5.3 + 0.6 Greece 5.8 5.8 5.9 5.6 - 0.2 Spain 5.4 5.5 5.4 6.9 + 1.5 France 4.2 4.0 4.4 4.5 + 0.3 Italy 4.8 5.6 5.1 5.2 + 0.4 Luxembourg 3.7 3.9 4.1 4.1 + 0.4 Netherlands 4.1 4.0 4.0 3.7 + 0.4 Austria 3.4 3.8 3.7 3.7 + 0.3 Portugal 6.4 7.0 6.1 5.6 - 0.8 Finland 3.3 3.6 3.8 3.6 + 0.3 Sweden 3.4* 3.3 3.5 3.5 + 0.1 UK 5.2 5.9 5.6 5.4 + 0.2 Source: Eurostat * Data for 2001
Table 4 – At-risk-of-poverty rate after social transfers and inequality of income distribution – Standard deviation
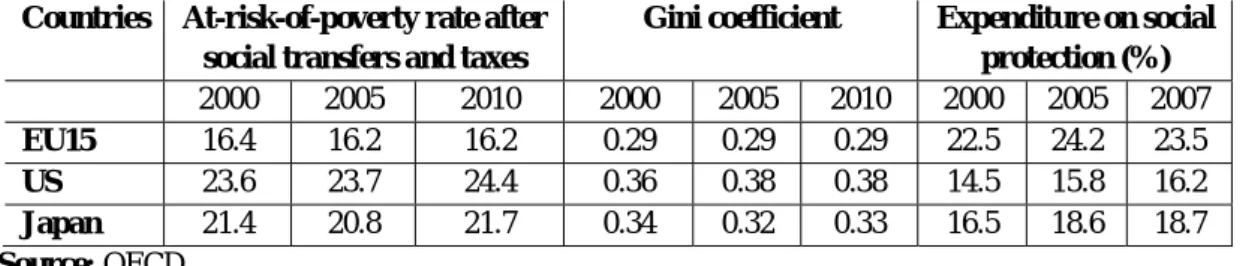
Table 5 compares social cohesion in the EU, the US and Japan throughout the past decade. Our purpose is to compare the EU with its most developed competitors. With this purpose, we use three indicators: at-risk-of-poverty rate after social transfers and taxes, inequality of
Year
Standard deviation (EU15) At-risk-of-poverty rate
after social transfers
Inequality of income distribution 2001 4.31 1.01 2005 3.84 1.12 2008 3.18 1.01 2010 3.00 0.97
DINÂMIA’CET – IUL, Centro de Estudos sobre a Mudança Socioeconómica e o Território ISCTE-IUL – Av. das Forças Armadas, 1649-026 Lisboa, PORTUGAL
Tel. 217938638 Fax. 217940042 E-mail: [email protected] http://dinamiacet.iscte-iul.pt/
15
income distribution (Gini coefficient) and the expenditure on social protection (as a percentage of GDP).6
Regarding the at-risk-of-poverty rate after social transfers and taxes, there is a clear-cut difference between the EU15 and the US (8.2 p.p. less in EU15) and a significant difference between the EU15 and Japan (less 5.5 p.p. in EU15). With reference to the Gini coefficient, figures suggest that EU15 is less unequal than the US and Japan. The difference is especially significant between the EU15 and the US. As to the expenditure on social protection, differences between EU15 and its competitors are also pretty evident, with EU15 spending more than the US and Japan. As we have pointed out before (see Section 2.1.), the EU is facing several challenges, notwithstanding throughout the past decade it has been able to maintain higher levels of social cohesion, proving the existence of a model with higher social cohesion. Furthermore, comparing with its main competitors, the European position has improved in 2000-2010, given that, especially in the US, poverty rates and inequality have risen.
Table 5 – Comparing Social Cohesion in the EU with US and Japan
Countries At-risk-of-poverty rate after social transfers and taxes
Gini coefficient Expenditure on social protection (%) 2000 2005 2010 2000 2005 2010 2000 2005 2007 EU15 16.4 16.2 16.2 0.29 0.29 0.29 22.5 24.2 23.5 US 23.6 23.7 24.4 0.36 0.38 0.38 14.5 15.8 16.2 Japan 21.4 20.8 21.7 0.34 0.32 0.33 16.5 18.6 18.7 Source: OECD
Finally, we present further information about social cohesion in the EU (Table 6). As we have explained above (see footnote 1), the at-risk-of-poverty rate has been criticised and new indicators have been created more recently. Although they are not available for the whole period under analysis (2000-2010), we will use them to shed some light on other relevant aspects, namely: (i) the relationship between social cohesion and the labour market and (ii) other dimensions of poverty that are not covered by the indicators used above. In this regard we analyse the at-risk-of-poverty and social exclusion indicator, created in the scope of Europe 2020, which unifies three indicators: people living in households with very low work intensity, people at-risk-of-poverty after social transfers and severely materially deprived people.
6 We will use data collected by the OECD, given that the Eurostat does not provide information about
the US and Japan. Comparing with the Eurostat, the OECD uses a different approach to calculate the at-risk-of-poverty and the inequality of income distribution.
DINÂMIA’CET – IUL, Centro de Estudos sobre a Mudança Socioeconómica e o Território ISCTE-IUL – Av. das Forças Armadas, 1649-026 Lisboa, PORTUGAL
Tel. 217938638 Fax. 217940042 E-mail: [email protected] http://dinamiacet.iscte-iul.pt/
16
With reference to the first objective, this table contains information for four indicators: at-risk-of-poverty rate or social exclusion among employed people, at-at-risk-of-poverty rate or social exclusion among unemployed, at-risk-of-poverty rate among temporary workers and at-risk-of-poverty rate among permanent workers. For the EU15 average, the figures indicate that in 2010 those who are employed have a much lower at-risk-of-poverty or social exclusion rate than the unemployed: 9.9% and 63.6%, respectively. Roughly the same patterns exist for individual countries. Even though smaller, the difference between the at-risk-of-poverty rate among workers with permanent and temporary workers in 2010 for the EU15 was also significant: 5.2% and 13%, respectively. In some countries, the proportion of people at-risk-of-poverty among temporary workers has soared between 2005 and 2010, like the German and Swedish cases exemplify. The evidence shown indicates that having a work, and especially a work with permanent contract, is an important factor for reducing poverty. In a sense, this validates the reforms done in the ESM, in the direction of increasing the importance of job creation as a mechanism to reduce poverty.
Concerning other dimensions of poverty, this table contains information for two indicators: at-risk-of-poverty or social exclusion and severe material deprivation. Comparing with the information gathered above (at-risk-of-poverty rate after social transfers and inequality of income distribution), two conclusions can be drawn. First, at the European level, these data are consistent with the discussion we have made before, taking into account that they point to a stabilization or slight decrease of social cohesion. But for several countries the selected indicators have a different trend. For opposite reasons, the French and Swedish cases clearly show this fact.
In short, this section has given an account of the progress of social cohesion in Europe during the past decade. One of the more significant findings is that social cohesion has stabilized during this period and that the objective of reducing poverty was not achieved. However, we have also found that different trajectories have taken place and a convergence process (especially with reference to the poverty rates) was under way. Furthermore, data on poverty rates after and before social transfers revealed that social policies play a central role in sustaining high levels of social cohesion. Secondly, comparing with its main competitors (Japan and the US), the EU is distinctive with respect to the level of social cohesion. In addition, the evidence provided above suggests that those who are employed have a lower poverty risk. However, temporary jobs weaken this relationship.
DINÂMIA’CET – IUL, Centro de Estudos sobre a Mudança Socioeconómica e o Território ISCTE-IUL – Av. das Forças Armadas, 1649-026 Lisboa, PORTUGAL
Tel. 217938638 Fax. 217940042 E-mail: [email protected] http://dinamiacet.iscte-iul.pt/
17
Table 6 – Social Cohesion, summary table
At-risk-of-poverty rate or social exclusion among employed At-risk-of-poverty rate or social exclusion among unemployed At-risk-of-poverty rate among temporary workers At-risk-of-poverty rate among permanent workers At-risk-of-poverty or social exclusion Severe Material deprivation 2005 2010 2005 2010 2005 2010 2005 2010 2005 2010 2005 2010 EU15 9.6 9.9 57.4 63.6 10.6 13.0 4.2 5.2 21.5 21.7 5.2 5.2 Belgium 6.3 6.5 64.1 53.4 5.9 12.2 2.4 2.4 22.6 20.8 6.5 5.9 Denmark 6.0 7.1 53.1 66.3 : : 4.0 5.8 17.2 18.3 3.2 2.7 Germany 7.1 8.7 62.2 85.0 8.4 16.0 3.3 5.8 18.4 19.7 4.6 4.5 Ireland 7.5 10.1 64.2 63.4 10.9 7.1 3.6 1.9 25.0 29.9 5.1 7.5 Greece 19.5 18.0 52.2 59.6 17.4 13.4 4.7 5.1 29.4 27.7 12.8 11.6 Spain 12.2 14.4 44.9 55.2 10.6 13.0 4.6 5.5 23.4 25.5 3.4 4.0 France 8.7 8.8 52.2 56.5 9.9 10.4 3.6 4.1 18.9 19.2 5.3 5.8 Italy 11.4 12.3 59.2 61.8 16.2 18.2 5.6 6.5 25.0 24.5 6.4 6.9 Luxembourg 10.4 10.8 61.6 57.8 23.9 19.6 8.3 8.9 17.3 17.1 1.8 0.5 Netherlands 6.8 6.0 71.0 70.1 4.4 6.9 2.5 2.9 16.7 15.1 2.5 2.2 Austria 8.7 6.8 64.8 55.0 6.1 6.9 6.0 4.0 16.8 16.6 3.0 4.3 Portugal 16.3 14.1 46.9 54.3 12.0 7.5 6.7 5.1 26.1 25.3 9.3 9.0 Finland 5.0 4.6 59.2 61.4 7.4 6.8 2.0 1.9 17.2 16.9 3.8 2.8 Sweden 6.3 7.1 52.6 48.9 10.4 21.0 4.2 5.3 14.4 15.0 2.3 1.3 UK 10.4 8.6 71.2 64.4 7.4 6.5 4.7 5.4 24.8 23.1 5.3 4.8 Source: Eurostat.
DINÂMIA’CET – IUL, Centro de Estudos sobre a Mudança Socioeconómica e o Território ISCTE-IUL – Av. das Forças Armadas, 1649-026 Lisboa, PORTUGAL
Tel. 217938638 Fax. 217940042 E-mail: [email protected] http://dinamiacet.iscte-iul.pt/
18
5. Assessment of the ESM’s reform: an econometric analysis
We now turn to the question of testing econometrically whether the reform of the European Social Model (ESM) was effective in improving social cohesion in Europe. This reform stressed two points: the importance of policies to promote employment as a way to sustain and increase social cohesion, on the one hand; and the transition to a knowledge economy as a way to increase growth and sustain the ESM, on the other hand.
We begin by presenting the variables used in the model and the hypotheses formulated. Then, we estimate two models, one for the at-risk-of-poverty rate after social transfers and the other for the inequality of income distribution.
To test our main hypotheses we analyse firstly how active labour market policies (ALMP) in proportion of GDP, long-term unemployment (more than 12 months) and GDP per capita (in euros, constant prices and PPP) affect, at a country level, the at-risk-of-poverty rate after social transfers and the level of inequality of income distribution7. Secondly, we look at the variables connected with the knowledge economy, i.e. the level of R&D expenditures to GDP and the level of upper secondary and tertiary education (proportion of people aged 20-24 which attained at least the upper secondary education level), to assess their impact on poverty rate and inequality. If we obtain good results with regard to these two points, then we can conclude that the priorities of the Lisbon Strategy were correct from the social point of view.
The model also includes other social policy measures (in proportion of the GDP), such as passive labour market policies (which are mostly unemployment benefits and early retirement benefits), income support policies and other expenditures on social protection (excluding active and passive labour market policies, and income support policies). We decided to separate income support policies from other social policies because they are especially targeted to fight poverty and thus may have a larger impact in the reduction of poverty than other social expenditures.
Furthermore, the Lisbon Agenda main goal was to reconcile economic growth (with macroeconomic stability) and social cohesion. One of the main goals of European macroeconomic policies is inflation stability. High inflation may increase inequality by reducing the real income of social classes that are not able to increase their nominal income in face of rising prices, such as retired people. To test this hypothesis, we considered the inflation rate as an explanatory variable of social performance in Europe.
7 All the data are from Eurostat.
DINÂMIA’CET – IUL, Centro de Estudos sobre a Mudança Socioeconómica e o Território ISCTE-IUL – Av. das Forças Armadas, 1649-026 Lisboa, PORTUGAL
Tel. 217938638 Fax. 217940042 E-mail: [email protected] http://dinamiacet.iscte-iul.pt/
19
In 2008, the subprime crisis started in the US, with major destabilising financial and economic effects in Europe. Our hypothesis is that, despite the response of social policies, this crisis has increased poverty and inequality in Europe, even after controlling for the evolution of unemployment and GDP. To test this hypothesis we have introduced a dummy variable equal to one in the year 2009. Here it is taken into account that the major impact of the crisis was felt in Europe only in 2009.
Finally, given the European diversity identified above (see section 2.2.), we have introduced two dummies for the Liberal countries (UK and Ireland) and for the Southern European countries (Spain, Italy, Greece and Portugal). It is expected that these two groups of countries have social and economic models that produce worse social outcomes.
5.1. At-risk-of-poverty rate: the importance of redistributive policies
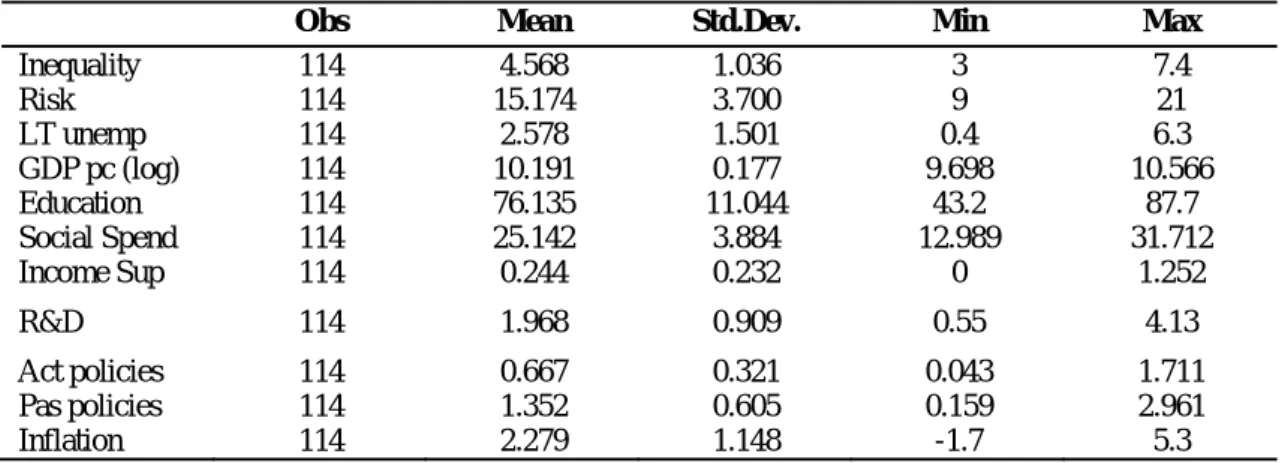
Using polled data between 2000 and 2009, we obtain for the at-risk-of-poverty rate after social transfers the results in Table 7 (model Risk). While long-term unemployment has a positive and statistically significant impact on the risk of poverty, active labour market policies (ALMP) reduce poverty but are not statistically significant. A 1 p.p. increase in unemployment increases the risk of poverty by 0.27 p.p. 8 Notice that GDP per capita does not have a statistically significant effect on poverty, probably because poverty is measured relatively to the median income. In turn, passive labour market policies, income support policies and other social expenditures have a negative and statistically relevant effect on poverty. It is worth mentioning that the quantitative effect of a 1 p.p. increase in income support policies has a larger effect in reducing poverty than a 1 p.p. increase in other social expenditures, and the same is valid but to a lesser extent for passive labour market policies. Like ALMP, education does not seem to have a statistically significant effect on poverty, even though it has a negative contribution for this variable. Yet, countries with economic models more based on innovation, as measured by R&D expenditures, tend to be associated with less poverty. Inflation has a positive effect on poverty, but its statistical relevance is weak. Confirming the formulated hypothesis, the subprime financial crisis increased poverty in Europe by 1.83 p.p. on average. Finally, the economic and social models of the Liberal and Southern countries produce higher levels of poverty than the other European countries. In short, it can be concluded that, although expenditure on R&D and long-term unemployment play an important role on explaining the variation of the risk of poverty, passive measures are also important in tackling poverty in Europe.
8 The same type of interpretation is valid for all the other variables, with the exception of GDP that is
DINÂMIA’CET – IUL, Centro de Estudos sobre a Mudança Socioeconómica e o Território ISCTE-IUL – Av. das Forças Armadas, 1649-026 Lisboa, PORTUGAL
Tel. 217938638 Fax. 217940042 E-mail: [email protected] http://dinamiacet.iscte-iul.pt/
20 Table 7 – Models for Risk and Inequality
Risk
1
Inequality
LT unemp 0.268** (0.107) 0.026 (0.029) Log GDP pc 0.955 (1.068) -.907*** (0.295) Social Spend -0.188*** (0.057) 0.018 (0.015) Income Sup -2.739*** (0.728) 0.308 (0.201) Education -0.020 (0.016) -0.033*** (0.004) R&D -0.731*** (0.247) -0.156*** (0.068) Act policies 0.309 (0.627) -0.813*** (0.173) Pas policies -0.916** (0.357) -0.118 (0.098) Inflation 0.192 (0.151) 0.0219 (0.041) Crisis 1.836*** (0.476) 0.151 (0.131) Liberal 3.194*** (0.730) 0.839*** (0.202) South 3.342*** (0.701) 0.731*** (0.194) No of obs 114 114 R-squared 0.9052 0.9074 F(12,101) 80.35 (p-value=0.000) 82.52 (p-value=0.000)Source: Authors’ calculations based on Eurostat, EU-SILC; Labour Force Survey; European System of Integrated Social Protection Statistics (ESSPROS); European Employment Strategy Database.
Note: OLS-regression; all models have a constant; standard deviations in parentheses.
*** Significant at the 1% level; ** significant at the 5% level.
5.2. Inequality of income distribution: the role of activation and education
Let us turn now to the analysis of the determinants of inequality, using the same explanatory variables than for poverty (Table 7, model Inequality). Long-term unemployment increases inequality, but it is not statistically significant, while the impact of GDP per capita is negative and statistically relevant. A 1% (0.01) increase in GDP per capita reduces inequality by 0.009 p.p. A 1 p.p. increase in ALMP implies a statistical significant reduction of 0.8 on the inequality indicator, while for poverty the effect was not statistically important, as seen above.9 The same qualitative result occurs for the variable education. Interestingly, while
9 Notice that the inequality indicator has an average of 4.6 for all countries and years. In addition, the
interpretation of the coefficient of unemployment, education, other social expenditure, income support policies, R&D, passive labour policies and inflation is similar to the one of active policies.
DINÂMIA’CET – IUL, Centro de Estudos sobre a Mudança Socioeconómica e o Território ISCTE-IUL – Av. das Forças Armadas, 1649-026 Lisboa, PORTUGAL
Tel. 217938638 Fax. 217940042 E-mail: [email protected] http://dinamiacet.iscte-iul.pt/
21
passive labour market policies, income support policies and other social expenditures were statistically relevant for poverty, they are irrelevant for inequality. The subprime crisis increased inequality, but the effect was not significant from a statistically point of view. Higher levels of R&D are also important to reduce inequality. For inflation and the effect of the economic and social models of the Liberal and Southern countries we obtain basically the same qualitative results as for the risk of poverty. In short, to tackle inequality, ALMP, education, R&D and GDP growth emerge as crucial variables.
To sum up, our results indicate that the reform of the ESM towards a larger focus on fighting unemployment, promoting economic growth and ALMP is effective in reducing poverty and inequality. The reduction in long-term unemployment and passive social measures will be more effective for the reduction of poverty, while ALMP and economic growth will be more effective in reducing inequality. Furthermore, with reference to the variables that are significant in both models (the European diversity and the expenditure on R&D), two conclusions can be drawn. Firstly, as expected, the European diversity is crucial to understand the different levels regarding social cohesion in Europe. Secondly, R&D expenditure is in accordance with the Lisbon Strategy assumptions: the transition to a knowledge (society) economy is fundamental to sustain the ESM in face of the new challenges facing it (Rodrigues, 2002; Rodrigues, 2004, Salavisa, 2006).
DINÂMIA’CET – IUL, Centro de Estudos sobre a Mudança Socioeconómica e o Território ISCTE-IUL – Av. das Forças Armadas, 1649-026 Lisboa, PORTUGAL
Tel. 217938638 Fax. 217940042 E-mail: [email protected] http://dinamiacet.iscte-iul.pt/
22
Conclusion
This article’s aim was to assess how the Lisbon Agenda reshaped the European Social Model throughout the past decade. We have stressed that the ESM has been redesigned towards an emphasis on activation policies and employment rather than income redistribution policies. Furthermore, we have pointed out the fact that this change resulted from an attempt to match four dimensions: the deepening of the internal market, the Europeanization of employment and social policies, the European diversity regarding employment relations and social policies, and the goal of sustaining the core of European identity. In order to assess the impact of this transition we have conducted an empirical analysis combining descriptive statistics and econometrics analysis for the period 2000-2010.
Firstly, it was found that in general social cohesion has stabilized in Europe during this period. However, countries had different trajectories and there was a convergence in social outcomes across countries, especially with reference to the poverty rates. Furthermore, data on poverty rates after and before social transfers reveal that social policies played a central role in sustaining high levels of social cohesion in Europe. Finally, corroborating the importance of employment in fighting poverty, employed people have a much lower poverty risk than unemployed, even though temporary jobs weakens this relationship.
Secondly, multiple regression analysis revealed that there exist some differences between the determinants of inequality and poverty. Active policies have the capacity to improve citizens’ opportunities and therefore to decrease inequality, but they are unable to reduce poverty, which has to be tackled with redistributive policies. Then passive and active measures are complementary and not substitute, i.e. they address different aspects of social cohesion.
Indeed, one of the more significant findings to emerge from this study is that to achieve the Lisbon’s initial goal of reducing poverty in Europe, it is crucial to raise the expenditure on redistributive policies. Active measures by their own do not reduce poverty, especially because in-work poverty is increasing in several European countries. However, to reduce inequality, activation policies need to be at the top of the agenda. Furthermore, the expenditure on R&D is important, either to tackle poverty or to reduce inequality. Finally, raising the levels of education and of GDP per capita are important means of reducing inequality, while poverty is more sensitive to the long-term unemployment rate.
As a general note, it should be recognized that the main concept of poverty used in this paper, which is based on relative income, is necessarily limited. For example, it does not take into account home ownership and the offer and price of public services (Cantillon, 2011).
DINÂMIA’CET – IUL, Centro de Estudos sobre a Mudança Socioeconómica e o Território ISCTE-IUL – Av. das Forças Armadas, 1649-026 Lisboa, PORTUGAL
Tel. 217938638 Fax. 217940042 E-mail: [email protected] http://dinamiacet.iscte-iul.pt/
23
Moreover, the social context of households is also important. For instance, the production of goods for self-consumption is larger in rural areas than in urban areas, making financial income underestimate the real households’ income in the former areas. In other perspective, besides looking at poverty, it would be interesting to have a broader view by assessing social exclusion. The way individuals are connected to usual social activities and how members of the household support each other are also important elements of a well-functioning society.
In conclusion, the Lisbon Agenda’s focus on increasing employment levels and to boost the transition to a knowledge-based economy proved to give a positive contribution to sustain the ESM in the long run. However, given the in-work poverty problem, this approach was not able to reduce poverty in Europe. To this end, labour market passive measures, income support measures and other expenditure on social protection are crucial to reduce poverty in Europe. Indeed, an approach that combines passive and active measures with other social policies, and at the same time promotes employment and economic growth based on R&D and higher education levels seems the most appropriate to tackle poverty and inequality and to sustain the ESM in the long-run. In times of economic crisis, like the one that emerged after the subprime and the sovereign debt crises, there is a demand for policies aiming to reduce both unemployment and budget deficits, but an approach that neglects the role of passive measures will have a negative impact on poverty in Europe.
DINÂMIA’CET – IUL, Centro de Estudos sobre a Mudança Socioeconómica e o Território ISCTE-IUL – Av. das Forças Armadas, 1649-026 Lisboa, PORTUGAL
Tel. 217938638 Fax. 217940042 E-mail: [email protected] http://dinamiacet.iscte-iul.pt/
24
References
Amable, B. (2011), “Morals and politics in the ideology of neo-liberalism”, Socio-Economic Review, 9, pp.3-30.
Apeldoorn, B., Drahokoupil, J., Horn, L. (eds.) (2009), Contradictions and Limits of Neoliberal European Governance, Palgrave Macmillan.
Baccaro, L. (2008), “Labour, Globalization and Inequality: Are Trade Unions Still Redistributive?”, International Institute for Labour Studies, ILO, Discussion Paper.
Cantillon, B. (2011), “The paradox of the social investment state: growth, employment and poverty in the Lisbon era”, Journal of European Social Policy, Vol. 21(5), pp.432-449.
Crouch, C. (2005), “Typologies of Capitalism”, In Capitalist Diversity and Change, Oxford, Oxford University Press, pp.25-45.
De la Porte, C., Pochet, P. (eds.) (2002), Building Social Europe Through the Open Method of Coordination, Brussels, P.I.E. – Peter Lang.
Esping-Andersen, G. (2000), “Um Estado-Providência para o Século XXI”, in M. J. Rodrigues (ed.), Para uma Europa da Inovação e do Conhecimento, Oeiras, Celta, pp.79-125.
Estevez, M., Iversen, T., Soskice, D. (2001), “Social Protection and the Formation of Skills: A reinterpretation of Welfare State”, In P. Hall and D. Soskice (eds.), Varieties of Capitalism: The Institutional Foundations of Comparative Advantage, Oxford, Oxford University Press, pp.145-183.
European Commission (1994), White Paper – European social policy: A way forward for the Union, Office for Official Publications of the European Commission, Luxembourg.
European Commission (2006), The Demographic future of Europe – from challenge to opportunity.
DINÂMIA’CET – IUL, Centro de Estudos sobre a Mudança Socioeconómica e o Território ISCTE-IUL – Av. das Forças Armadas, 1649-026 Lisboa, PORTUGAL
Tel. 217938638 Fax. 217940042 E-mail: [email protected] http://dinamiacet.iscte-iul.pt/
25
Faini, R. (2006), “Europe: a continent in decline?”, in P. W. Rohde e G. Toniolo (eds.), The Global Economy in the 1990’s: A Long-run Perspective, Cambridge, Cambridge University Press, pp. 69-88.
Ferrera, M., Hemerijck, A., Rhodes, M. (2001), “The Future of the European ‘Social Model’ in the Global Economy”, Journal of Comparative Policy Analysis, 3(2), pp.163-190.
Giddens, A. (2007), Europe in the Global Age, Cambridge, Polity Press.
Goetschy, J. (2003), “European Employment Policy since the 1990s”, In B. Keller and H-W Platzer (eds.), Industrial Relations and European Integration, Hampshire, Ashgate, pp.137-159.
Goetschy, J. (2006), “Tacking stock of social Europe: is there such a thing as a community social model?”, in M. Jepsen, A.S. Pascual (eds.), Unwrapping the European Social Model, Bristol, Polity Press, pp.47-72.
Goetschy, J. (2009), “The Lisbon Strategy and social Europe: two closely linked destinies”, in M. J. Rodrigues (ed.), Europe, Globalization and the Lisbon Agenda, Cheltenham, Edward Elgar, pp.74-90.
Hall, P. (2007), “The Evolution of Varieties of Varieties of Capitalism in Europe”, In B. Hancké, M. Rhodes, and M. Thatcher (eds.), Beyond Varieties of Capitalism, Oxford, Oxford University Press, pp.39-85.
Hall, P., Soskice, D. (eds.) (2001), Varieties of Capitalism: The Institutional Foundations of Comparative Advantage, Oxford, Oxford University Press.
Hall, P., Thelen, K. (2009), “Institutional Change in Varieties of Capitalism”, In B. Hancké (ed.) Debating Varieties of Capitalism, Oxford, Oxford University Press, pp. 251-272.
Hodson, D., Simoni, M. (2009), “Lisbon through the looking glass: Europe’s knowledge economy and the Varieties of Capitalism”, In R. Liddle (ed.), After the crisis: A new socio-economic settlement for the EU, London, Policy Network, pp.115-127.