1Division of Cognitive and Behavioral Neurology, Instituto de Neurologia Deolindo Couto (INDC), Federal University of Rio de Janeiro,
Rio de Janeiro RJ, Brazil (UFRJ); 2Division of Neuroradiology INDC/UFRJ and Division of Imaging - ProCardiaco Hospital/RJ; 3Center
for Alzheimer’s Disease, CDA/IPUB/UFRJ.
Received 6 July 2004, received in final form 15 October 2004. Accepted 2 December 2004.
Dr. Eliasz Engelhardt - Avenida N.S. Copacabana 749/708 - 22050-000 Rio de Janeiro RJ - Brasil. E-mail: [email protected] Alzheimer’s disease (AD) is the most common
degenerative dementia. It progressively aff e c t s cortical areas and subcortical structures, undermi-ning the normal function, and leads to progressive cognitive and functional decline and to the appe-arance of behavioral disorders. Considering the severity and the prevalence of this disease there is a growing interest focused on its underlying
processes and the possibility of early diagnosis. The brains of AD patients exhibit neuropathologic changes (senile plaques, neurofibrillary tangles, neuronal loss, glial reaction). Considering the neu-rofibrillary degeneration, the degenerative process observed in AD presents a sequential pattern as de-termined by Braak and Braak’s1 n e u r o f i b r i l l a r y tangle/NFT and Delacourte’s and al.2paired helical
ALZHEIMER’S DISEASE AND PROTON MAGNETIC
RESONANCE SPECTROSCOPY OF LIMBIC REGIONS
A suggestion of a clinical-spectroscopic staging
Eliasz Engelhardt
1, Denise M. Moreira
2, Jerson Laks
3, José Luiz Sá Cavalcanti
1ABSTRACT -Objective:To compare magnetic resonance proton spectroscopic with clinical data and to propose a spectroscopic staging of Alzheimer’s disease (AD). Method: Subjects (n=46), normals (12) and with AD (34), paired to age (CDR0-CDR3); AD diagnosis according to DSM-IV/NINCDS-ADRDA criteria; 1H-MRS with
Signa Horizon LX-GE, 1.5T; single voxel at hippocampal region/HCR and posterior cingulate area/PCA.
Results:Statistically significant decrease (p<0.01) only of Naa/Cr - at HCR among the CDR0, CDR1+CDR2, and CDR3, and at PCA between CDR0 and CDR1+CDR2 in relation to CDR3. Conclusion:The HCR is the first to show Naa reduction (CDR1). The PCA suffers later (CDR3). These values decline progressively according to the severity stages. Considering the disparities between the HCR and PCA it is possible to suggest a spectroscopic (metabolite) staging (MS) of AD, as follows: MS0 (~CDR0)=both normal HCR and PCA, MS1-2 (~CDR1-MS1-2)=abnormal HCR and normal PCA, and MS3 (~CDR3)=both abnormal HCR and PCA. These results make possible the early diagnosis, to follow the degenerative process throughout the course, and to suggest a spectroscopic staging related to the clinical stages of AD.
KEY WORDS: Alzheimer disease, 1H-MRS, Naa, disease staging.
Doença de Alzheimer e espectroscopia de prótons por ressonância magnética de regiões límbicas: sugestão de um estadiamento clínico-espectroscópico
RESUMO -O b j e t i v o :Comparar dados de espectroscopia de prótons por ressonância magnética com clínicos e propor um estadiamento espectroscópico da doença de Alzheimer (DA). Método:Sujeitos (n=46), normais (12) e com DA (34), emparelhados por idade (CDR0-CDR3); diagnóstico de DA de acordo com os critérios DSM-IV/NINCDS-ADRDA;1H-MRS com Signa Horizon LX-GE, 1.5T; voxel único em região
hipocampal/RHC e área posterior do cíngulo/APC. Resultados: Redução estatisticamente significativa (p<0.01) apenas de Naa/Cr - na RHC entre CDR0, CDR1+CDR2 e CDR3, e na APC entre CDR0 e CDR1+CDR2 em relação a CDR3. Conclusão:A RHC é a primeira a apresentar redução de Naa (CDR1). A APC é acometida mais tardiamente (CDR3). Esses valores declinam progressivamente de acordo com os estágios de gravidade. Considerando as disparidades entre a RHC e a APC é possível sugerir um estadiamento espectroscópico (metabólico) (MS) da DA como segue: MS0 (~CDR0)=RHC e APC ambos normais, MS1-2 (~CDR1-2)=RHC anormal e APC normal e MS3 (~CDR3)=RHC e APC ambos anormais. Esses resultados permitem um diagnóstico precoce, o seguimento do processo degenerativo ao longo da evolução e sugerir um estadiamento espectroscópico relacionado aos estágios clínicos da DA.
filament/PHF-tau immunostaining stages. It begins in the primary limbic areas, hippocampal region (HCR), and spreads to associative limbic areas for instance, posterior cingulate area (PCA), and finally to the heteromodal areas, temporo-parieto-frontal cortex. Both groups of authors have shown that the (HCR) degenerates at an earlier stage (beginn-ing at NFT I-II/PHF-tau 1-3 stages and progress(beginn-ing), whereas at the PCA the degeneration occurs later (beginning at NFT III-IV/PHF-tau 6-7 stages and progressing).
The degenerative process, centered by neuronal loss and followed by corollary changes, such as tissue dysmetabolism, atrophy and gliosis, can be observed ‘in vivo’ with functional imaging techni-ques. Proton magnetic resonance spectroscopy (1H-MRS) permits the identification of neurometa-bolites related to several pathways of the interme-diate metabolism. N-acetylaspartate (Naa) is an aminoacid found only in neurons in the adult CNS, and is used as a measure of neuronal density. Ho-wever, it can also be considered a marker of neu-ronal function or viability, since Naa depletion is not always irreversible. Choline (Cho) is associated with membrane breakdown and turnover. Myo-ino-sitol (mI) is an organic osmolyte, also involved in second messenger system functioning, and repre-sents also a putative glial cell marker. Creatine (Cr) refers to the sum of creatine and phosphocreatine, reflecting energy use. The Cr peak is thought to be relatively stable between individuals and in most brain areas, therefore it is often used as an internal reference. Thus the technique can be used ‘in vivo’, in a nonivasive way, to evaluate neuronal integrity, glial reaction and energy metabolism3-7. The1H-MRS studies of post-mortem AD brains, as well as ‘in vivo’, have shown consistent reduction of Naa. This corresponds to the primary neurome-tabolite change in AD brain, reflecting neuronal dysfunction/loss. Changes of other metabolites are probably corollary occurrences7-13. Several studies have addressed this question aiming the hippocam-pal region9 , 1 1 , 1 4 - 1 8in mild-moderate AD patients. The posterior cingulum was also studied in mild-mo-derate AD and MCI patients in comparison to nor-mal controls - significantly lower values of Naa/Cr were found in AD patients compared both to MCI and normal control subjects1 9. Correlations of neu-rometabolites with cognitive assessment (ex., Mini-Mental State Examination/MMSE, Alzheimer’s Di-sease Assessment Scale-cognitive section (ADAS-cog) were found in only a few AD studies7. Studies
correlating Naa and cognition were mostly perfor-med aiming the perfor-medial temporal region on mild2 0 , 2 1 and mild-moderate AD patients9,22. Other cortical regions thought to be important in memory circuits, like the posterior cingulum, were less studied1 9. Lon-gitudial studies were performed by Adalsteinsson et al.23and Dixon et al.24over the course of one year and by Jessen et al.22over 2 years, on mild-moderate AD patients. Adalsteinsson’s et al.23 re-ported an overall decline of Naa concentration over time, but the medial temporal lobes were not in-cluded in the analysis; Dixon’s et al.24study of the hippocampus showed that the decrease of Naa was not significant after one year follow-up, and Jessen’s et al.22study was performed on patients who participated in a former cross-sectional study. In this follow-up (with a mean interval of 23 mon-ths) a correlation of Naa/Cr decrease in the medial temporal lobe with cognitive decline was observed. Considering that the1H-MRS metabolite studies rely on the degenerative process, and that there is a chronological difference of the degeneration bet-ween hippocampal region and posterior cingula-te area, it is rational to compare the spectroscopic changes of these regions in each clinical severity stage to look for a possible spectroscopic staging of the degenerative process of AD ‘in vivo’.
The aim of the present study is to follow the sequential degenerative process at the hippocam-pal region and posterior cingulate area in AD pa-tients, from mild to severe clinical stages in com-parison to normal controls, to possibly identify a spectroscopical staging of AD. Preliminary results with this approach were already presented16-17.
METHOD
Subjects– Normal controls (n=12) and probable AD patients (n=34), totalizing 46 subjects constituted the sample. Two neurologists (EE and JLSC) and a psychiatrist (JL) evaluated the controls and patients at an outpatient clinic. Normal subjects had no cognitive impairment, psychiatric complaints or ADL problems. The diagnosis of probable AD was established according the DSM-IV and NINCDS-ADRDA criteria. The ischemic score2 5was4
and the MMSE26scores were obtained. The clinical
sta-ging was according to the Clinical Dementia Rating (CDR)27. The characteristics of the sample are shown in
Table 1.
Technique –MRI and single voxel 1H-MRS studies
PRESS pulse sequence with TR1500ms/TE30ms. The vo-lumes of interest (VOI) studied were localized in the left and right medial temporal lobes (hippocampal region = entorhinal area + subiculum + hippocampus proper + dentate gyrus) (HCR, l&r) and posterior cingulate area (mainly part of Brodmann’s area 23) (PCA, bilateral). The following metabolites expressed as ratios were studied: N-acetylaspartate (Naa/Cr), choline (Cho/Cr) and myo-ino-sitol (mI/Cr). A qualified specialist (DMM) supervised all neuroimaging procedures.
Statistics –Data analysis was performed using ANOVA and post-hoc calculation (Tukey)28,29. Descriptive results
of mean and sd were expressed in the tables till the cen-tesimal order.
Ethics –The study was approved by the local Ethics Committee (CEP-IPUB/UFRJ)/informed consent signed.
RESULTS
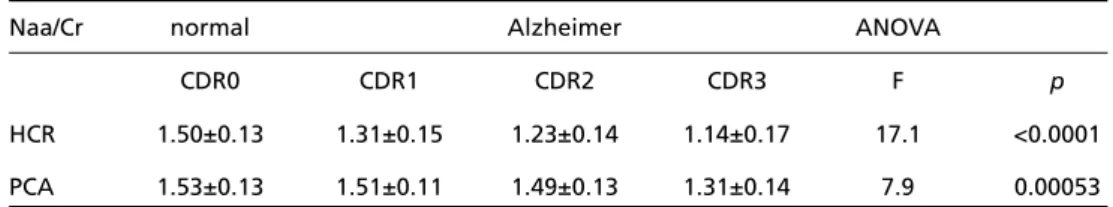
The present data relate to the metabolite ratios obtained for the HCR and the PCA. The results of the HCR were obtained from the pooled data of each CDR stage sample. The data for the Naa/Cr are shown on Table 2.
There was statistical significance in the diff e r e n-ce of Naa/Cr values among stages as shown by the ANOVA summary and the Tukey test.
For the other metabolite ratios, Cho/Cr and mI/Cr, there was no statistical significance among stages as shown by ANOVA and Tukey test, for both hippocampal region and posterior cingulate area. In view of the results and considering that the Naa changes are the most important findings to evaluate neuronal degeneration, only the Naa/Cr ratio was taken in account.
There was no statistical significance between
Naa results of CDR1 and CDR2 patients at the hip-pocampal region, and among CDR0, CDR1 and CDR2 at the posterior cingulate area. Additionally, Naa values of CDR1 and CDR2 stages were related to the normal values found at the posterior cingu-late area, and are also frequently put together in clinical trials (mild-moderate AD). Thus, these sta-ges could be joined for a further analysis. The re-sults obtained are shown on Table 3.
In other words, the Naa data at the hippocampal region were statistically significant for CDR0 vs CDR1+CDR2 vs CDR3 stages, and at the posterior cingulate area only between CDR2 vs CDR3 stages.
DISCUSSION
The increasing prevalence rate of AD and the upcoming new specific therapeutic possibilities lead to the need of earlier and more accurate d i a g-nosis of the disease.1H-MRS of the brain may be considered a valuable investigative and clinical tool for early diagnosis of AD as it permits to know the metabolite composition of normal and patho-logic nervous tissue sample(s) ‘in vivo’, in a nonin-vasive way. It also permits a better understanding of physiological and pathophysiological mecha-nisms in normal state and in disease condition4-6. The choice of the VOIs is very important if one con-siders early diagnosis and disease progression stu-dies. Based on neuropathological studies, it was al-ready shown that the hippocampal region is the best early target and that the posterior cingulate area is a suitable target for later assessment1,2.
Some spectroscopic studies relied on functional results (SPECT and PET techniques) to underpin the choice of the VOIs. Excluding the well-known
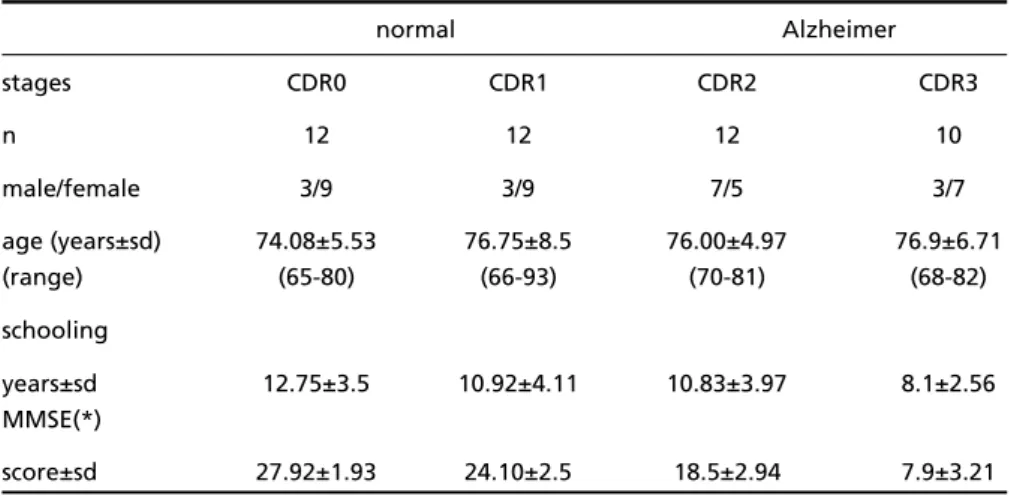
Table 1. Characteristics of the sample.
normal Alzheimer
stages CDR0 CDR1 CDR2 CDR3
n 12 12 12 10
male/female 3/9 3/9 7/5 3/7
age (years±sd) 74.08±5.53 76.75±8.5 76.00±4.97 76.9±6.71
(range) (65-80) (66-93) (70-81) (68-82)
schooling
years±sd 12.75±3.5 10.92±4.11 10.83±3.97 8.1±2.56 MMSE(*)
score±sd 27.92±1.93 24.10±2.5 18.5±2.94 7.9±3.21
results of hypoperfusion/hypometabolism of the temporo-parietal cortical region, considered con-sistent and characteristic of AD beyond the earliest stages, these studies need some comments. The anatomofunctional focus of such studies was the distributed brain network pertaining to memory systems, constituted basically by the hippocampal region, mammilary bodies, thalamus, and posterior c i n g u l u m3 0 - 3 4. Minoshima’s et al.3 2study is frequently referred to justify the selection of the posterior cin-gulate cortex for spectroscopic studies for early diagnosis of AD and MCI. This group described a metabolic reduction (glucose metabolism with PET) in the posterior cingulate cortex in very early AD, but remarked that in spite of technical diffi-culties, the metabolic activity of the inferior tem-poral lobe appeared decreased. Other studies, such as Johnson’s et al.31(perfusion with SPECT) for preclinical prediction of AD, Fakhri’s et al.30
(MRI-guided quantitative SPECT and volumetric MRI) to identify prodromal phase of AD, and Nestor et al.33(MRI combined with PET), in patients with mild AD, showed in a general way that regional decreases in perfusion were more prominent, in order of discriminating power, at the hippocampal region, the amygdala, the posterior cingulate, the thalamus, and the anterior cingulate.
These studies confirm that AD is associated with dysfunction of networks implicated in human am-nesia. Coherent with this is the finding of hypo-metabolism in the hippocampal complex. Earlier negative results were possibly due to a lack of spa-tial resolution and/or poor localization of the neu-roimaging techniques. Thus, the hippocampal re-gion can be considered as the earliest structure to show hypoperfusion or hypometabolism, and that other structures of the memory network are also a ffected. Some of these structures (for instance, the Table 2. Values for the Naa/Cr metabolite ratio at HCR and PCA - normal subjects (CDR0) and probable
AD patients (CDR1, CDR2, CDR3).
Naa/Cr normal Alzheimer ANOVA
CDR0 CDR1 CDR2 CDR3 F p
HCR 1.50±0.13 1.31±0.15 1.23±0.14 1.14±0.17 17.1 <0.0001 PCA 1.53±0.13 1.51±0.11 1.49±0.13 1.31±0.14 7.9 0.00053
HCR, hippocampal region; PCA, posterior cingulate area.
Table 3. Values for the Naa/Cr metabolite ratio at HCR and PCA - normal subjects (CDR0) and probable AD patients (CDR1+CDR2 and CDR3), and Tukey test.
Naa/Cr normal Alzheimer ANOVA
CDR0 CDR1+CDR2 CDR3 F p
HCR 1.50±0.13 1.27±0.15 1.14±0.17 23.32 <0.0001 PCA 1.53±0.13 1.50±0.12 1.31±0.14 10.91 0.000147
pair-wise comparisons via Tukey HSD (VassarStats) - HCR
CDR0 CDR1-2 CDR3 CDR1-2 CDR3
Mean 1.50 1.27 1.14 CDR0 p<0.01 p<0.01
N 15 40 18 CDR1-2 p<0.01
MS=0.02;df=70
HSD.05=0.11; HSD.01=0.13
pair-wise comparisons via Tukey HSD (VassarStats) - PCA
CDR0 CDR1-2 CDR3 CDR1-2 CDR3
mean 1.53 1.50 1.31 CDR0 n/s p<0.01
n 12 24 10 CDR1-2 p<0.01
MS=0.02;df=43
HSD.05=0.13; HSD.01=0.17
caudal portion of the anterior cingulate and the posterior cingulate) probably suffer deaff e r e n t a t i o n due to earlier lesion of the hippocampal region and its projection to the cingulate gyrus as shown by morphological and experimental studies34-36, and do not reflect primary and early injury. Therefore it is possible to suggest that spectroscopy may o ffer better data on the degenerative situation of a given region in comparison to the isotopic func-tional methods that show regional changes of per-fusion or metabolism, reflecting probably not on-ly local changes, but also (and moston-ly, depending on the stage of the disease) the repercussion (deaf-ferentation) from distant affected structures.
Several studies on the hippocampus9,11,14,16-18,20 and one on the cingulum19with mild or mild-mo-derate AD patients were found in the literature. H o w e v e r, no studies were found in which spe-ctroscopic data of these limbic regions are com-pared and related to the clinical severity stages of AD and normal controls. The analysis of the studies, already discussed formerly, in comparison to the present one show the consistent reduction of N a a / C r, in both the hippocampus9 , 1 1 , 1 4and posterior cingulum19, in a progressive way20-24. There were no changes in other metabolites regarding the pre-sent objective.
There is a clear correlation between the present spectroscopic findings and the CDR staging of A D . The progressive decrease of Naa runs in parallel with the increasing severity of the disease (Table 2). Such results have not been reported in other studies. In the same way, there is a correlation bet-ween the present spectroscopic findings and cog-nition. The progressive decrease of Naa also runs in parallel with the decline of the MMSE scores (compare Table 1 and Table 2) obtained in each clinical stage. Such observation has been reported in only a few AD studies9,20-22.
The sequential degeneration of the hippocam-pal region and of the posterior cingulate area sho-ws a chronological disparity that can be used to follow the progression of the degenerative process and allow for a spectroscopic staging of the disease. The hippocampal region is the first to show reduc-tion of Naa values (a specific neuronal marker) beginning at Braak’s/Delacourte’s NFT I-II/PHF-tau 1-3 stages (~CDR1), and declining progressively as the disease worsens (CDR2 and CDR3). The Naa va-lues at posterior cingulate area decrease later, from Braak’s / D e l a c o u r t e ’s NFT III-IV/PHF-tau 6-7 stages (~CDR3).
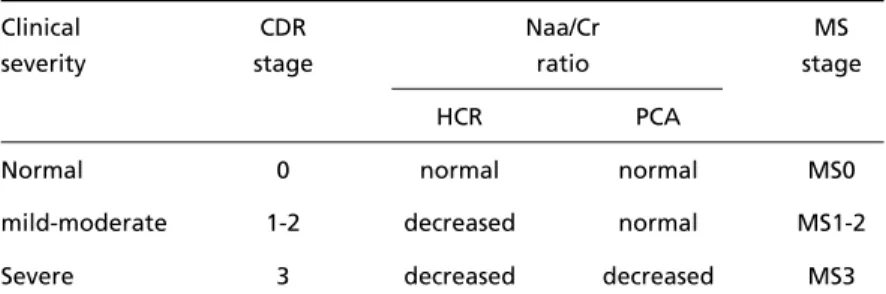
Thus, considering the Naa/Cr ratio, it is possible to follow the degenerative process throughout the several clinical stages, from CDR1 to CDR3, as well as to suggest a 1H-MRS metabolite staging of the disease in relation to the clinical stages as shown in Table 4.
These results can be used as a tool for diagnosing the initial phase of AD, considering the early chan-ges at the HCR. It also permits to follow the HCR degeneration throughout the course of the disease. In addition, considering the chronological disparity of the degenerative process between the hippocam-pal region and the posterior cingulate area, a spec-troscopic staging of the disease can be suggested. In conclusion, the hippocampal region, the first to present neuropathological changes in AD, is also the first to show Naa reduction (from CDR1 on). These values show a progressive declining trend according to the severity stages. The posterior cingulate area suffers later neuropathological as well as spectroscopical changes (CDR3). There is a clear correlation between the Naa reduction, CDR stages and cognitive decline, as assessed with the MMSE. The present study adds to the knowledge that the AD degeneration follows a chronologically d i fferent tempo, and correlates with cognitive de-Table 4. Criteria for a spectroscopic staging of AD.
Clinical CDR Naa/Cr MS
severity stage ratio stage
HCR PCA
Normal 0 normal normal MS0
mild-moderate 1-2 decreased normal MS1-2
Severe 3 decreased decreased MS3
cline and CDR worsening. These results make pos-sible (i) the early diagnosis of AD using the data of the metabolite changes at the hippocampal re-gion; (ii) to follow the degenerative process throu-ghout the course of the disease, and (iii) to suggest, considering the Naa/Cr ratio, a spectroscopic (meta-bolite) staging of the disease related to the clinical severity stages.
REFERENCES
1. Braak H, Braak E. Neuropathological staging of A l z h e i m e r- re l a t e d changes. Act Neuropathol 1991;82:239-259.
2. Delacourte A, Davidd JP, Sergeant N et al. The biochemical pathway of neurofibrillary degeneration in aging and A l z h e i m e r’s disease. Neurology 1999;52:1158-1165.
3. Baslow MH. N-acetylaspartate in the vertebrate brain: metabolism and function. Neurochem Res 2003;28:941-953.
4. Block W, Träber F, Flacke F, et al. In-vivo proton MR-spectroscopy of the human brain: assessment of N-acetylaspartate (NAA) reduction as a marker for neurodegeneration. Amino acids 2002;23:317-323. 5. E n g e l h a rdt E, Moreira DM, Laks J, et al. Espectroscopia de prótons (1H )
por ressonância magnética, neuroquímica cerebral e diagnóstico de doenças neurológicas. Rev Bras Neurol 2000;36:11-25.
6. Danielsen ER, Ross B. Magnetic resonance spectroscopy diagnosis of neurological diseases. New York: Marcel Dekker; 1999.
7. Ross AJ, Sachdev PS. Magnetic resonance spectroscopy in cognitive research. Brain Res 2004;44:83-102.
8. Chen JG, Charles HC, Barboriak DP, et al. Magnetic re s o n a n c e spectroscopy in Alzheimer’s disease: focus on N-acetylaspartate. Acta Neurol Scand 2000;(Suppl)176:S20-S26.
9. E n g e l h a rdt E, Moreira DM, Laks J, et al. Doença de Alzheimer e espectroscopia por ressonância magnética do hipocampo. Arq Neuro-psiquiatr 2001;59:865-870.
10. M e y e rh o ff DJ, MacKay S, Constans JM, et al. Axonal injury and membrane alterations in A l z h e i m e r’s disease suggested by in vivo p roton magnetic resonance spectroscopic imaging. Ann Neuro l 1994;36:40-47.
11. Schuff N, Amend D, Ezekiel BA, et al. Changes of hippocampal N-acetylaspartate and volume in A l z h e i m e r’s disease: A p roton MR spectroscopic imaging and MRI study. Neurology 1997;49:1513-1521. 12. Shonk TK, Moats RA, Giff o rd P, et al. Probable Alzheimer disease: diagnosis with proton MR spectroscopy. Radiology 1995;195:65-72. 13. P f e fferbaum A, Adalsteinsson E, Spielman D, et al. In vivo brain
concentrations of N-acetyl compounds, creatine, and choline in Alzheimer’s disease. - Arch Gen Psychiatry 1999;56:185-192. 14. Block W, Träber F, Kuhl CK, et al. 1H-MR-spektroscopische Bildgebung
bei Patienten mit klinisch gesichertem Morbus A l z h e i m e r. Fortschr Röntgenstr 1995;163:230-237.
15. Block W, Jessen F, Träber F et al. Regional N-acetylaspartate reduction in the hippocampus detected with fast proton magnetic re s o n a n c e s p e c t roscopic imaging in patients with A l z h e i m e r’s disease. A rc h Neurol 2002;59:828-834.
16. Engelhardt E, Laks J, Cavalcanti JLS, et al. Alzheimer’s disease, limbic 1H-MRS and CDR stages. J Neurol Sci 2003;214:62.
17. Engelhardt E, Laks J, Cavalcanti JLS, et al. Alzheimer’s disease and proton magnetic resonance spectroscopy of hippocampal region: Naa values vs CDR stages: preliminary results. A rq Neuro p s i q u i a t r 2003;(Suppl):S2:S80.
18. Jessen F, Block W, Träber F, et al. Proton MR spectroscopy detects a relative decrease of N-acetylaspartate in the medial temporal lobe of patients with AD. Neurology 2000,55:684-688.
19. K a n t a rci K, Jack CR Jr, Xu YC, et al. Regional metabolic patterns in mild cognitive impairment and A l z h e i m e r ’s disease: a 1H-MRS study. Neurology 2000;5:210-217.
20. Chantal S, Labelle M, Bouchard RW, et al. Correlation of regional pro t o n magnetic resonance spectrosocpic metabolic changes with cognitive deficits in mild Alzheimer’s disease. Arch Neurol 2002;59:955-962. 21. Chantal S, Braun CMJ, Bouchard RW, et al. Similar 1H magnetic
resonance spectroscopic metabolic pattern in the medial temporal lobes of patients with mild cognitive impairment and Alzheimer’s disease. Brain Res 2004;1003:26-35.
22. Jessen F, Block W, Träber F, et al. Decrease of N-acetylaspartate in the M T L c o r relates with cognitive decline of AD patients. Neuro l o g y 2001;57:930-932.
23. Adalsteinsson E, Sullivan EV, Kleinhans N, et al. Longitudinal decline of neuronal marker N-acetyl aspartate in Alzheimer’s disease. Lancet 2000;355:1696-1697.
24. Dixon R, Bradley KM, Budge MM, et al. Longitudinal quantitative p roton magnetic resonanace spectroscopy of the hippocampus in Alzheimer’s disease. Brain 2002;125:2332-2341.
25. Hachinski VC, Iliff LD, Zilka E, et al. Cerebral blood flow in dementia. Arch Neurol 1975;32:632-637.
26. Folstein MF, Folstein SE, McHugh PR, et al. “Mini-Mental State”: a practical method for grading the cognitive state of patients for the clinician. J Psychiat Res 1975;12:189-198.
27. Hughes CP, Berg L, Danziger WL, et al. Clinical dementia rating. Neurology 1982;43:2412-2413.
28. Graphpad: http://graphpad.com/quickcalcs, 2002.
29. VassarStats: http://faculty. v a s s a r.edu/lowry/ VassarStats. Html (2001). 30. Fakhri G El, Kijeewski MF, Johnson KE, et al. MRI-Guided SPECT Perfusion measures and volumetric MRI in pro d romal A l z h e i m e r disease. Arch Neurol 2003;60:1066-1072.
31. Johnson KA, Jones K, Holman BL, et al. Preclinical prediction of Alzheimer’s disease using SPECT. Neurology 1998;50:1563-1571. 32. Minoshima S, Giordani B, Berent S, et al. Metabolic reduction in the
posterior cingulate cortex in very early A l z h e i m e r ’s disease. A n n Neurol 1997;42:85-94.
33. Nestor PJ, Fryer TD, Smeilewski P et al. Limbic hypometabolism in A l z h e i m e r’s disease and mild cognitive impairment. Ann Neuro l 2003;54:343-351.
34. Vogt BA, Pandya DN. Cingulate cortex of the rhesus monkey: II. Cortical afferents. J Comp Neurol 1987;262:271-289.
35. H e d b e rg TG, Simpson GV, Stanton PK. Micro c i rcuitry of posterior cingulate cortex in vitro: eletrophysiology and laminar analysis using the current source density method. Brain Res 1993;632:239-248. 36. Maddock RJ. The retrosplenial cortex and emotion: new insights from