0103 - 5053 $6.00+0.00
Article
*e-mail: [email protected]
Phosphoric Acid Adsorbed on Silica-Ceria Matrix Obtained by Sol-Gel Method:
Studies of Local Structure, Texture and Acid Property
Fábio L. Pissetti,a Maria Suzana P. Francisco,a Richard Landersb and Yoshitaka Gushikem*,a
a
Instituto de Química, Universidade Estadual de Campinas, CP 6154, 13084-971 Campinas-SP, Brazil
b
Instituto de Física Gleb Wataghin, Universidade Estadual de Campinas, CP 6165, 13084-971 Campinas-SP, Brazil
Óxidos mistos de SiO2/CeO2 (designados como SC) contendo quantidades variáveis de céria, SC1 = 5,6, SC2 = 8,0 e SC3 = 13,0 (% em massa), foram preparados pelo método de processamento sol-gel e obtidos como sólidos amorfos possuindo áreas superficiais específicas de SC1 = 463, SC2 = 474 e SC3 = 460 m2g-1. Íons fosfatos foram imobilizados na superfície
destes sólidos, através da ligação química Ce-O-P, pela imersão de SC em uma solução de ácido fosfórico. Este procedimento produziu sólidos com as seguintes quantidades de P adsorvidas na superfície (em % atômica): SCP1 = 0,60, SCP2 = 0,71 e SCP3 = 1,63. A energia de ligação P 2p3/2, obtida por XPS, e o único pico observado em -10 ppm, por NMR de 31P, revelaram que
o fosfato adsorvido na superfície é a espécie H2PO4–. Utilizando-se piridina como sonda
molecular, somente sítios ácidos de Brønsted foram detectados. A determinação das quantidades destes sítios ácidos, feita pela adsorção de NH3 gasosa sobre a superfície, revelou os seguintes valores para cada sólido tratado com o íon fosfato: SCP1 = 0,37, SCP2 = 0,43 e SCP3 = 0,51 mmol g-1.
SiO2/CeO2 mixed oxide (designated as SC) with variable ceria contents, SC1 = 5.6, SC2 = 8.0 and SC3 = 13.0 wt%, prepared by the sol-gel processing method, were obtained as amorphous solids possessing specific surface areas of SC1 = 463, SC2 = 474 and SC3 = 460 m2g-1. Phosphate ions were immobilized onto the surface of these solids through
Ce-O-P bonding by immersing SC into a phosphoric acid solution. Solids with the following Ce-O-P contents were obtained (in atom %): SCP1 = 0.60, SCP2 = 0.71 and SCP3 = 1.63. The binding energy peak P 2p3/2 at ca. 134.0 eV, observed by XPS, and the 31P MAS NMR
single peak, observed at ca. -10 ppm,revealed that H2PO4– is the species present on the
surface of the matrices. Using pyridine as a molecular probe, only Brønsted acid sites could be detected. The amount of these acid sites, determined by ammonia gas adsorption on the surface, reached the following values for each phosphate-treated solid: SCP1 = 0.37, SCP2 = 0.43 and SCP3 = 0.51 mmol g-1.
Keywords: silica-ceria, silica-ceria-phosphate, sol-gel method, acid sites
Introduction
Cerium(IV) phosphate can be prepared by reacting phosphoric acid with diammonium cerium(IV) nitrate, by
an acid sol-gel process involving controlled precipitation,1
or by using a chelating agent to obtain nanocrystalline
mesoporous solids with controlled pore size.2 It can also be
obtained by hydrothermal synthesis from the reaction of
CeO2 and phosphoric acid.3 A recent interesting process
described in the literature consists of a reproducible and
controllable route to produce cerium phosphate nanotubes.4
Cerium phosphate can have many applications as
ceramic material,5 as a glass presenting optical6 and
luminescent7 properties, as ion exchanger8 and catalyst.9
It can also be prepared as phosphate particles dispersed in hybrid organic-inorganic matrices, aiming at their use in filtering process.10,11
Processes to prepare metal oxides incorporated into a silica matrix have been described in recent years. Mixed
oxides of the SiO2/MxOy type have been obtained by the
homogeneously dispersed particles.12-15 SiO
2/MxOy obtained
by this method normally presents high thermal and
mechanical stability provided by the silica framework.13,16
Despite this rigid structure, the metal oxide MxOy presents
reactive MOH groups on the surface which can easily react
with organic or inorganic acids forming a stable linkage.17
In this work, the preparation of microporous SiO2/CeO2
mixed oxide by the sol-gel process and the subsequent immobilization of phosphate groups onto the surface of this matrix are reported. The objective was to obtain cerium(IV) confined in a silica matrix and attached to phosphate species by Ce-O-P bonds. The textural, thermal
stability, local structure and acidic properties of SiO2/
CeO2/Phosphate were investigated by XRD, XPS, FTIR
and SEM/EDS techniques.
Experimental
Preparation of SiO2/CeO2 by the sol-gel method
The silica/ceria mixed oxide, SiO2/CeO2, was prepared
by the sol-gel method. In a reaction flask containing 150 mL of absolute ethanol (Synth), 175 mL of tetra-ethylorthosilicate (TEOS-Aldrich), 16 mL of twice
distilled H2O and 2.3 mL of concentrated nitric acid were
added and the resulting solution was heated with constant stirring at 353 K for 3 hours. After cooling the solution,
different amounts of (NH4)2Ce(NO3)6 (0.014, 0.027 and
0.040 mol), dissolved in mixtures containing 100 mL of ethanol and 25 mL of twice distilled water, were added. The mixtures were stirred for additional 3 hours at 298 K.
Then, 1.3 mL of concentrated HNO3 in 9.5 mL of distilled
water were added and the solution was stirred for other 2 hours. The solvent was evaporated from the mixtures at 373 K, producing gelatinous materials. The gels obtained were heated at 473 K under constant air flow for two hours. The materials obtained with increasing amount of ceria will be hereafter designated as SC1, SC2 and SC3.
The thermal stabilities were investigated submitting SC1, SC2 and SC3 to heat treatment at 473, 673, 873, 1073 and 1273 K, with a plateau of 8h for each temperature.
Phosphate adsorption on the SiO2/CeO2 mixed oxide
About 1.5 g of each SC were immersed in 40 mL of a
0.1 mol L-1 H
3PO4 solution and allowed to stand, with
occasional shaking, for 72 hours. The mixtures were filtered, washed with water and dried at room temperature. They were designated as SCP1, SCP2 and SCP3, respectively.
X-ray diffraction and X-ray fluorescence
X-ray diffraction patterns were obtained on a Shimadzu
XRD-6000 diffractometer by using Cu Kα radiation
(λ = 0.154 nm, 40kV per 30 mA) and a sweeping velocity
of 2 degree min-1 (units of 2θ).
The amount of cerium in the silica matrix was determined by X-ray fluorescence analysis. Mechanical
mixtures of finely powdered SiO2 (Merck) and CeO2 (Carlo
Erba), containing different ratios of Si/Ce, were used to obtain the calibration curve. The measurements were carried out on a SHIMADZU EDX-700 using a rhodium X-ray anode (50 kV) as source.
Specific surface area (SBET) and average pore size
Samples of the SC and SCP materials were
previously heated at 343 K under vacuum (1.3 × 10⁻³
Pa) for 1 h. The specific surface areas were determined by the BET method, while the average pore size was determined by nitrogen adsorption-desorption iso-therms (using the BJH method) on an ASAP 2010 apparatus from Micromeritics.
Scanning electron microscopy (SEM) and X-ray emission analyses (EDS)
Samples were fixed onto a double faced tape adhered to an aluminum support and coated with a layer of gold
(ca. 15 nm) by a BalTec SCD 050 Sputter Coater apparatus
(60 mA current for 60 s). The scanning electron microscopy analysis (SEM) was carried out using low vacuum microscopy on a JSM 5900LV equipment operating at an accelerating voltage of 25 kV. Images were obtained by using secondary electrons. X-ray emission spectroscopy (EDS) was used for elemental mapping with a Noram Voyager instrument. The micrographs and the
elemental maps were obtained for all contents of CeO2
oxide supported by silica.
High power decoupling-magic angle spinning 31P NMR
The high power decoupling magic angle spinning
(HPDEC-MAS) 31P NMR spectra of all solids were
obtained at room temperature on a Bruker AC300/P spectrometer operating at 121 MHz. Conditions used were a sequential pulse with an acquisition time of 41 ms and a relaxation time of 4 seconds. Phosphoric acid (85 wt%;
δ = 0 ppm) and sodium hydrogen phosphate (δ = 0.9 ppm)
were used as primary and secondary references for the
X-ray Photoelectron Spectroscopy (XPS)
Spectra were recorded on a VSW HA-100 Spherical Analyzer operating with pass energy of 44 eV and an
Al-Kα radiation source (1486.6 eV). Samples were prepared
as powder pressed into pellets, fixed to a stainless steel sample holder with double-faced tape and analyzed as prepared. The binding energies were referenced to the C 1s line at 284.6 eV and the photoemission lines were simulated with Gaussian line shapes. The relative surface compositions were calculated from the photoelectron peak areas after correction for the photo-ionization cross section
and the difference in the electron escape depth.18 The
atomic compositions were estimated from the C 1s, O 1s,
Si 2p, P 2p and Ce 3d5/2 integrated peak areas.
Infrared spectrometry for determining acidic properties
The Brønsted acid sites on the surface of all SC and SCP samples were studied by analyzing the infrared spectra of pyridine as a probe molecule. About 100 mg of the ground sample were wetted with liquid pyridine at room temperature
and the samples were then submitted to vacuum (1.3 × 10⁻⁵
Pa), initially at room temperature, to eliminate physically adsorbed pyridine. The self-supported pressed disks were heated under vacuum at 373 and 473 K and, for each temperature, spectra were obtained at room temperature on a Bomen Hartmann & Braun (MB-Series) spectrophotometer. FTIR spectra of samples as prepared and of the heated materials were obtained on the same spectrophotometer, using pressed KBr pellets containing 1 wt% of the material.
Ammonia gas adsorption
A 250 mL erlenmeyer flask with about 1 g of each
SCP material was filled with NH3 gas and closed for 30
minutes at room temperature. The excess of gas was
pumped off at 1.3 × 10⁻³ Pa at room temperature. The
amount of ammonia adsorbed in the material was determined by the Kjeldhal method.
Results and Discussion
Characteristics of the samples
The X-ray fluorescence analyses of the samples
showed the following amounts of CeO2 for the three SC
mixed oxides (in wt%): 5.6, 8.9 and 13.0, which
correspond to 0.33, 0.53 and 0.76 mmol of Ce per gram,
respectively. The specific surface areas, SBET, and the
average pore diameters, —r, are presented in Table 1.
The specific surface areas of SC1, SC2 and SC3 remained practically constant when compared with the corresponding modified solids SCP1, SCP2 and SCP3, except for SCP3, where a slight increase was observed. These results indicate that reaction of phosphoric acid
with CeO2, resulting in formation of phosphate species
on the surface, is not blocking the finest pores. Otherwise, a decrease of the specific surface areas by the species
formed should be observed.19
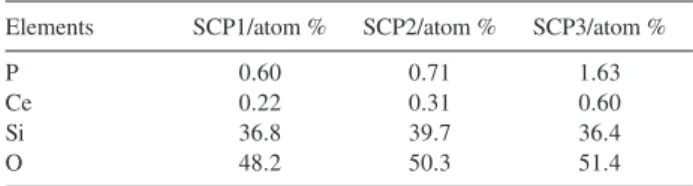
Contents of P, Ce, Si and O on the surface of the SCP solids were determined by the XPS technique. Table 2 lists the results obtained.
As the amount of surface Ce increases on the surface, the quantity of P also increases, evidencing that phosphoric acid is retained by the reaction with the metal oxide sites on the surface.
Figure 1 shows the IR spectra of SC and pure SiO2
treated at 473 K and compared with SC3 calcined at 1273
K. For pure SiO2, the band observed at 975 cm-1 (Figure
1d) is assigned to the Si-O stretching mode (νSiO) of free
silanol, ≡Si-OH, group.20 In the mixed oxide this frequency
is shifted to 948 cm-1 (Figures 1a-c), due to the Si-O-Ce
linkage formation.21,22 This band disappears on heating SC3
(taken as a model material) at 1273 K, presumably due to the breaking of the Si-O-Ce bonding as a consequence of
the increase in SiO2 and CeO2 particles size.
X-ray Diffraction patterns
Figure 2 shows the XRD patterns for SC1, SC2 and SC3 samples submitted to thermal treatments at 473, 673,
Table 1. Values of specific surface area, SBET, and average pore diameters, —r
Material Designated as SBET / (m2 g-1) — r/ nm
SiO2 / 5.6% CeO2 SC1 463 1.7
SiO2 / 8.9% CeO2 SC2 474 1.7
SiO2 / 13% CeO2 SC3 460 1.7
SiO2 / 5.6% CeO2 / P* SCP1 473 1.9
SiO2 / 8.9% CeO2 / P* SCP2 477 1.7
SiO2 / 13% CeO2 / P* SCP3 539 1.7
*P = phosphate.
Table 2. Elemental contents on SCP surface (in atom %), determined by XPS
Elements SCP1/atom % SCP2/atom % SCP3/atom %
P 0.60 0.71 1.63
Ce 0.22 0.31 0.60
Si 36.8 39.7 36.4
873, 1073 and 1273 K. Comparing the corresponding
diffraction peaks, particles of CeO2 incorporated into the
mixed oxide present some degree of crystallinity, which increases as the temperature is raised from 473 up to 1273 K. For SC2 and SC3, which contain more ceria, at 1273 K (Figures 2c and 3c) peaks at 28.5, 47.0 and 56.0 (in 2q)
match with CeO2 cerianite structure (JCPDS, file number
34-0394). SiO2 particles remain amorphous at this
temperature.
Scanning Electron Microscopy (SEM) and X-ray emission analysis (EDS)
Figure 3 shows the SEM micrographs and the corresponding cerium analyses by EDS (white points) for SCP3 (taken as the representative sample) thermally treated at 473 and 1273 K. The elemental mappings as a function of the thermal treatment temperature reveal that the cerium oxide is, within the magnification used, well dispersed in the silica matrix. Such a degree of dispersion is important, since it enables a uniform distribution of phosphate species on the surface in the adsorption process.17,23
31P NMR analysis
31P MAS NMR spectroscopy is a powerful technique
for studying the environment of metal phosphates, since
the chemical shift of the phosphate group is very sensitive to its local environment. In the present case, the spectra recorded for SCP1, SCP2 and SCP3 showed a single peak
at ca. –10 ppm (Figure 4). In comparison with crystalline
pure cerium phosphate, the observed chemical shift can be assigned to the dihydrogen phosphate species bonded
to the ceria particle, Ce-O-P(O)(OH)2.24 This assignment
Figure 1. FTIR spectra of (a) SC1, b) SC2, (c) SC3, (d) SiO2 thermally treated at 473 K and (e) SC3 calcined at 1273 K.
1300 1200 1100 1000 900 800
e
d
c
b
a
948 20%
975
Wavenumber / cm-1
T
ansmittance
/
%
Figure 2. X-ray diffractograms of a) SC1, b) SC2 e c) SC3 samples, cal-cined at 473, 673, 873, 1073 and 1273 K.
20 40 60 80 100 120
CeO 2 SiO 2
100 cps
1273 K 1073 K 873 K 673 K 473 K
2θ/ degree
b)
20 40 60 80 100 120
100 cps CeO 2
SiO 2
1273 K 1073 K 873 K 673 K 473 K
2θ/ degree
c)
2θ/ degree
20 40 60 80 100 120
CeO 2
SiO 2 100 cps
is also consistent with the presence of dihydrogen phosphate species in various M-phosphates (M= Nb, Ti, Zr and Al).17,25-27
X-ray Photoelectron Spectroscopy (XPS)
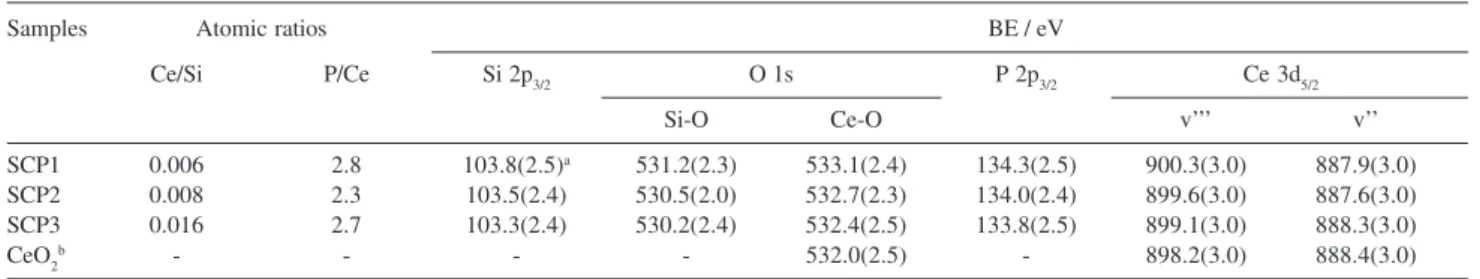
Table 3 lists the XPS binding energy values (BE) for SCP1, SCP2 and SCP3 thermally treated at 473 K.
The phosphate-adsorbed mixed oxide presented an
average binding energy value for the Si 2p peak at ca.
103.5 eV, with a width at half-maximum of 2.4 eV, similar to results from the literature for pure silica.23,28,29 All the
samples had the XPS spectrum of the O 1s level at 530.6 and 532.4 eV, with full width at half-maximum of 2.2
and 2.3 eV, attributed to the oxygens present in SiO228,29
and in CeO2,30 respectively.
The XPS of the Ce 3d level is complex, since photoemission provokes the re-arrangement of the electrons from the valence level and the resulting final
states contain different hybridizations. In Table 3, ν’’
and ν’’’ for CeO2 BE peaks refer to the bonding and
antibonding states due to the Ce 4f final state
hybridized with the O 2p orbital [the 3d94f1(O 2p5)]
electronic configurations and the [3d94f0(O 2p6)] final
state (ν’’’), respectively. The SCP samples present
cerium as Ce4+.30-34
Phosphorus presented only one photoemission peak,
which is assigned to the P 2p3/2 binding energy at ca.
134.0 eV (average value). This binding energy value is
assigned to the H2PO4_ species on the surfaces of the
three mixed oxides. These values are very close to that
observed for phosphate ions adsorbed as H2PO4– species
on the surfaces of SiO2/Nb2O5 17 and SiO
2/ZrO2 (134.5
eV)16 sol gel matrices. It is interesting to observe that P/
Ce atomic ratios obtained were: SCP1 = 2.8, SCP2 = 2.3 and SCP3 = 2.7. These values are not far from P/Ce = 2 ratio expected, if we consider that almost all ceria centers reacted and the species formed is the dihydrogen phosphate species.
The Ce/Si atomic ratios calculated for SCP1, SCP2 and SCP3 (Table 3) increased proportionally, taking into account an error of 8% in the calculation, as the ceria amount increased in these three matrices.
Table 3. Ce/Si and P/Ce atomic ratios (error of 8%) and binding energy (BE) values obtained for SCP samples thermally treated at 473 K
Samples Atomic ratios BE / eV
Ce/Si P/Ce Si 2p3/2 O 1s P 2p3/2 Ce 3d5/2
Si-O Ce-O v’’’ v’’
SCP1 0.006 2.8 103.8(2.5)a 531.2(2.3) 533.1(2.4) 134.3(2.5) 900.3(3.0) 887.9(3.0)
SCP2 0.008 2.3 103.5(2.4) 530.5(2.0) 532.7(2.3) 134.0(2.4) 899.6(3.0) 887.6(3.0)
SCP3 0.016 2.7 103.3(2.4) 530.2(2.4) 532.4(2.5) 133.8(2.5) 899.1(3.0) 888.3(3.0)
CeO2b - - - - 532.0(2.5) - 898.2(3.0) 888.4(3.0)
ain parenthesis: full widths at half-maximum; bstandard CeO 2.
Figure 3. a) Images obtained by MEV, b) the respective cerium mapping by EDS (white points), for SCP3 thermally treated at 473 K and c) MEV and d) the respective cerium mapping for SCP3 thermally treated at 1273 K.
Figure 4. Solid-state 31P MAS/NMR for (a) SCP1, (b) SCP2 and (c) SCP3 thermally treated at 473 K. * side bands.
100 50 0 -50 -100 -150
*
*
*
*
*
*
a) c)
b)
Acidic properties
An investigation of the acidic properties of the SC and SCP materials was made by using pyridine as a probe molecule. Figure 5 presents the FTIR spectra obtained for the SC3 and SCP3 samples, taken as representatives of the other materials, which did not present any significant
difference. The bands at 1599 and 1444 cm-1 are assigned
to the 8a and 19b vibrational modes, respectively, of the pyridine molecule bonded to the surface by hydrogen
bonds, possibly to the free silanol (≡SiOH) groups.35,36
We observe in Figures 5(I) and 5(II) that the intensities of these bands decrease on heat treatment under vacuum at
473 K. The band at 1490 cm-1 is assigned to the 19a
vibrational mode and it is always present for all kinds of pyridine adsorption.
The band observed at 1546 cm-1 in Figure 5(II) is
assigned to the 19a vibrational mode of the pyridine
molecule adsorbed on Brφnsted acid sites.37,38 These
Brønsted acid sites are due to the H2PO4– species bonded
to the matrix surface by Ce-O-P linkages. The result agrees with the conclusion from X-ray photoelectron spectros-copy, where the spectra of phosphorus presented only one photoemission peak due to the dihydrogen phosphate species on the surface of the mixed oxides. We also observe that they are very stable, since they are present on the surface even after heating the sample at 473 K. In Figure 5(I), for the SC3 sample, the vibrational mode due to pyridine molecules adsorbed on the Brønsted acid sites is not observed. The broadened feature of the band in this region is due to the OH deformation mode of free silanol
(≡SiOH) and the attached residual CeOH groups.
Ammonia gas adsorption
The infrared spectra of SCP1/NH3, SCP2/NH3 and
SCP3/NH3 (solids with adsorbed NH3) show a band
observed at ≈1454 cm–1, as seen in Figure 6. This vibration
mode is assigned to the δNH4+ deformation mode (F
2
mode) of the ion having a Td symmetry.39 The three SCP
pure samples do not show this band. Chemical analyses
carried out on SCP/NH3 showed the following amounts
of ammonia adsorbed on the surfaces: SCP1/NH3 = 0.37,
SCP2/NH3 = 0.43 and SCP3/NH3 = 0.51 mmol g-1.
Figure 5. Infrared spectra of pyridine adsorbed on (I) SC3 and (II) SCP3: a) room temperature, b) heated at 373 K and c) heated at 473 K.
1600 1500 1400
c) I)
II)
b)
a) 10%
Wavenunber / cm-1
T
ransmittance
/
%
T
ransmittance
/
%
Wavenunber / cm-1
1600 1500 1400
c)
b)
a) 10 %
Figure 6. Infrared spectra of a) SCP3 and with ammonia adsorbed on b) SCP1, c) SCP2 and d) SCP3.
1600 1400
10%
d)
c)
b)
a)
Wavenumber / cm-1
T
ransmittance
/
Conclusions
SiO2/CeO2 mixed oxide is obtained as a porous solid
in which CeO2 particles interact, through Si-O-Ce bonds,
with the SiO2 environment. This assumption is based on
the IR absorption band observed at 948 cm-1, assigned to
the ν(Si-O) mode of the Si-O-Ce bond. The SEM and
EDS images suggest that, within the magnification used,
CeO2 particles inside the silica matrix are homogeneously
dispersed.
Phosphoric acid reacted with the CeOH group, resulting in dihydrogen phosphate species attached to the matrix surface, according to the following equation:
SiO2/CeOH + H3PO4 SiO2/Ce P
O
OH
O OH + H2O
The average pore diameters of SC and SCP are the
same, i.e. 1.7 nm, except in the case of SCP2 where a
small increase is observed, i.e. 1.9 nm. This indicates that
the formation of cerium phosphate attached to the surface does not block the finest pores of the matrices.
Quantification of NH3 gas adsorbed on the SCP
matrices surface, assuming a homogeneous surface, indicated the following surface densities of acid sites on
the surface: SCP1 = 0.78×10⁻¹⁰, SCP2 = 0.90×10⁻¹⁰ and
SCP3 = 0.95×10⁻¹⁰ mol cm-2, which correspond to ca. 0.5
Brønsted acid sites per nm2.
Acknowledgments
The research work was partially performed at LME of the National Synchrotron Light Laboratory (LNLS), Brazil. The authors wish to acknowledge Prof. Carol H. Collins (IQ-UNICAMP) for manuscript revision and Rita de C. G. Vinhas for technical assistance. F. L.P. is indebted to CAPES for a doctoral fellowship. M.S.P. F. is indebted to FAPESP for a post-doctoral fellowship (grant 01/01248-9). Authors Y.G. and R.L. are indebted to FAPESP and CNPq for financial support.
References
1. Rajesh, K.; Mukundan, P.; Pillai, P. K.; Nair, V. R.; Warrier, K. G. K.; Chem. Mater. 2004, 16,2700.
2. Ho, L.; Nishiguchi, H.; Nagaoka, K.; Takita, Y.; Mater. Chem.
Phys. 2006, 97, 494.
3. Nazaraly, M.; Wallez, G.; Chanéac, C.; Tronc, E.; Ribot, F.; Quarton, M.; Jolivet, J. P.; J. Phys. Chem. Solids2006, 67, 1075.
4. Tang, C.; Bando, Y.; Goldberg, C.; Ma, R.; Angew. Chem., Int. Ed.2005, 44, 576.
5. Hirai, H.; Masui, T.; Imanaka N.; Adachi, G.; J. Alloys Compd. 2004, 374, 84.
6. Imanaka, N.; Masui, T.; Hirai, H.; Adachi, G.; Chem. Mater. 2003, 15, 2289.
7. Riwotzki, K.; Meyssamy, H.; Kornowski, A.; Haase, M.; J.
Alloys Compd.2000, 104, 2824.
8. Nilchi, A.; Khanchi, A.; Maragheh, M. G.; Talanta2002, 56, 383.
9. Rocha, G. M. S. R. O.; Johnstone, R. A. W.; Neves, M. G. P. M.
S.; J. Mol. Catal. A: Chem. 2002, 187, 95.
10. Varshney, K. G.; Tayal, N.; Colloids Surf., A 2000, 162, 49. 11. Varshney, K. G.; Tayal, N.; Gupta, P.; Agrawal, A.; Drabik, M.;
Indian J. Chem., A 2004, 43, 2586.
12. Ribeiro, E. S.; Rosatto, S. S.; Gushikem, Y.; Kubota, L. T.; J.
Solid State Electrochem.2003, 7, 665.
13. Cardoso, W.S.; Francisco, M. S. P.; Lucho, A. M. S.; Gushikem,
Y.; Solid State Ionics 2004, 167, 165.
14. Francisco, M. S. P.; Landers, R.; Gushikem, Y.; J. Solid State
Chem.2004, 177, 2431.
15. Gonçalves, J. E.; Gushikem Y.; de Castro, S. C.; J. Non-Cryst.
Solids 1999, 260, 125.
16. Alfaya, A.A.S.; Gushikem, Y.; de Castro, S.C.; Microporous
Mesoporous Mater.2000, 39, 57.
17. Francisco, M.S.P.; Cardoso, W.; Gushikem Y.; Kholin, Y.V.;
Langmuir2004, 20, 8707.
18. Craciun, R.; Solid State Ionics1998, 110, 83.
19. Alfaya, A.A.S.; Gushikem, Y.; de Castro, S.C.; Chem. Mater. 1998, 10, 909.
20. Kawano, Y.; Denofre S.; Gushikem, Y.; Vib. Spectrosc.1994, 7, 293.
21. Nigishi, N.; Fujii T.; Anpo, M.; Langmuir1993, 9, 3320. 22. Huter, R.; Dutoit, D.C.M.; Mallat, T.; Schneider M.; Baiker,
A.; J. Chem. Soc. Chem. Commun. 1995, 2, 163.
23. Scofield, J.H.; J. Electron Spectrosc.1976, 8, 129.
24. Hayashi, H.; Torii, K.; Nakata, S.; J. Mater. Chem.1997, 3, 557.
25. Chen, C.; Yang, Y. L.; Huang, K. L.; Sun, Z.H.; Wang, W.; Yi, Z.; Lin, Y. L.; Pang, W.Q.; Polyhedron 2004, 23, 3033. 26. Takahashi, H.; Oi, T.; Hosoe, M.; J. Mater. Chem.2002, 12,
2513.
27. Nakayama, H.; Eguchi, T.; Nakamura, N.; Yamaguchi, S.; Danjyo, M.; Tasuhako, M.; J. Mater. Chem.1997, 7, 1063. 28. Pârvulescu, V.; Pârvulescu, V. I.; Grange, P.; Catal. Today2000,
57, 193.
29. Francisco, M. S. P.; Landers, R.; Gushikem, Y.; J.Solid State
Chem.2004, 177, 2432.
32. Shyu, J. Z.; Weber, W. H.; Gandhi, H. S.; J. Phys. Chem. 1988, 92, 17.
33. Bak, K.; Hilaire, L.; Appl. Surf. Sci.1993, 70-71, 191. 34. Ernst, B.; Hilaire, L.; Kiennemann, A.; Catal. Today1999, 50,
413.
35. Parry, E.; J. Catal.1963, 2, 371.
36. Benvenutti, E. V.; Gushikem, Y.; Davanzo, C. U.; de Castro, S. C.; Torriani, I. L.; J. Chem. Soc. Faraday Trans.1992, 88, 3193. 37. Morterra, C.; Cerrato, G.; Langmuir1990, 6, 1810.
38. Benvenutti, E. V.; Gushikem Y.; Davanzo, C.U.; Appl. Spectrosc. 1992, 46, 1474.
39. Clearfield, A; Stynes, J.A.; J. Inorg Nucl. Chem.1964, 26, 117.
Received: September 26, 2006
Web Release Date: August 8, 2007