A vibrational spectroscopic study of the silicate mineral plumbophyllite
Pb
2
Si
4
O
10
H
2
O
Ray L. Frost
a,⇑, Andrés López
a, Yunfei Xi
a, Ricardo Scholz
b, Cristiano Lana
ba
School of Chemistry, Physics and Mechanical Engineering, Science and Engineering Faculty, Queensland University of Technology, GPO Box 2434, Brisbane, Queensland 4001, Australia
b
Geology Department, School of Mines, Federal University of Ouro Preto, Campus Morro do Cruzeiro, Ouro Preto, MG 35,400-00, Brazil
h i g h l i g h t s
We have studied the silicate mineral plumbophyllite Pb2Si4O10H2O. The structure consists of undulating
sheets of silicate tetrahedra. Raman and infrared bands are
attributed to stretching and bending vibrations of (SiO3)nunits.
Multiple water stretching and bending modes shows much variation in hydrogen bonding.
g r a p h i c a l
a b s t r a c t
a r t i c l e
i n f o
Article history:
Received 16 December 2013
Received in revised form 24 February 2014 Accepted 25 February 2014
Available online 12 March 2014
Keywords:
Plumbophyllite Silicate Apophyllite Pentagonite Raman spectroscopy Molecular water
a b s t r a c t
Raman spectroscopy complimented with infrared spectroscopy has been used to study the molecular structure of the mineral of plumbophyllite. The Raman spectrum is dominated by a very intense sharp peak at 1027 cm 1, assigned to the SiO stretching vibrations of (SiO
3)nunits. A very intense Raman band at 643 cm 1is assigned to the bending mode of (SiO
3)nunits. Raman bands observed at 3215, 3443, 3470, 3494 and 3567 cm 1are assigned to water stretching vibrations. Multiple water stretching and bending modes are observed showing that there is much variation in hydrogen bonding between water and the silicate surfaces. Because of the close similarity in the structure of plumbophyllite and apophyllite, a com-parison of the spectra with that of apophyllites is made. By using vibrational spectroscopy an assessment of the molecular structure of plumbophyllite has been made.
Ó2014 Elsevier B.V. All rights reserved.
Introduction
The mineral plumbophyllite[1,2]is a silicate mineral of formula Pb2Si4O10H2O and occurs as colourless to pale blue prismatic
crystals to 3 mm, with wedge-shaped terminations at the Blue Bell claims, about 11 km west of Baker, San Bernardino County, California. It is found in narrow veins in a highly siliceous hornfels
in association with cerussite, chrysocolla, fluorite, goethite, gyp-sum, mimetite, opal, plumbotsumite, quartz, sepiolite, and wulfen-ite[1,2].
The mineral is orthorhombic with space group Pbcn and cell parameters a= 13.2083(4), b= 9.7832(3), c= 8.6545(2) Å, V= 1118.33(5) Å3and Z= 4. The structure consists of undulating
sheets of silicate tetrahedra between which are located Pb atoms and channels containing H2O (and Pb2+lone-pair electrons)[1,2].
The silicate sheets can be described as consisting of zigzag pyroxene-like (SiO3)nchains joined laterally into sheets with the
http://dx.doi.org/10.1016/j.saa.2014.02.181 1386-1425/Ó2014 Elsevier B.V. All rights reserved.
⇑ Corresponding author. Tel.: +61 7 3138 2407; fax: +61 7 3138 1804.
E-mail address:[email protected](R.L. Frost).
Contents lists available atScienceDirect
Spectrochimica Acta Part A: Molecular and
Biomolecular Spectroscopy
unshared tetrahedral apices in successive chains pointed alter-nately up and down, a configuration also found in pentagonite
[1,2]. The structure of plumbophyllite is somewhat similar to that of pentagonite. The silicate sheets in pentagonite, although based on the typical hexagonal mesh pattern of basal O atoms, has the same alternating up-and-down configuration of apical O atoms as plumbophyllite. The structure consists of adjacent tetrahedral sheets in both structures are bound together by relatively strong bonds between interlayer cations and the apical O atoms.
Cavansite and pentagonite[3]belong to the vanadium silicate minerals which show an open porous structure with very small micron sized holes. Cavansite and pentagonite, dimorphs of Ca(VO)(Si4O10)4H2O represent novel, layered-silicate structure
types. Zigzag pyroxene-like (SiO3)n chains, joined laterally into sheets parallel to the a–c plane, are present in both minerals with tetrahedral apices pointed alternately plus and minus along the b axes[4]. The lateral linkage in cavansite results in a network of 4-fold and 8-fold rings, but in pentagonite the network is entirely made up of 6-fold rings[4]. The vanadyl groups VO2+and Ca2+ions
lie in mirror planes between the silicate layers and are coordinated alternately to pairs of tetrahedral apices along the chains on oppo-site sides of the mirror planes. V is in square-pyramid coordination, and Ca is in seven fold coordination in both structures Both infrared and Raman spectra of plumbophyllite were reported in the original paper by Kampf et al.[2]. However, little interpretation of the spectra was given. Sengupta et al. reported the infrared spec-tra of some natural Indian zeolites including apophyllite[5]. Sido-rov[6]reported the Raman spectrum of apophyllite and identified Si2O25 ions in the structure and confirm the presence of these ions
in silicates with double rings and double chains or layers. Adams et al.[7]determined the single crystal Raman spectrum of an apo-phyllite mineral. Duval and Lecomte[8]used vibrational spectros-copy to determine the role of water in the apophyllite structure. Raman spectroscopy has proven very useful for the study of miner-als[3,9–11]. Indeed, Raman spectroscopy has proven most useful for the study of diagenetically related minerals as often occurs with minerals containing silicate groups such as plumbophyllite, apo-phyllite-(KF) and apophyllite-(KOH) [9,12–16]. The objective of this research is to report the vibrational spectra of plumbophyllite and to relate the spectra to the molecular structure of the mineral.
Experimental
Samples description and preparation
The plumbophyllite sample studied in this work forms part of the collection of the Geology Department of the Federal University of Ouro Preto, Minas Gerais, Brazil, with sample code SAC-091. The sample is from the Blue Bell mine, USA, type locality for the min-eral. It is noted that the sample used in this work is identical to that used by Kampf et al.[2].
The sample was gently crushed and the associated minerals were removed under a stereomicroscope Leica MZ4. The plumbo-phyllite studied in this work occurs in association with unidenti-fied clay mineral. Scanning electron microscopy (SEM) in the EDS mode was applied to support the mineral characterization.
Scanning electron microscopy (SEM)
Experiments and analyses involving electron microscopy were performed in the Center of Microscopy of the Universidade Federal de Minas Gerais, Belo Horizonte, Minas Gerais, Brazil (http:// www.microscopia.ufmg.br).
Plumbophyllite crystals were coated with a 5 nm layer of evap-orated carbon. Secondary Electron and Backscattering Electron
images were obtained using a JEOL JSM-6360LV equipment. Qual-itative and semi-quantQual-itative chemical analyses in the EDS mode were performed with a ThermoNORAN spectrometer model Quest and was applied to support the mineral characterization.
Raman spectroscopy
The crystals of plumbophyllite were placed and oriented on the stage of an Olympus BHSM microscope, equipped with 10and 50objectives and part of a Renishaw 1000 Raman microscope system, which also includes a monochromator, a filter system and a Charge Coupled Device (CCD). Raman spectra were excited by a HeNe laser (633 nm) at a nominal resolution of 2 cm 1 in
the range between 100 and 4000 cm 1. Details of the experimental
procedure have been published. The spatial resolution of the instrument is 1
l
m. Thus, if crystals are less than this value, a mixture of crystals will be measured. However, the crystals of plumbophyllite used in this experiment were >1.1l
m.It is noted that there is a spectrum of plumbophyllite on the RRUFF data base. The spectrum has been downloaded and is given in the supplementary information for the purposes of comparison. It is noted that the spectrum differs from the work reported in this paper and also differs from the work reported by Kampf et al.[2]. Spectral manipulation such as baseline adjustment, smoothing and normalisation were performed using the Spectracalc software package GRAMS (Galactic Industries Corporation, NH, USA). Band component analysis was undertaken using the Jandel ‘Peakfit’ software package which enabled the type of fitting function to be selected and allows specific parameters to be fixed or varied accordingly. Band fitting was done using a Lorentz-Gauss cross-product function with the minimum number of component bands used for the fitting process. The Gauss–Lorentz ratio was main-tained at values greater than 0.7 and fitting was undertaken until reproducible results were obtained with squared correlations of r2greater than 0.995.
Results and discussion
Chemical characterization
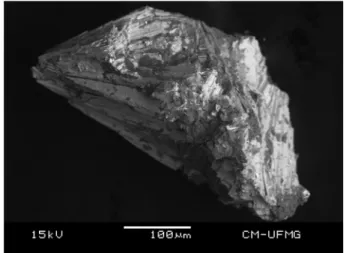
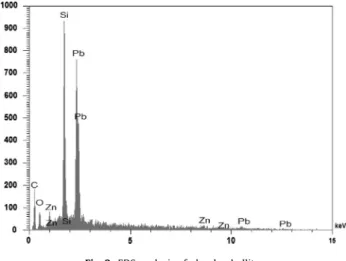
The SEM/BSI image of the plumbophyllite crystal fragment studied in this work is shown inFig. 1. The sample occurs in asso-ciation with unidentified clay mineral. A perfect cleavage can be observed. Qualitative chemical analysis of plumbophyllite shows a Pb silicate with minor amount of Zn (Fig. 2).
Vibrational spectroscopy of plumbophyllite
The Raman spectrum of plumbophyllite in the 4000–100 cm 1
spectral range is illustrated inFig. 3a. This spectrum displays the position and relative intensity of the Raman bands. It is notewor-thy that there are large parts of the spectrum where no Raman intensity is observed. Therefore, the spectrum is subdivided into sections based upon the type of vibration being analyzed. In a sim-ilar fashion, the infrared spectrum of plumbophyllite over the 4000–500 cm 1spectral range is reported inFig. 3b. This spectrum
shows the position and relative intensity of the infrared bands of plumbophyllite. A comparison between the Raman and infrared
spectra may be made. Because of the lack of intensity in the infra-red spectrum between for example 3000–2000 cm 1 spectral
range, the spectrum is subdivided into sections based upon the type of vibration being studied. A comparison may be made with the published spectra of Kampf et al.[2]. A comparison may also be made with the spectrum downloaded from the RRUFF data base. The Raman spectrum of plumbophyllite over the 1200– 900 cm 1 spectral range is shown in Fig. 4a. The spectrum is
dominated by an intense Raman band at 1027 cm 1. In the work
published by Kampf et al. [2], the peak was located at 1025 cm 1. In this work, the spectra were curve fitted, in the work
of Kampf et al., the spectra were simply taken as the as produced spectrum. Essentially, the two sets of data (this work and the work of Kampf are the same). There is a spectrum of plumbophyllite published in the RRUFF data base. No band was found at 1027 cm 1 in the RRUFF data base (please see the spectrum in
the supplementary information). The spectrum of plumbophyllite in this work, together with the spectrum of Kampf et al.[2]is very different to that published on the RRUFF data base. This work brings into question the spectrum of plumbophyllite published on the RRUFF data base.
This band at 1027 cm 1is assigned to the SiO symmetric
stretching vibration of the (SiO3)nunits. A series of low intensity bands may be observed at 926, 956, and 972 cm 1. A second series
of low intensity Raman bands are observed at 1095, 1137 and 1153 cm 1. These bands are attributed to assigned to the SiO
anti-symmetric stretching vibration of the (SiO3)nunits. A comparison of the Raman spectrum may be made with the published paper by Kampf et al.[2]. A comparison may be made with the spectrum of apophyllite. The Raman spectrum of plumbophyllite shows a strong Raman band at around this position. An intense Raman band
Fig. 2.EDS analysis of plumbophyllite.
Fig. 3.(a) Raman spectrum of plumbophyllite over the 4000–100 cm 1spectral
range and (b) Infrared spectrum of plumbophyllite over the 4000–500 cm1
spectral range.
Fig. 4.(a) Raman spectrum of plumbophyllite over the 1400–800 cm 1spectral
range and (b) Infrared spectrum of plumbophyllite over the 1300–500 cm 1
is shown at around 1025 cm 1 in the spectrum of Kampf et al.
However, it is difficult to make and comparison without the defin-ing of the peak positions.
There is a strong resemblance between the structure of plumbophyllite and the apophyllite minerals. The infrared spec-trum of plumbophyllite over the 1250–650 cm 1 spectral range
is shown inFig. 4b. The spectrum is complex with many overlap-ping bands. A broad spectral feature is observed at around 966 cm 1. All of these bands between say 850 and 1250 cm 1are
attributed to SiO antisymmetric stretching vibration of the (SiO3)nunits. An intense band for apophyllite is observed at around 1000 cm 1 and it may be decomposed into component bands at
963, 1005 and 1042 cm 1. Two sharp bands are observed at 1093
and 1120 cm 1. Two infrared bands are observed at 762 and
790 cm 1. These bands are assigned to theE
umode. Kampf et al. [2] showed infrared peaks at shows prominent features at 958, 771, 711, 640, 499, 465, and 439 cm–1. Kampf et al. attributed these
infrared bands in the main to silicate peaks without defining the assignment of these peaks.
Kampf et al.[2]suggested that there was a similarity between the structure of pentagonite and plumbophyllite. The structure of plumbophyllite is based upon silicate sheets consisting of zigzag pyroxene-like (SiO3)nchains joined laterally into sheets with the unshared tetrahedral apices in successive chains. Many phyllosili-cates are based on six-member rings. The Raman spectrum of apophyllite-(KF) is dominated by a very intense sharp peak at 1059 cm 1. Dowty showed that the –SiO
3units had a unique band
position of 980 cm 1[17](see Figs. 2 and 4 of this reference).
Dow-ty also showed that Si2O5 units had a Raman peak at around
1100 cm 1. Apophyllite-(KF) consists of continuous sheets of
Si2O6parallel to the 001 plane. The band at 1059 cm 1is assigned
to the SiO stretching vibration of these Si2O6units. Adams et al.[7]
reported the single crystal Raman spectrum of apophyllite. Adams and co-workers reported the factor group analysis of apophyllite. Based upon Adams[7]assignment this band is the A1gmode. It
is predicted that there should be three A1gmodes. However, only
one is observed, perhaps because of accidental coincidence. Narayanan[18]collected the spectrum of an apophyllite mineral but did not assign any bands. Raman bands of significantly lower intensity are observed at 970, 1007, 1043, 1086 and 1114 cm 1.
The Raman bands at 1043, 1086 and 1114 cm 1are assigned to
theA2umodes. Vierne and Brunel[19]published the single crystal
infrared spectrum of apophyllite and found the two A2modes, at
1048 and 1129 cm 1. The significance of this observation is that
it shows that both the Si–O bridge and terminal bonds yield stretching wavenumbers at comparable positions. The Raman spectrum of apophyllite-(KF) from South Africa shows an intense band at 1059 cm 1 with bands of lower intensity at 1007, 1088
and 1114 cm 1. The band at 846 cm 1is assigned to a water
libra-tional mode. The Raman spectrum of the apophyllite-(KOH) displays an intense band at 1057 cm 1with bands of lower
inten-sity at 851, 969, 1007 and 1113 cm 1. The band of
apophyllite-(KOH) at 1059 cm 1is assigned to the SiO stretching vibration of
the Si2O6 units. The band at 851 cm 1 is assigned to the water
librational mode.
It is likely that the infrared bands in the spectrum of plumbo-phyllite at 769 and 797 cm 1are due to water librational modes
(Fig. 2b).
The Raman spectrum of plumbophyllite in the 700–300 cm 1
spectral range is shown inFig. 5a. The spectrum is dominated by an intense Raman band at 643 cm 1. In the paper by Kampf et al. [2], the band was found at 641 cm 1. Thus, there is excellent
agree-ment between the position of the bands reported in this work and that of Kampf et al.[2]. The spectrum of plumbophyllite given in the RRUFF data base does not show a peak in this position. It does show a very low intensity band at 625 cm 1. The spectrum of
plumbophyllite in this work, together with the spectrum of Kampf et al. is very different to that published on the RRUFF data base. This work brings into question the spectrum of plumbophyllite published on the RRUFF data base. This band at 643 cm 1is
as-signed to OSiO bending vibrations of the (SiO3)n units. Raman bands of low intensity are observed at 485, 500 and 506 cm 1.
These bands are assigned to the flexing vibrations of the (SiO3)n sheets. A comparison of the Raman spectrum may be made with the published paper by Kampf et al.[2]. The Raman spectrum of plumbophyllite shows a strong Raman band at around this posi-tion. However, it is difficult to make and comparison without the defining of the peak positions. Raman bands at 309, 332, 349, 381 cm 1and others in this spectral region are attributed to PbO
stretching vibrations.
Raman bands for apophyllite are found at 431, 583 and 663 cm 1. These bands are assigned to OSiO bending modes. There
are many more bands observed in the spectra shown inFig. 3a than is required from theory. Raman bands of apophyllite are observed at 337, 373, 462, 485, 511, 538 cm 1in the region below 550 cm 1.
Dowty calculated the band position of these bending modes for different siloxane units[17]. Dowty demonstrated the band posi-tion of the bending modes for SiO3units at around 650 cm 1. This
calculated value is in harmony with the lower wavenumber band observed at 643 cm 1 for plumbophyllite. According to Adams
et al.[7]the band at 432 cm 1is due to the coincidence of both
theB2gandEgmodes.
The Raman spectrum of plumbophyllite in the far low wave-number region is reported inFig. 5b. An intense Raman band is ob-served at 147 cm 1with Raman bands of lesser intensity at 112,
182 and 253 cm 1. These bands are described simply as lattice
vibrations. For the apophyllite mineral, quite intense Raman bands
Fig. 5.(a) Raman spectrum of plumbophyllite over the 800–300 cm 1spectral
range and (b) Raman spectrum of plumbophyllite over the 300–100 cm1spectral
are observed at 106, 132, 161, 155, 209, 228 and 266 cm 1. Strong
Raman bands were also reported by Adams et al.[7]in the single crystal Raman spectrum of apophyllite in this spectral region. Adams et al. showed the orientation dependence of the spectra. Bands in these positions are due to framework vibrations and prob-ably also involve water. The intense band at 209 cm 1may involve
hydrogen bonding of water. However until the Raman spectrum of deuterated apophyllite is measured, then no firm conclusion can be made. Raman bands are observed for the apophyllite-(KOH) at 106, 121, 134, 163, 185, 203, 236 and 254 cm 1.
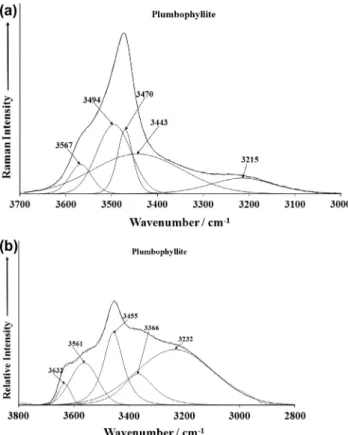
Both the Raman and infrared spectra as illustrated in Fig. 3, clearly show the presence of OH stretching vibrations. The Raman spectrum of plumbophyllite over the 3000–3700 cm 1 spectral
range is shown inFig. 6a. This spectrum displays a broad spectral profile and component bands may be resolved at 3215, 3470, 3494 and 3567 cm 1. In the work of Kampf et al., Raman bands
were noted at 3209, 3338, 3468 and 3561. The results of our work are in excellent agreement with the work of Kampf et al. The differ-ences in peak position may be simply due to the peak fitting of the Raman bands in this work. In the Raman spectrum of plumbophyl-lite downloaded from the RRUFF data base, peaks were located at 2675, 3022, 3192, 3346, 3457 and 3700 cm 1. There does not
ap-pear to be much correspondence between the peak positions ob-served in this work with those of the RRUFF data base spectrum. This work together with the work of Kampf et al. brings into ques-tion the validity of the spectrum of plumbophyllite from the RRUFF data base. The formula of plumbophyllite Pb2Si4O10H2O is such
that one water molecule is noted per formula unit. The above bands at 3215, 3470, 3494 and 3567 cm 1are attributed to the
stretching vibrations of water. The observation of multiple water stretching vibrations indicates that water is in different molecular environments with different degrees of hydrogen bonding. The Ra-man band at 3215 cm 1is indicative of strong hydrogen bonding
whereas the band at 3567 cm 1 is indicative of weak hydrogen
bonding. Kampf et al.[2]also suggested that there were two inde-pendent water molecules in the structure of plumbophyllite which are oriented perpendicular to thebaxis.
The infrared spectrum of plumbophyllite is displayed inFig. 6b. Infrared bands may be resolved at 3232, 3366, 3455, 3561 and 3632 cm 1 and are assigned to water stretching vibrations. The
number and complexity of the infrared spectrum in the water stretching region is reflected in the water bending region (Fig. 7). The spectrum shows complexity and infrared bands may be re-solved at 1607, 1627, 1659 and 1686 cm 1. The position of these
bands shows that water is involved in the structure of plumbo-phyllite with different hydrogen bond strengths.
A comparison may be made with the spectra of plumbophyllite and apophyllite. Overall two features are observed for apophyllite, namely bands due to water stretching vibrations and hydroxyl stretching bands. It is noted that the hydroxyapophyllite Raman spectrum has two OH stretching bands. The Raman spectrum of the apophyllite from India shows a complex set of bands which may be resolved into component bands at 2813, 2893, 3007, 3085 and 3365 cm 1. These bands are attributed to water
stretch-ing vibrations. Neutron diffraction studies have shown that water is hydrogen bonded to the silicate framework structure [20]. In the model of Prince[20] approximately one-eighth of the water molecules are replaced by OH and the remaining protons bonded to fluoride to form HF molecules. Both OH and H2O are hydrogen
bonded to the silicate framework. Bartl and Pfeifer[21]presented a model of apophyllite in which some hydroxyl units are replaced by fluoride ions. This model seems more appropriate as the sizes of F and OH ions are very close. There are many examples in nature where in minerals the OH units are either completely or partially replaced by F ions. Different hydrogen bond strengths are ob-served. The intense band at 3557 cm 1and a low intensity band
at 3626 cm 1are assigned to the stretching vibrations of the OH
units. In contrast, the Raman spectrum of the fluorapophyllite from South Africa shows an extremely intense band at 3557 cm 1which
is attributed to the OH stretching vibration. Because the intensity of this band is so high, it makes the intensity of the water bands appear low. Water bands are found at 2848, 3009, 3098 and 3430 cm 1. The difference between the two apophyllite-(KF)
mineral samples may be due to the amount of OH substitution by F ions. Based upon the intensity of the Raman peaks, it appears that there is a lot more OH in the South African sample. In the apo-phyllite-(KOH) sample from Arizona, two OH stretching vibrations are observed at 3563 and 3625 cm 1. It is proposed that the
differ-ence between apophyllite-(KF) and apophyllite-(KOH) is the obser-vation of two bands in the OH stretching region at around 3563
Fig. 6.(a) Raman spectrum of plumbophyllite over the 4000–2600 cm 1spectral
range and (b) Infrared spectrum of plumbophyllite over the 4000–2600 cm1
spectral range.
and 3625 cm 1. The Raman spectrum of the water stretching
re-gion also shows considerable complexity as was observed for the first two apophyllite samples. Water stretching bands are observed at 2812, 2974, 3062, 3212 and 3357 cm 1. Chukhrov et al.[22]
determined the nature of water in apophyllites and showed the water was in a highly crystalline state.
Conclusions
The studied sample is composed by mainly composed by Si and Pb, with minor amounts of Zn in substitution to lead. Unidentified clay mineral also occurs in association with plumbophyllite. The molecular structure of the silicate mineral plumbophyllite has been studied using Raman and infrared spectroscopy. The struc-ture consists of undulating sheets of silicate tetrahedra between which are located Pb atoms and channels containing H2O. The
sil-icate sheets can be described as consisting of zigzag pyroxene-like (SiO3)nchains joined laterally into sheets with the unshared tetra-hedral apices in successive chains pointed alternately up and down, a configuration also found in apophyllite and pentagonite.
Raman and infrared bands are assigned to the stretching and bending vibrations of the (SiO3)nunits. Complexity is found in both the Raman and infrared spectra of the OH stretching region. Multi-ple bands may be resolved in these spectra; thus, water in differing molecular environments is proposed.
Acknowledgements
The financial and infra-structure support of the Discipline of Nanotechnology and Molecular Science, Science and Engineering Faculty of the Queensland University of Technology, is gratefully acknowledged. The Australian Research Council (ARC) is thanked for funding the instrumentation. The authors would like to
acknowledge the Center of Microscopy at the Universidade Federal de Minas Gerais (http://www.microscopia.ufmg.br) for providing the equipment and technical support for experiments involving electron microscopy. The authors are also grateful to CNPq Project 402852/2012-5.
Appendix A. Supplementary data
Supplementary data associated with this article can be found, in the online version, athttp://dx.doi.org/10.1016/j.saa.2014.02.181.
References
[1]A.R. Kampf, R.M. Housley, Am. Mineral. 96 (2011) 423–429.
[2]A.R. Kampf, G.R. Rossman, R.M. Housley, Am. Mineral. 94 (2009) 1198–1204. [3]R.L. Frost, Y. Xi, Spectrochim. Acta A95 (2012) 263–269.
[4]H.T. Evans Jr., Am. Mineral. 58 (1973) 412–424.
[5]S.K. Sengupta, A.K. Chakravarty, G.C. Maiti, Fertilizer Technol. 20 (1983) 52–54. [6]T.A. Sidorov, Zh. Neorg, Khim 52 (2007) 1688–1696.
[7]D.M. Adams, R.S. Armstrong, S.P. Best, Inorg. Chem. 20 (1981) 1771–1776. [8]C. Duval, J. Lecomte, J. Chim. Phys. 50 (1953) C64–C71.
[9]R.L. Frost, Y. Xi, R. Scholz, A. Lopez, F.M. Belotti, J. Mol. Struct. 1042 (2013) 1–7. [10]R.L. Frost, Y. Xi, Spectrochim. Acta A91 (2012) 324–328.
[11]R.L. Frost, Y. Xi, J. Mol. Struct. 1028 (2012) 200–207.
[12]R.L. Frost, A. Lopez, Y. Xi, R. Scholz, L. Gandini Antonio, Spectrochim. Acta A118 (2014) 987–991.
[13]R.L. Frost, Y. Xi, R. Scholz, R.M.F. Lima, L.F.C. Horta, A. Lopez, Spectrochim. Acta A115 (2013) 376–381.
[14]R.L. Frost, Y. Xi, J. Therm. Anal. Calorim. 112 (2013) 615–619. [15]R.L. Frost, Y. Xi, J. Mol. Struct. 1018 (2012) 72–77.
[16]R.L. Frost, Y. Xi, Spectrochim. Acta A89 (2012) 88–92. [17]E. Dowty, Phys. Chem. Miner. 14 (1987) 80–93. [18]P.S. Narayanan, Curr. Sci. 20 (1951) 94–95.
[19]R. Vierne, R. Brunel, Bull. Soc. France Mineral. Crist. 92 (1969) 409–419. [20]E. Prince, Am. Mineral. 56 (1971) 1241–1249.
[21]H. Bartl, G. Pfeifer, Fortschr. Mineral. 53 (1975) 3.