Printed in Brazil - ©2007 Sociedade Brasileira de Química 0103 - 5053 $6.00+0.00
A
r
ti
c
le
*e-mail: [email protected]
Self-organizing Maps in Chemotaxonomic Studies of Asteraceae:
a Classification of Tribes using Flavonoid Data
Vicente P. Emerenciano,* Karina O. Barbosa, Marcus T. Scotti and Marcelo J.P. Ferreira
Instituto de Química, Universidade de São Paulo, CP 26077, 05513-970 São Paulo-SP, Brazil
Flavonóides são considerados bons marcadores químicos da família Asteraceae. Nesse artigo 4700 ocorrências de flavonóides (cerca de 800 substâncias) foram utilizadas em um sistema especialista desenvolvido para estudos taxonômicos. Através do uso de Mapas Auto-Organizáveis foram estabelecidas relações filogenéticas entre as subfamílias e as tribos de Asteraceae, as quais foram classificadas com base no número de ocorrências e nos padrões de oxidação de flavonóides. Os resultados obtidos permitiram a diferenciação das duas subfamílias de Asteraceae a correlação de tribos na subfamília Cichiroideae de acordo com a árvore topológica proposta por Karis o agrupamento de tribos de acordo com a árvore baseada em dados de CpDNA proposta por Jansen e separar as subtribos de Asteroideae bem como as tribos de acordo com o grau de metoxilação x glicosilação de flavonóides. A partir desses resultados pode-se afirmar que o método descrito com dados químicos pode ser utilizado como uma ferramenta complementar na classificação de plantas.
Flavonoids have shown good chemical markers for Asteraceae. In this paper, 4,700 occurrences of flavonoids (about 800 compounds) were considered in an expert system developed for taxonomic purposes. Through the use of Self-Organizing Maps (SOM) phylogenetic relationships among the subfamilies and tribes of Asteraceae were established. These taxa were classified on the basis of their occurrences and oxidation patterns of the flavonoids. The obtained results show the separation between the two subfamilies of Asteraceae the correlation among the tribes of the Cichiroideae subfamily according to the topological tree proposed by Karis the clustering of the tribes according to the tree proposed by Jansen based on CpDNA and the separation of the tribes classified in the Asteroideae subfamily as well as the tribes based on the methoxylation x glycosylation level in flavonoids. From these results one can affirm that the method applied with chemical data can be used as a complementary tool in plant classification.
Keywords: Asteraceae, flavonoids, chemotaxonomy, self-organizing maps
Introduction
The sunflower family (Asteraceae) is one of the largest and most successful flowering plants families, consisting of approximately 1100 genera and 25000 species. The tribes of this family show many interesting properties and are very well studied which consequently generated a large amount of data available in the literature.1-10 In addition,
the family is morphologically and ecologically diversified in such a complex way that many the genera are ill-defined, and the traditional arrangement of the genera into tribes may not be natural in all respects.
Cassini11 was the first to divide the Asteraceae into 19 tribes
and the first to suggest their natural relationships. Significant
early contributions were also made by Bentham12 and by
Cronquist13 who placed Heliantheae at the base of his 12
recircumscribed tribes. Hoffmann14 recognized two distinct
lineages with the Asteraceae: the Liguliflorae, in which he placed the single tribe Lactuceae; and the Tubuliflorae (= Asteroideae in recent classifications). Subsequent authors have continued to recognize two lineages within the family, but their circumscriptions have differed dramatically.
Beginning in the late 1980s, the discovery and subsequent analysis of a phylogenetically informative inversion in the cpDNA of Asteraceae15 in addition to the
morphological work by Bremer,16 demonstrated that it is
The effort of establish affinities among the groups in the family, several contributions have shown the importance of chemical data in the resolution of taxonomic problems in various hierarchical levels.17-19 In this way,
flavonoids have a wide structural diversity, diffuse occurrence, chemical stability20 and have been isolated in
great scale from Asteraceae species, they can be used as taxonomic markers at lower hierarchical levels.21
The basic flavonoid structure possesses 15 carbon atoms arranged in two aromatic rings connected by a linear chain of three carbon atoms. This structure generally can be found as a flavan nucleus arranged in three rings represented by the system C6-C3-C6, which are labeled A, B and C (Figure 1). The chromane system (rings A and C) maintains the second aromatic cycle (ring B) in the position 2, 3 or 4. The various types (or skeletons) of flavonoids differ in the level of oxidation and pattern of substitution of the C ring, while individual substances within a class differ in the pattern of substitution of the A and B rings. Among the many types of flavonoids, those of particular interest are flavanones, flavones, flavonols, flavan-3-ols, anthocyanidins, isoflavones, chalcones, dihydrochalcones, dihydroflavonols and aurones due to the variety of substances and the diversification of the pattern of substitution such as C- and O-methyl, C- and O-glycosil, C- and O-prenyl.20
The aim of this paper is to classify tribes and subtribes of Asteraceae considering the presence or absence of several chemical types of flavonoids with different oxidation levels and pattern substitutions using Self-Organizing-Maps (SOM) developed by Kohonen.22
Artificial Neural Networks
Artificial Neural Networks (ANNs) are functions with adjustable or tunable parameters. They are distributed in parallel systems composed of simple processing units capable of modeling extremely complex functions. They learn by examples, that is gathering representative data and them invoke training algorithms to automatically learn the structure of the data.23 During the learning process,
two forms of training are possible: supervised and non supervised.
To simulate the biological neuron system, an artificial neuron receives a number of inputs. Each input comes via a connection which has a weight that corresponds to synaptic efficacy in a biological neuron. In the supervised case, the network learns to transform an input pattern into an output pattern. The synaptic weights are modified in order to minimize the error, i.e. the difference between the sought after output and that calculated by the network. Generally, many learning cycles (presentation of an input pattern, calculation of the outputs and corrections of the weights) are necessary for the network to converge toward a solution. The advantage of this technique is its generalization and its predictability. When applying a new input pattern not previously included in the learning set, the network is capable, under certain conditions, of to calculate a new valid output. The most representative model of this class is the multilayer perceptron (MLP), in which the neurons are placed in several successive layers. This network is also called “back-propagation” due to how the error is fed back through the network.23,24
In network, when the learning algorithm is unsupervised, or in other words, when the patterns are applied without specifying the desired output, the network must build its own internal representation based on the similarities among the different input patterns. One way of doing this is to use a neural network as a projection method. We can consider the descriptors used to represent the objects as coordinates of a space. The objects may be found in various clusters in the high dimensional space.
An unsupervised ANN is then used to project the points from the high-dimensional space into a space with a smaller number of dimensions such as a two dimensional plane. The purpose of this projection is to preserve as well as the possible the topology of the high-dimensional space, such as the clustering of the objects, after projection into the low-dimensional space.25
The clusters may be associated with different types of properties which can then be identified after projection. It should be emphasized, however, that no knowledge on such properties is used in determining the projection by training the neural network. This is the essence of unsupervised learning.
One such unsupervised learning method is the self-organizing neural network introduced by Kohonen22 and
it is the neural network which probably has the closest analogy to some of the information processing in the brain, particularly as concerns the generation of sensory maps. The neurons of a Kohonen network are usually arranged in a two dimensional layer, each neuron containing a certain number of weights. An object, a sample, represented by their descriptors is sent into a
two-Figure 1. Basic flavonoid structure.
O
A C
B
8
5 4
2 1' 5'
dimensional network of neurons. An object will be mapped in to that neuron that has weights most similar to the descriptors of the input object. This neuron is called the central or winning neuron. A new object input is into a Kohonen network will be mapped into a neuron whose distance from the previously winning neuron is dependent on the similarity of the two objects. If the two objects have very similar descriptors they will be mapped into the same or closely adjacent neurons.22
One of the most important advantages of a Kohonen network is that it can generate maps and, thus, visualize relationships of objects. Kohonen’s algorithm achieves this goal by the association of two processes: (i) identification and stimulation on the map of the neuron which is the most sensitive to the current input; (ii) spreading of its activity among other spatially close cells.
The Self-Organizing-Maps (SOM) has cluster analysis characteristics similar to those of more classical algorithms such as k-means22 or non linear mapping.26 As opposed to
the multilayer perceptron, the SOM has relatively little been used in chemistry27-29 and mainly little been used in
the chemistry of natural products.30,31
The advantage of using ANNs is associated to the fact that they can learn and connect information which is extremely important in chemistry where the relationship between cause and effect has not known yet.25,32,33 In
contrast to the traditional statistical methods, ANNs are not only restricted to linear correlations or linear spaces. Consequently, ANNs can be applied in problems involving classification (identification of objects), prediction (modeling of functional correlation) and visualization (reduction of dimensions) of chemical data.31,34-38 In this
paper we used the ANN method with the flavonoid data to classify tribes and subtribes of the Asteraceae family and to compare with the classification of the family proposed by Bremer.7
Experimental
The database
The classifications proposed by Bremer7 and Jansen2
and coworkers were used in this paper to assign genera into subtribes and tribes. A database was built from data compiled from literature20 and updated from all the
subsequent specialized literature. The collected compounds were recorded with the names of tribes, subtribes, genera and species.
According to Bremer7 the family Asteraceae is divided
in four subfamilies: Barnadesioideae, Carduoideae, Cichorioideae and Asteroideae (Table 1) and 17 tribes assigned as: Barnadesieae (BAR), Mutisieae (MUT), Cardueae (CAR), Lactuceae (LAC), Vernonieae (VER), Liabeae (LIA), Arctoteae (ARC), Inuleae (INU), Plucheeae (PLU), Gnaphalieae (GNA), Calenduleae (CAL), Astereae (AST), Anthemideae (ANT), Senecioneae (SEN), Helenieae (HEL), Heliantheae (HLT) and Eupatorieae (EUP).
The large number of isolated flavonoids required the use of a computer-assisted method to store and recover data with similar methodology used in the study of diterpenes from Asteraceae.39 When each flavonoid
occurrence is included into a computer program, this automatically searches in database for the corresponding tribe’s name and recorded the all information related to
Table 1. Subdivision of the Asteraceae family according to Bremer’s classification
Tribe Code Subfamily No. of species No. of species in the database
Barnadesieae BAR BAR 92 29
Mutisieae MUT ? 318 134
Cardueae CAR CAR 2513 161
Arctoteae ARC CIC 139 30
Lactuceae LAC CIC 2486 184
Liabeae LIA CIC 159 18
Vernonieae VER CIC 1346 217
Anthemideae ANT AST 1737 572
Astereae AST AST 2846 412
Calenduleae CAL AST 113 38
Eupatorieae EUP AST 2396 512
Gnaphalieae GNA AST 1728 185
Helenieae HLN AST 835 306
Heliantheae HLT AST 2449 731
Inuleae INU AST 480 230
Plucheeae PLU AST 220 30
Senecioneae SEN AST 3247 263
Total 23104 4052
tribes, subtribes, genera and species as well as the bibliographic reference.
It is important to mention that the occurrences are obtained by counting how many times a compound of a given chemical class was reported in each species of the different tribes. For example, if the database contains, for two different species of the same tribe i, m compounds belonging to the chemical class j for the first species and n compounds of the same chemical class, the number of occurrences Oi,j in the tribe i is the sum corresponding to m + n. If a unique compound is isolated from two different species of the same tribe, it was counted twice. The percentage analysis of data for each genus is of prime importance since it indicates the relevance of each chemical class for such a taxon. Consequently, the database generated a matrix containing tribes, subtribes, genera and species (rows) and the different oxidation and patterns substitutions (columns). Having constructed a matrix, a new approach is performed. One vector (input) that described the variations of the occurrence numbers involved binary variables were created to indicate, in an heuristic manner, if a genus showed a very high probability (value = 1) or no probability (value = 0) of presenting the respective flavonoid type. So it was attribute the value 1 if the occurrence number was considered greater or equal 1, and zero if the value of the occurrence number was equivalent to zero.
Unsupervised training
The unsupervised training were performed using the second version of the SOM Toolbox for Matlab computing environment by MathWorks, Inc.40,41 The toolbox contains
functions for creation, visualization and analysis of Self-Organizing Maps. The training was conducted through the Batch-training algorithm. In this algorithm, the whole dataset is presented to the network before any adjustment is done. In each training step, the dataset is partitioned according to the regions of the map weight vectors.
The set of data is divided according to the data that intends to classify. During the process of a self organized map two phases are necessary: the training and the test phases. This last one is extremely important because after several cycles of training there must be a trend between the learning of the network and its ability of prediction that is verified in the results. The size of the test set (randomly selected) was always one tenth of the size of the training set, taking care that the test set contains representative samples of trained tribes.
Training and test performance are evaluated by computing the ratio of the number of samples correctly
classified by SOM. The neural network was trained on a Pentium IV HT 3.0 GHz with 1.0 GB of RAM.
Results and Discussion
Subfamilies Cichorioideae vs. Asteroideae
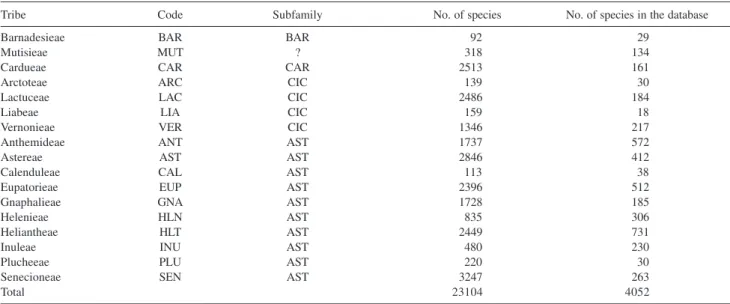
Our first attempt was to classify dichotomically using as inputs the flavonoid chemical data the two largest subfamilies of the Asteraceae: Cichorioideae and Asteroideae as described by Bremer.7 According to the
author the general and basal phylogeny is still unknown. The self organizing map obtained (Figure 2) shows that there is supremacy of the subfamily Asteroideae over the subfamily Cichorioideae in the production of flavonoids. During the training and test phases, the net had a hit percentual of 87% and 84%, respectively for classification of the subfamilies. However, an efficient separation between the two subfamilies was not very well verified because there are still signals of interaction between them. This fact can be explained considering that the SOM try to organize from patterns extracted from the dataset. Thus, if the dataset presents a diversity of characteristics, the process of auto-organization becomes complicated this generates interactions among the elements reflecting consequently in the maps.
Relationships among the Cichorioideae, Carduoideae and Barnadesioideae subfamilies
Asteraceae does not constitute a monophyletic group and the relationships among the members are not very well understood.7 Our next aim consisted in establish phylogenetic
relationships using the SOM for each one of the subfamilies. We started with the subfamilies Cichorioideae, Carduoideae and Barnadesioideae (Table 1).
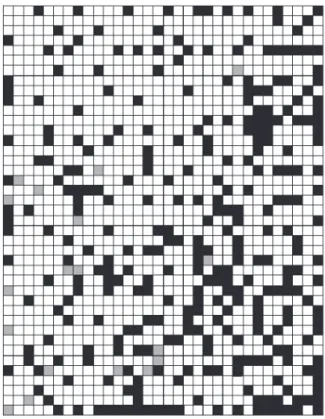
Figure 3 shows the topological map that classifies the tribes according to their characteristics. During the training and test phases the network had a percentual of hit of 77% and 72%, respectively which indicates its ability of prediction. From this map it is observed that the tribes Mutisieae, Cardueae and Vernonieae are closely according to Karis et al.4 which state that the family Cichorioideae
contains the three largest phylogenetic levels.
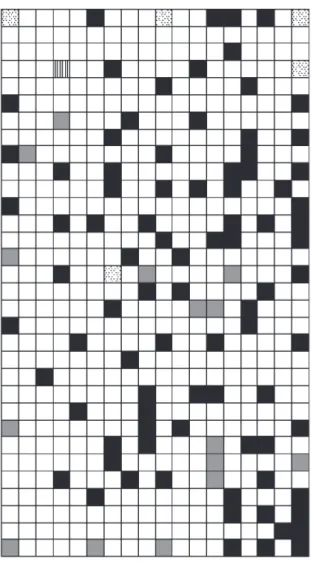
As the relationships among the elements of the subfamily Cichorioideae are uncertain several analyses involving hypotheses about them were investigated through Self-Organizing Maps. The tribe Mutisieae forms a paraphyletic group on the basis of the cladogram and contains the tribes Cardueae and Vernonieae as a group of sisters. Consequently, this topological map was constructed and investigated. So, the tribes Mutisieae, Cardueae and Vernonieae were grouped as one and the tribes Liabeae, Lactuceae and Barnadesieae separately. From this new topological map (Figure 4) can be verified that the tribes Mutisieae, Cardueae and Vernonieae are closely to the tribes Lactuceae and Liabeae. This fact reinforces the topological tree proposed by Karis et al.4
In this new configuration, the network had a percentual of hit of 81% and 74% in the training and test phases, respectively.
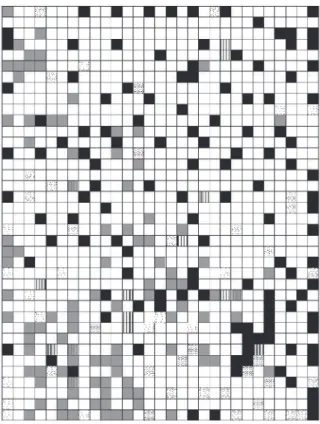
Figure 3. SOM demonstrating the relationships among the Cichorioideae, Carduoideae and Barnadesioideae subfamilies. Dots regions, gray regions, horizontal lines regions, black region and vertical lines regions: representing the Barnadesieae, Cardueae, Liabeae, Mutiseae and Vernonieae tribes, respectively.
Analysis of the tribes from the CpDNA tree and Rbcl sequences
Figure 5 shows the tribes Barnadesieae, Mutisieae and Cardueae, the tribes Vernonieae and Liabeae and the tribe Lactuceae were separated and generated a topological map that presents 80% in the learning phase and 63% in the phase test. From this map we have verified that the tribes Barnadesieae, Mutisieae and Cardueae are neighbor, the same occurring with the tribes Vernonieae and Liabeae. These observations are in agreement with the tree proposed by Jansen based on CpDNA.15
According to Karis et al.4 based on rbcl sequences, the
tribes Mutisieae and Vernonieae appear close in his cladogram. Considering this configuration, a new map (Figure 6) was obtained, which had a percentual of hit of 77% and 66% in the training and test phases. Analyzing this result one can be observed that the tribes Cardueae, Mutisieae and Vernonieae appear close in the topological map which suggests that these tribes form a monophyletic group of tribes.
Asteroideae subfamily
The relationships in the subfamily Asteroideae, which contain the tribes Inuleae, Plucheeae, Gnaphalieae, Calenduleae, Astereae, Anthemideae, Senecionae, Helenieae, Heliantheae and Eupatorieae, are uncertain as well in the subfamily Cichorioideae. In the Asteroideae subfamily the major variability of flavonoids has been observed.7,20 Besides that, some tribes of this subfamily
are not characterized by the presence of flavonoids for example, Plucheeae, Calenduleae and Senecionae. The maximum expression of diversity of flavonoids in Asteraceae has been seen in Anthemideae, Heliantheae, Heleniae and Eupatorieae which is consistent with the phylogeny proposed by Bremer7 that places the subfamily
Asteroideae in an advanced position.
Consequently, according to Bremer,7 the topological
map was constructed (Figure 7), which had a percentual
Figure 5. SOM obtained for the Cichorioideae subfamily in accordance with the subdivision of CpDNA tree. Dots regions and gray regions repre-sent the tribes Barnadesieae and Lactuceae, respectively; the tribes Mutisieae and Cardueae were grouped in black regions; the tribes Vernonieae and Liabeae were grouped in vertical lines regions.
of hit of 70% and 61% in the training and test phases respectively. Some tribes were grouped in this analysis such as the tribes Inuleae, Plucheeae and Gnaphalieae represented in the topological map as vertical lines regions; the tribes Astereae and Eupatorieae were grouped; Calenduleae and Senecionae are grouped; and Heliantheae and Helenieae were grouped. The tribe Anthemideae was analyzed separately. It is observed that the groups formed by the tribes Inuleae, Plucheeae and Gnaphalieae, Astereae and Eupatorieae appear next in the map the same occurring with the tribes Anthemideae, Heliantheae and Helenieae. These observations are in agreement with the morphological data of Bremer.16
Analysis of Asteroideae subfamily from the oxidation patterns
According to Harborne20 in studies about flavonoids,
there is a difference between the phenolic hydroxyl protection groups in angiosperms. According to Emerenciano42 that determined the advanced
evolutionary trends in the tribes of Asteraceae, there is a high degree of O-methyl protection for flavonoids
from the subfamily Asteroideae (tribes Eupatorieae, Anthemideae, Inuleae, Plucheeae and Astereae); in contrast with a moderate degree for tribes Helenieae, Heliantheae, Gnaphaliae, Cardueae, Liabeae and Senecioneae.
The authors in this work hold that the tribe Lactuceae is an interesting case, because it has chemistry relatively rich in highly glycosylated and poorly methylated flavonoids, the same occurs with the tribe Barnadesieae. The tribes Plucheeae and Eupatorieae show charac-teristics totally contrary which generated a topological map involving the four tribes (Figure 8), which had a percentual of hit of 91% and 90% in the training and test phases, respectively. Two regions were very well characterized in the map, the region represented by the tribe Eupatorieae and by the tribe Lactuceae. The tribes Plucheeae and Eupatorieae appear close in the map which can be attributed to the fact that these tribes have high degree of methyl protection and poor glycosylation that is consistent with Emerenciano et al.42 work.
Evolutionary trends among the tribes can be obtained from these results. It is possible to observe that the tribes Lactuceae and Eupatorieae are separated in the map which can be justified through cpDNA6 once that they
belong to different subfamilies.
Figure 7. SOM obtained for the Asteroideae subfamily. The tribes Inuleae, Plucheeae and Gnaphalieae were grouped and represented in vertical lines regions; the tribes Astereae and Eupatorieae were grouped in gray regions; Heliantheae and Helenieae were grouped and represented black regions; dots regions represent the Anthemideae tribe.
Conclusions
In this work was used the Self-Organizing Maps to establish phylogenetic relationships among the tribes of the family Asteraceae considering their oxidation patterns and several classes of flavonoids.
Firstly, the family was divided in two largest subfamilies: Cichorioideae and Asteroideae and the topological map was obtained. It was verified that the net could not classify satisfactorily the two subfamilies because the diversity of characteristics is very different from one group to another and this fact difficult the process of self-organization.
The next step was to treat the two subfamilies separately and the relationships among the tribes belonging to one of them were established. In case of subfamily Cichorioideae it was observed that the Self-organizing Maps were efficient and could be compared to the phylogenetic trees based on CpDNA data and Rbcl sequences.
In Asteroideae subfamily, that has a larger number of tribes and there is the major concentration of flavonoids, it was verified that the network could classify the subtribes according to Bremer’s classification based on morphological data. Analysis involving aspects of evolution in Asteraceae were performed and the network was able to classify four distinct tribes: Lactuceae and Barnadesieae, relatively rich in glycosylated flavonoids and poor in methylated flavonoids, and Plucheeae and Eupatorieae, rich in methylated flavonoids and poor in glycosylated flavonoids.
Therefore, the self Organizing Maps can classify automatically plants from chemical data such as oxidation patterns of flavonoids and can suggest the respective tribe which various genera could be classified.
In this paper it is demonstrated that the Self-organizing Maps developed by Kohonen can be used as powerful and complementary tool to the phytochemistry that searches for a classification of plants. Through this technique, that used just chemical data such as occurrences and oxidation patterns of flavonoids, it was possible to determine the tribe or subfamily which genera can be classified with at least 70% of probability.
Acknowledgments
The authors are grateful to FAPESP, CNPq and CAPES for their continuous fellowships and financial support.
References
1. Cronquist, A.; Brittonia1977, 29,137.
2. Jansen, R. K.; Holsinger, K. E.; Michaelis, H. J.; Palmer, J. D.;
Evolution1990, 44, 2089.
3. Bremer, K.; Jansen, R. K.; Karis, P. O.; Kallersjo, M.; Keeley, C.; Kim, H. J.; Palmer, J. D.; Wallace, R. S.; Nord. J. Bot.1992,
12, 141.
4. Karis, P. O.; Kallersjo, M.; Bremer, K.; Ann. Mo. Bot. Gard.
1992, 79, 416.
5. Xiaoping, Z.; Bremer, K.; Plant Syst. Evol.1993, 184, 259. 6. Karis, P. O.; Plant Syst. Evol.1993, 186, 69.
7. Bremer, K.; Asteraceae - Cladistics and classification, Timber Press: Oregon, 1994; Bremer, K. In Compositae: Systematics
Proceedings of the International Compositae Conference;
Hind, D. J. N.; Beentje, H. J. eds.; Royal Botanic Gardens: Kew, 1996, v.1.
8. Randall, J.; Starr, J. R.; Ann. Mo. Bot. Gard.1998, 85, 242. 9. Ito, M.; Watanabe, K.; Kita, Y.; Kawahara, T.; Crawford, D. J.;
Yahara, T.; J. Plant Res.2000, 113, 79; Ito, M.; Yahora, T.; King, R. M.; Watanabe, K.; Crawford, D. J.; J. Plant Res.2000,
113, 91.
10. Funk, V. A.; Bayer, R.; Keeley, S.; Chan, R.; Watson, L.; Gemeinholzer, B.; Schilling, E.; Panero, J.; Baldwin, B.; Garcia-Jacas, N.; Susanna, A.; Jansen, R. K.; Biol. Skr. Dan. Vid. Sel.
2005, 55, 343.
11. Cassini, H.; Opuscules Phytologiques, Strasbourg: Paris, 1826. 12. Bentham, G.; Bot. J. Linn. Soc.1873, 13, 335.
13. Cronquist, A.; Am. Midl. Nat.1955, 53, 478.
14. Hoffmann, O.; In Die Naturlichen Pfcanzenfamilien; Engler, A.; Prantl, K. eds.; Wilhelm Engelmann: Leipzig, 1894, ch. 2. 15. Jansen, R. K.; Palmer, J. D.; Proc. Natl. Acad. U.S.A.1987, 84, 5818; Keeley, S. C.; Jansen, R. K.; Syst. Bot.1991, 16, 173. 16. Bremer, K.; Cladistics1987, 3, 210.
17. Gershenson, J.; Mabry, T. J.; Nord. J. Bot.1983, 3, 5. 18. Hegnauer, R.; Phytochemistry1983, 25, 1519.
19. Waterman, P. G.; Gray, A. I.; Nat. Prod. Rep.1987, 4, 175. 20. Harborne, J. B.; Mabry, T. J.; Mabry, H.; The Flavonoids,
Chapman and Hall: London, 1975; Harbone, J. B.; Comparative
Biochemistry of the Flavonoids, Academic Press: New York,
1976; Harbone, J. B.; The Flavonoids: Advances in Research
since 1980, Academic Press: London, 1987; Bohm, B. A.;
Introduction to Flavonoids, Harwood Academic Publishers:
Amsterdam, 1998; Bohm, B. A.; Stuessy, T. F.; Flavonoids of
the Sunflower Family, Springer-Wien: New York, 2001.
21. Crawford, D. J.; Bot. Rev.1978, 44, 431.
22. Kohonen, T.; Biol. Cybern.1982, 43, 59; Kohonen, T.; Speech
Recognition Based on Topology Preserving Neural Maps,
Koogan: London, 1989; Kohonen, T.; Proceedings of IEE1990,
78, 1464; Kohonen, T.; Self-Organizing Maps – Series in
Information Sciences, 2nd ed., Springer Verlag: Heidelberg,
1997; Kohonen, T.; Neurocomputing1998, 21, 1.
23. Lawrence, J.; Introduction to Neural Networks Design, Theory
and Applications, 6th ed., Sylvia Luedeking: London, 1994.
24. Rumelhart, D. E.; McClelland, J. L.; Parallel Distributed
25. Zupan, J.; Gasteiger, J.; Anal. Chim. Acta1991, 248, 1; Gasteiger, J.; Li, X.; Simon, V.; Novic, M.; Zupan, J.; J. Mol.
Struct.1993, 141, 292; Gasteiger, J.; Teckentrup, A.; Terfloth, L.; Spycher, S.; J. Phys. Org. Chem.2003, 232, 16.
26. Lippmann, R. P.; IEEE ASSP Mag. 1987, 22, 4; Sammon, J.
W.; IEEE Trans1969, C18, 401; Kowalski, B. R.; Bender, C.
F.; J. Am. Chem. Soc.1972, 94, 5632.
27. Zupan, E.; Gasteiger, J.; Neural Networks for Chemists - An
Introduction, VHC-Verlag: Weinhein, 1993.
28. Melssen, W. J.; Smits, J. R. M.; Rolf, G. H.; Katerman, G.,
Chemom. Intell. Lab. Syst.1993, 195, 18.
29. Ferran, E. A.; Ferrara, P.; Biol. Cybern.1991, 451, 65; Ferran, E. A.; Ferrara, P.; Comput. Appl. Biosci.1992, 39, 8. 30. Givehchi, A.; Dietrich, A.; Wrede, P.; Schneider, G.; QSAR
Comb.Sci.2003,549, 22.
31. Da Costa, F. B.; Terfloth, L.; Gasteiger, J.; Phytochemistry2005,
66, 345.
32. Lacy, M. E.; Tetrahedron Comput. Method. 1990, 3, 119. 33. Brown, S. D.; Bear, R. S.; Blank, T. B.; Anal. Chem.1992, 64,
R22.
34. Fraser, L.; Mulholland, D. A.; Fraser, D. D.; Phytochem. Anal.
1997, 8, 301.
35. Schneider, G.; Wrede, P.; Prog. Byophys. Mol. Biol.1998, 70, 175.
36. Schwabe, T.; Ferreira, M. J. P.; Alvarenga, S. A. V.; Emerenciano, V. P.; Internet Electron. J. Mol. Des.2005, 4, 9. 37. Ferreira, M. J. P.; Brant, A. J. C.; Rufino, A. R.; Alvarenga, S. A. V.; Magri, F. M. M.; Emerenciano, V. P.; Phytochem. Anal.
2004, 15, 389.
38. Ferreira, M. J. P.; Brant, A. J. C.; Alvarenga, S. A. V.; Emerenciano, V. P.; Chem. Biod.2005, 2, 633.
39. Alvarenga, S. A. V.; Rodrigues, G. V.; Gastmans, J. P.; Emerenciano, V. P.; Nat. Prod. Lett. 1995, 7, 133.
40. Mathworks Inc., 2004, http://www.mathworks.com accessed in July 2005.
41. Vesanto, J.; Himberg, J.; Alhoniemi, E.; Parhankangas, J.; SOM
Toolbox for Matlab 5, 2005, http://www.cis.hut.fi/projects/
somtoolbox accessed in August 2005.
42. Emerenciano, V. P.; Ferreira, Z. S.; Kaplan, M. A. C.; Gottlieb, O. R.; Phytochemistry1987, 26, 3103.
Received: September 24, 2006
Web Release Date: July 24, 2007