Article
Printed in Brazil - ©2012 Sociedade Brasileira de Química0103 - 5053 $6.00+0.00
A
*e-mail: [email protected]
Comparison between GC-MS-SIM and GC-ECD for the Determination of Residues of
Organochlorine and Organophosphorus Pesticides in Brazilian Citrus Essential Oils
Andréa A. R. Alves,a Michelle J. C. Rezende,a Ana M. C. Hovell,a Humberto R. Bizzo,b
Ana Carolina L. Oliveira,c Silvana V. Rodriguesc and Claudia M. Rezende*,a
aInstituto de Química, Universidade Federal do Rio de Janeiro, Cidade Universitária, CT, Bloco A, 21941-909 Rio de Janeiro-RJ, Brazil
bEmbrapa Agroindústria de Alimentos, Guaratiba, 23020-470 Rio de Janeiro-RJ, Brazil
cInstituto de Química, Universidade Federal Fluminense, Campus do Valonguinho, 24220-900 Niterói-RJ, Brazil
Óleos essenciais cítricos brasileiros (mandarina, laranja, limão, bergamota e tangerina) foram analisados a fim de determinar resíduos de pesticidas organoclorados (aldrin, clordano, dieldrin e dicofol) e organofosforados (clorpirifós metílico, dimetoato, metidationa e paration metílico). Um estudo comparativo entre cromatografia gasosa acoplada a espectrometria de massas em modo de monitoramento seletivo de íons (CG-EM-MSI) e cromatografia gasosa com detector por captura de elétrons (CG-DCE) foi realizado usando extração em fase sólida (EFS) com fase Florisil®
para pré-concentração dos pesticidas. A recuperação média dos pesticidas foi de 71 a 83% por CG-EM-MSI e de 99 a 104% por CG-DCE. O limite de quantificação foi de 0,93 a 3,93 mg L-1
por CG-EM-MSI e de 0,09 a 0,12 mg L-1 por CG-DCE. Quinze amostras comerciais de óleos
essenciais cítricos brasileiros foram analisadas e seis amostras apresentaram contaminação com valores acima do limite máximo de resíduos (LMR) permitido pelo Codex Alimentarius.
Brazilian citrus essential oils (mandarin, orange, lemon, bergamot and tangerine) were analyzed for the determination of pesticides residues of organochlorine (aldrin, chlordane, dieldrin and dicofol) and organophosphorus (methyl chlorpyrifos, dimethoate, methidathion and methyl parathion) . A comparative study between gas chromatography-mass spectrometry in selective ion monitoring mode (GC-MS-SIM) and gas chromatography-electron capture detector (GC-ECD) was performed using solid phase extraction (SPE) with Florisil® cartridge for the pre-concentration of
pesticides. The average recovery of pesticides was from 71 to 83% as determined by GC-MS-SIM analysis and 99 to 104% by GC-ECD. The limit of quantification was from 0.93 to 3.93 mg L-1
in GC-MS-SIM and 0.09 to 0.12 mg L-1 in GC-ECD. Fifteen samples of commercial Brazilian
citrus essential oils were analyzed and six samples showed contamination with values above the maximum residue limit (MRL) allowed by the Codex Alimentarius.
Keywords: citrus essential oils, organophosphorus pesticides, organochlorine pesticides, GC-ECD, GC-MS-SIM
Introduction
Citrus essential oils (EOs) are extracted by cold-pressing the fruit pericarp and are important raw materials for cosmetic, pharmaceutical, food and cleaning product industries, among others.1 Due to environmental issues and
problems caused by pesticide poisoning, major efforts have been employed by several countries to control
these contaminants. Brazil, as an important agricultural producer and exporter, has been increasingly concerned with attending the international legislation regarding the presence of contaminants in food.2
The maximum amount of pesticide residue in food officially accepted for human or animal ingestion is called maximum residue limit (MRL). MRL is expressed by mg kg-1 or mg L-1, and is established by Codex Alimentarius
defined value of MRL for EOs per se. The residue control
of these products is based on MRL for citrus fruits. There are few investigations of pesticide residues in citrus EOs available in the scientific literature. Di Bella et al.4-8
investigated Italian citrus EOs from 1996 to 2004, and found 60 mg L-1 of chloroparaffin residue in lemon oil, above the
level allowed by the Codex Alimentarius (7.1 mg L-1).5 This
group also observed a dicofol contamination of 1.96 mg L-1
in mandarin EO and 0.20 mg L-1 of the same organochlorine
in bergamot EO.7 In 2004, a second study noted the
presence of pesticides, but now at levels below MRL.8
Moreover, Dellacassa et al.9 analyzed organochlorine and
organophosphorus residues in lemon EO from Uruguay. Contamination of methyl chlorpyrifos, methyl parathion, fenitrothion and methidathion was found in the EOs produced before 1993, but a strong reduction in the residues was observed after that year.9
These studies highlight the importance of the constant monitoring of pesticide residues in agricultural-based products, as well as the need for development of methodologies with higher sensitivity, precision and accuracy. Gas chromatography-mass spectrometry (GC-MS) and gas chromatography-electron capture detector (GC-ECD) are the most common and appropriate systems to investigate contaminants in food. Aramendia et al.10
compared the GC-MS/MS and GC-ECD methods in the analysis of triazines residues in olive oils. The authors showed the high sensitivity of GC-ECD for
organophosphorus and organochlorine pesticides.10 But
they pointed out, as a drawback, that the identification of the compounds obtained by comparison with standards, makes the quantification of the pesticides not very reliable due to matrix interferences.10 On the other hand,
gas chromatography-mass spectrometry in selective ion monitoring mode (GC-MS-SIM) provides excellent sensitivity and satisfactory quantification limits, allowing the identification and quantification of pesticides at low levels.10
The aim of this work is the validation of the GC-MS-SIM and GC-ECD methods and their comparison in the determination of residues of organochlorine and organophosphorus pesticides in Brazilian citrus EOs.
Experimental
Materials
Fifteen EOs from five different citrus species were purchased from three major Brazilian exporters (2008/2009).
The samples were stored at −20 °C. Pesticide standards
(Dr. Mark Ehrenstorfer GmbH, > 98%, Germany) and
Florisil® cartridges (J. T. Baker®, lot 7213-07, USA),
containing 1 g of adsorbent, were used.
Instrumentation and chromatographic conditions
GC-MS analyses were performed in a GC6850 gas chromatography coupled to a 5975C MSD Instrument (Agilent Technologies) with electron ionization at 70 eV. A HP5-MS capillary column (Agilent 19091S 433E) with a 0.25 mm i.d., 30 m and 0.25 µm phase film diameter was used. The carrier gas was helium at a flow of 1.0 mL min-1.
The temperature program was an isothermal period of 5 min at 50 oC, then increased to 150 oC at a rate of
20 oC min-1 and finally to 290 oC at a rate of 10 oC min-1
with a final isothermal period of 5 min. The run time was of 29 min and splitless mode was used. The injector and interface temperatures were held at 290 oC. All samples were
analyzed in SIM mode for quantification measurements and SCAN mode in the mass range of 50-400 u for confirmation of the spectral data.
GC-ECD analyses were performed in a GC2014 gas chromatography with electron-capture detector (model
ECD2014 AOC20) radioisotope Ni63 (Shimadzu). The
same HP5-MS capillary column with a 0.25 mm i.d., 30 m and 0.25 µm phase film diameter was used. The
carrier gas was nitrogen at a flow of 1.0 mL min-1.
The temperature program was the same reported for GC-MS-SIM. The injector temperature was held at 290 oC and splitless mode was used.
Standard stock solution
For GC-MS analyses, a standard stock solution of each pesticide was prepared by dissolving 1.0 mg of each pesticide in 1.0 mL of ethyl acetate (concentration 1000 mg L-1), in a volumetric flask. For GC-ECD analyses,
1.0 µL of the GC-MS stock solution was taken using automatic pipette and diluted in 1.0 mL of ethyl acetate (concentration 1 mg L-1). The stock solutions were stored
at −20 °C.
GC-MS pesticide fortified solution
A fortified solution was prepared by weighing 8 mg of
the EO, adding 40 mL of the 1000 mg L-1 stock solution
of each pesticide and diluting (in a volumetric flask) to 4.0 mL with ethyl acetate. This procedure was repeated for each one of the five EOs analyzed (mandarin, orange, lemon, bergamot and tangerine). The concentration of these solutions was 2000 mg L-1 of EO and 10 mg L-1 of
GC-ECD pesticide fortified solution
For GC-ECD analyses, the fortified solutions were
prepared by mixing 10 mL of the 2000 mg L-1 EO
solution and 10 mL of each diluted pesticide stock solution (1 mg L-1), the volume was then completed to 1.0 mL with
ethyl acetate. The concentration of these solutions was 20 mg L-1 of EO and 0.01 mg L-1 of each pesticide.
Internal standard solution
n-Pentacosane was used as internal standard (IS). The
stock solution was prepared by dissolving 1.0 mg of IS in 1.0 mL ethyl acetate (concentration 1000 mg L-1). The
solution was stored at −20 °C.
GC-MS calibration solutions
Five standard EO solutions for GC-MS-SIM analyses were prepared by mixing 1, 5, 10, 15 and 20 mL of each
1000 mg L-1 pesticide stock solution, 500 mL of orange
EO (EO 9) and the volume was completed to 1.0 mL with ethyl acetate, obtaining solutions with 1, 5, 10,
15 and 20 mg L-1, respectively. A volume of 200 mL of
the standard EO solution was transferred to the Florisil®
cartridge. The cartridge was pre-conditioned with 3 mL of acetone and the elution of 5 mL of pentane yielded the first fraction (F1). The second fraction (F2) was collected after the elution of 5 mL of ethyl acetate. The
elution was processed at 1 drop min-1 without pressure
apparatus. F1 and F2 fractions were dried under nitrogen
flow and resuspended with 5 mL of the 1000 mg L-1 IS
stock solution and completed to 50 mL with ethyl acetate. According to this procedure, the calibration graphs were built up with 4, 20, 40, 60 and 80 mg L-1 of pesticide and
IS at 100 mg L-1. Pesticide concentrations correspond to
2, 10, 20, 30 and 40 mg L-1 of pesticide in the original
EO, respectively.
GC-ECD calibration solutions
Organochlorine and organophosphorus pesticide standard solutions were prepared in the range of
50-150 µg L-1 for GC-ECD. The calibration curves were
constructed from five solutions of 50, 75, 100, 125 and 150 µg L-1 of each pesticide. A solution of 50 µg L-1 was
prepared with 50 mL of the 1 mg L-1 stock solution of
each pesticide and 10 mL of the 2000 mg L-1 EO solution,
the volume was then completed to 1.0 mL with ethyl acetate.
Commercial samples
Fifteen commercial samples of Brazilian citrus oils were analyzed. Six of the samples were orange EOs (EO 2, 4, 7, 9, 14 and 15), five were lemon (EO 1, 3, 5, 10 and 12), one was tangerine (EO 8), two samples were mandarin EOs (EO 6 and 11) and one bergamot (EO 13). For GC-MS-SIM analyses, solutions of 500 µL of each EO in 500 µL of ethyl acetate were prepared, and then a volume of 200 mL was extracted through a SPE Florisil® cartridge. The F1 fraction
was dried under nitrogen and resuspended with 5 mL of the 1000 mg L-1 IS stock solution and completed to 50 µL with
ethyl acetate. For the GC-ECD analysis, the same procedure was repeated but the F1 fraction was resuspended and completed to 100 µL with ethyl acetate. Then, 10 µL of this solution was completed to 1.0 mL with ethyl acetate.
Results and Discussion
Qualitative analysis of pesticides
GC-MS-SIM and GC-ECD chromatograms of the pesticide fortified solutions, in each type of EO (orange, lemon, tangerine, mandarin and bergamot), were obtained and the peak identifications were confirmed by injecting different concentrations of the pesticides. Table 1 presents the retention times (under the chromatographic conditions used) and the characteristic fragments selected for qualitative and quantitative determinations by GC-MS. The pesticide chlordane can present 26 isomers, but only areas of two peaks increased by the fortification of the EO. Figures 1 and 2 illustrate the GC-MS-SIM and GC-ECD chromatograms, respectively, of lemon EO (EO 1) fortified with standard pesticides. The pesticide Aldrin was not analyzed by GC-ECD.
After peak identification, pure essential oils were analyzed by GC-MS-SIM and GC-ECD. The purpose
Table 1. Retention times (tR) and selected characteristic ions for GC-MS
Pesticide tR / min Characteristic ions / m/z
Organochlorine aldrin 19.8 263, 265, 293 dicofol 19.9 197, 286, 314 chlordane 21.1, 21.4 237, 272, 373 dieldrin 21.9 139, 141, 250 Organophosphorus dimethoate 17.1 87, 125, 229
methyl parathion 18.8 109, 125, 153 methyl chlorpyrifos 19.8 237, 263, 345 methidathion 21.1 85, 145, 302
of this test was to detect compounds which could have the same retention time or the same ions chosen in the GC-MS-SIM method for the quantification of the
pesticides and n-pentacosane IS in the matrix. The
analyses showed that the EOs did not have compounds close to the retention time of the analytes or the internal standard. Thus, it was possible to affirm that the peaks
in these areas only correspond to the pesticides or the internal standard.
Evaluation of repeatability and recovery of solid phase extraction
Florisil® SPE cartridge was used for the concentration
of the analytes and clean-up of the matrix. Preliminary analyses showed that all the pesticides were in the F1 fraction, and the F2 fraction was discarded.
For the evaluation of repeatability, the standard EO solution with 10 mg L-1 of each pesticide was used. The
F1 fraction was dried under nitrogen flow and resuspended with 200 mL of ethyl acetate. This procedure was done in triplicate and each F1 solution was also injected in triplicate in GC-MS-SIM. In order to check the recovery
of pesticides on Florisil® SPE, the standard solution
containing 50 mg L-1 of each pesticide and IS (without
the EO) was first analyzed. The effect of the drying step in F1 was investigated analyzing nine repetitions with and without the nitrogen drying step. The response factor of each pesticide was calculated using concentrations and area data from three consecutive direct injections of the standard solution. The results are given in Table 2. The results indicate the good repeatability of the SPE procedure since all the relative standard deviation (RSD)
values were below 5%.11,12 The recovery values were
near 100% and were very similar, showing that the use of adsorbent and nitrogen drying step did not affect the pesticide analysis. The average recovery values of 96% for organochlorine and 95% for organophosphorus pesticides using Florisil® SPE are in agreement with values described
in the literature.13
The recovery of pesticides in the presence of EO matrix was also evaluated for the SPE procedure. The quantitative Figure 1. GC-MS-SIM chromatograms of the fortified lemon EO,
(a) organochlorine pesticides: aldrin, dicofol, chlordane and dieldrin and (b) organophosphorus pesticides: dimethoate, methyl parathion, methyl chlorpyrifos and methidathion.
Figure 2. GC-ECD chromatograms of the fortified lemon EO (upper
line) (a) organochlorine pesticides: dicofol, chlordane and dieldrin and (b) organophosphorus pesticides: dimethoate, methyl parathion, methyl chlorpyrifos and methidathion. The botton lines show the chromatogram of pesticide standard solutions for peak identification.
Table 2. Repeatabilities (n = 9) and recoveries of pesticides using SPE
Florisil® by GC-MS-SIM
Pesticide
Repeatability Recovery / %
R meana RSD / %b Without
drying
With drying
Aldrin 1.3 3.1 97 95
Chlordane 0.5 2.6 97 97
Dicofol 1.2 1.7 99 97
Dieldrin 1.3 3.9 95 93
Dimethoate 0.7 1.3 96 95
Methidathion 0.5 3.5 95 95
Methyl chlorpyrifos
1.5 2.7 97 96
Methyl parathion
1.1 3.2 95 94
analysis was done for the five types of EO used in this work. The results are summarized in Table 3, where low recovery was found. This low recovery was also obtained by González et al.14
using various matrices and this effect is caused by the increasing level of noise in GC-MS, resulting in a decrease of the integrated area of the analytes.14 So, it is noteworthy
that the matrix has to be used in the construction of the calibration curve in order to ensure accuracy of the results.
Quantitative analysis of pesticides
Only the orange EO (EO 9) was used to obtain a calibration curve. At first, because the recovery of pesticides in the matrices of the five EOs was very similar, as can be seen in Table 3, and secondly, it presented a smaller number of compounds, simplifying the measurement of different levels of the pesticides used.
In GC-MS-SIM, the calibration graphs were built up with five points in triplicate at 4, 20, 40, 60 and 80 mg L-1 of
pesticide and IS at 100 mg L-1. In GC-ECD, the calibration
graphs were constructed with five points in duplicate at
50, 75, 100, 125 and 150 µg L-1. Grubbs and Cochran15
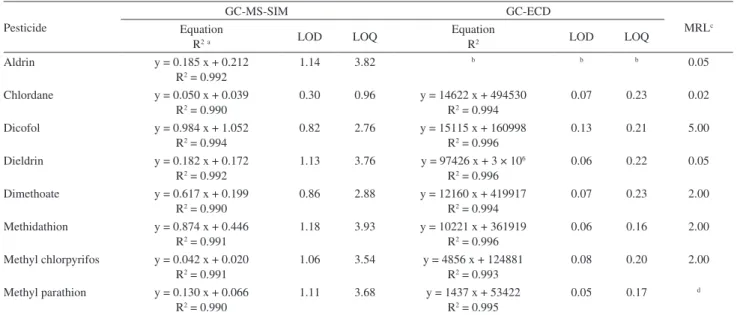
statistical tests were applied and none of the points was discarded. The standard calibration parameters are summarized in Table 4. The curves showed a good linear relationship between the instrumental response and the analyte concentration for both methods.
The GC-ECD showed higher sensitivity than GC-MS, even in SIM mode. In GC-MS-SIM and GC-ECD, the limits of detection (LOD) and quantification (LOQ) were calculated on the basis of a signal-to-noise ratio of 3:1 and
10:1, respectively.16,17 In GC-ECD, the LOD and LOQ
values are below or close to the values of MRLs, making easier the identification and determination of possible contaminations.
The precision and accuracy of the methods were evaluated using repeatability and recovery values, respectively. Both were calculated for the five concentrations of the calibration
Table 3. Recoveries of pesticides in each EO matrix
Pesticide EO 1 / % EO 8 / % EO 9 / % EO 11 / % EO 13 / %
Aldrin 65 64 62 60 62
Chlordane 56 53 51 55 55
Dicofol 72 73 73 74 72
Dieldrin 64 63 61 61 62
Dimethoate 58 55 57 56 57
Methidathion 55 52 53 54 53
Methyl chlorpyrifos 54 54 54 57 54
Methyl parathion 64 64 64 64 66
EO 1 (lemon), EO 8 (tangerine), EO 9 (orange), EO 11 (mandarin) and EO 13 (bergamot).
Table 4. Parameters of calibration equations
Pesticide
GC-MS-SIM GC-ECD
MRLc
Equation
R2a LOD LOQ
Equation
R2 LOD LOQ
Aldrin y = 0.185 x + 0.212 R2 = 0.992
1.14 3.82 b b b 0.05
Chlordane y = 0.050 x + 0.039 R2 = 0.990
0.30 0.96 y = 14622 x + 494530 R2 = 0.994
0.07 0.23 0.02
Dicofol y = 0.984 x + 1.052 R2 = 0.994
0.82 2.76 y = 15115 x + 160998 R2 = 0.996
0.13 0.21 5.00
Dieldrin y = 0.182 x + 0.172 R2 = 0.992
1.13 3.76 y = 97426 x + 3 × 10⁶
R2 = 0.996
0.06 0.22 0.05
Dimethoate y = 0.617 x + 0.199 R2 = 0.990
0.86 2.88 y = 12160 x + 419917 R2 = 0.994
0.07 0.23 2.00
Methidathion y = 0.874 x + 0.446 R2 = 0.991
1.18 3.93 y = 10221 x + 361919 R2 = 0.996
0.06 0.16 2.00
Methyl chlorpyrifos y = 0.042 x + 0.020 R2 = 0.991
1.06 3.54 y = 4856 x + 124881 R2 = 0.993
0.08 0.20 2.00
Methyl parathion y = 0.130 x + 0.066 R2 = 0.990
1.11 3.68 y = 1437 x + 53422 R2 = 0.995
0.05 0.17 d
graphs. The average RSD (%) value and the average recovery (%) for each pesticide are shown in Table 5. The RSD values were below 5% for all concentrations.11,12 The
recovery values obtained in the GC-MS-SIM varied from 71 to 83%. These results showed an acceptable recovery considering the effect of the matrix, as previously discussed. In GC-ECD, the recoveries were from 99 to 104%, which can be attributed to the high selectivity of the electron capture detector for organochlorine and organophosphorus compounds. The recovery values obtained in both GC-MS-SIM and GC-ECD are according to the values reported in the literature. Barrek et al.18 using GC-MS-SIM
obtained recoveries from 79 to 84% for organochlorine and from 88 to 93% for organophosphorus in pesticide analyses of citrus EO using Florisil® SPE. Milhome et al.19 studied the
determination of pesticides (multiresidue method) using SPE C18 in aqueous samples and obtained a recovery of 86.8% for chlorpyrifos and 92.1% for methyl parathion. Zuin et al.20
using GC-ECD obtained recovery values of 72 to 111% for organochlorine and organophosphorus pesticides.
The limits of detection and quantification, repeatability and recovery showed that GC-ECD is better
than GC-MS-SIM for the analysis of all pesticides tested. These results suggest that GC-MS-SIM could be used as a screening method for the identification of the pesticide and GC-ECD as quantitative method.
Determination of pesticide residues in commercial EO
Fifteen Brazilian commercial citrus EOs were analyzed in order to investigate possible contamination of pesticides. The detected pesticides are shown in Table 6.
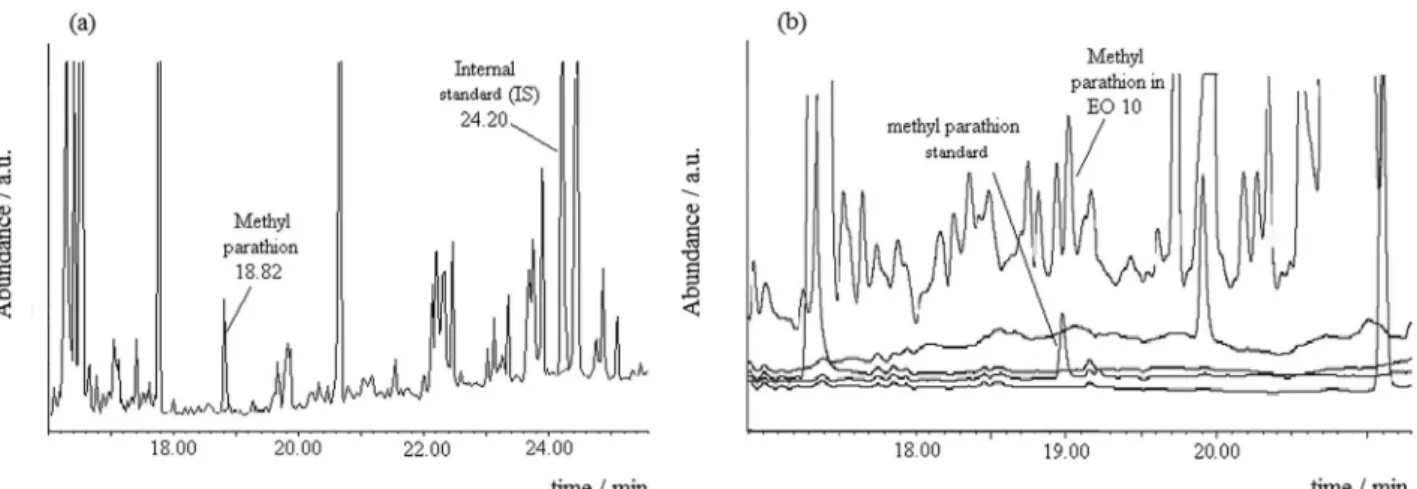
Figure 3 shows the GC-ECD and GC-MS-SIM chromatograms with the residues of dicofol in orange EO (EO 2) and Figure 4 presents lemon EO (EO 10) chromatograms in which residues of methyl parathion could be detected. The MRL established by the
Codex Alimentarius3 for dicofol in citrus culture is
5.0 mg L-1 and the value of this pesticide residue found
by GC-ECD was 35.36 mg L-1. The Codex Alimentarius
does not establish any MRL reference value for the methyl parathion3 and the use of this pesticide is not authorized for
citrus culture. The residue was quantified at 43.45 mg L-1
by GC-ECD.
Chlorpyrifos residue was detected in three samples of lemon EO (EO 1, EO 5 and EO 10), one sample of orange Table 5. Repeatabilities and recoveries of the pesticides in GC-MS-SIM and
GC-ECD
Pesticide GC-MS-SIM GC-ECD
RSD / % Recovery / % RSD / % Recovery / %
Aldrin 2.3 81 – –
Chlordane 3.7 73 0.003 101
Dicofol 0.5 71 0.000 104
Dieldrin 3.1 83 0.007 100
Dimethoate 2.3 76 0.003 101
Methidathion 0.9 80 0.005 101
Methyl chlorpyrifos
3.5 77 0.001 99
Methyl paration
4.3 74 0.035 101
Figure 3. EO 2 chromatograms showing the residue of dicofol: (a) GC-MS-SIM and (b) GC-ECD, upper line commercial EO and bottom line standard solutions.
Table 6. Results of commercial EOs analyzed by GC-ECD
Commercial EO Pesticide Concentration / (mg L-1)
EO1 methyl chlorpyrifos 38.94
EO2 dicofol
dimethoate
35.36 37.60
EO5 methyl chlorpyrifos 34.68
EO9 methyl chlorpyrifos methidathion
39.97 26.27 EO10 methyl chlorpyrifos
methyl parathion
39.86 43.45
Figure 5. GC-ECD chromatograms of EOs: (a) EO 1, (b) EO 5, (c) EO 9, (d) EO 10 and (e) EO 13 ECD, upper line commercial EO and bottom lines standard solutions.
Figure 4. Chromatograms of EO 10 that showed residue of methyl parathion: (a) GC-MS-SIM and (b) GC-ECD ECD, upper line commercial EO and bottom lines standard solutions.
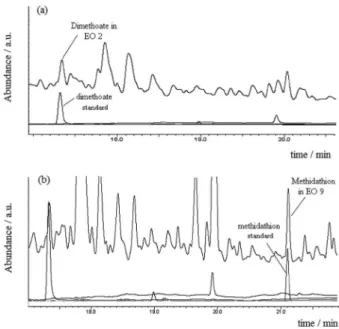
(EO 9) and one of bergamot (EO 13). Figure 5 shows the GC-ECD chromatograms of the methyl chlorpyrifos contamination. The residues of methyl chlorpyrifos were
much higher than that permitted by the Codex Alimentarius.3
MRL for this pesticide in citrus culture is 2.00 mg L-1.
methidathion residue in EO 9 was 26.27 mg L-1. Both are
orange EO and the value of MRL for these pesticides is
2.00 mg L-1. Figure 6 shows the GC-ECD chromatograms
of dimethoate and methidathion residues.
In GC-MS-SIM and GC-ECD, the LOD values for chlordane were 0.30 and 0.07 mg L-1, respectively. MRL for
chlordane in citrus culture is 0.02 mg L-1. This pesticide was
not detected above the LOD of both methods. The methods were not able to detect the presence of this pesticide above
the MRL, from 0.02 mg L-1 to 0.07 mg L-1 by GC-ECD
for example.
Conclusion
The Florisil® SPE cartridge associated to GC-MS-SIM or
GC-ECD is efficient in the extraction and pre-concentration of pesticide residues in citrus EOs, allowing also their quantification. The quantitative results showed that GC-ECD is better than GC-MS-SIM for analysis of all pesticides tested. From fifteen investigated samples, six (40%) contain pesticide residue. In all of them, the pesticides were quantified in concentrations above their MRL. The lemon EO 10, as well as the orange EOs 2 and 9, presented residues of two pesticides. The use of methyl parathion is not allowed in citrus culture, however this pesticide was found in EO 10. These results emphasize the need for monitoring cultivation of citrus fruits and contribute to the standardization of the quality of Brazilian citrus essential oil production.
Acknowledgements
The authors thank Fundação de Amparo à Pesquisa do Estado do Rio de Janeiro (FAPERJ), Conselho Nacional de Desenvolvimento Científico e Tecnológico (CNPq) and Coordenação de Aperfeiçoamento de Pessoal de Nível Superior (CAPES) for financial support and research fellowships, and Embrapa Agroindústria de Alimentos (Rio de Janeiro) for financial support.
References
1. Bizzo, H. R.; Hovell, A. M. C.; Rezende, C. M.; Quim. Nova 2009, 32, 588.
2. Ministério da Agricultura, Pecuária e Abastecimento, Sistema de Agrotóxicos Fitossanitarios (AGROFIT), available in http://
agrofit.agricultura.gov.br/agrofit_cons/principal_agrofit_cons acessed in November 2011.
3. http://www.codexalimentarius.net/mrls/pestdes/jsp/pest_q-e.jsp accessed in November 2011.
4. Di Bella, G.; Saitta, M.; Pellegrino, M.; Salvo, F.; Dugo, G.;
J. Agric. Food Chem.1999, 47, 1009.
5. Di Bella, G.; Saitta, M.; Lo Curto, S.; Lo Turco, V.; Visco, A.; Dugo, G.; J. Agric. Food Chem. 2000, 48, 4460.
6. Di Bella, G.; Serrao, L.; Salvo, F.; Lo Turco, V.; Croce, M.; Dugo, G.; Flavour Fragr. J.2006, 21, 497.
7. Saitta, M.; Di Bella, G.; Salvo, F.; Lo Curto, S.; Dugo, G.;
J. Agric. Food Chem.2000, 48, 797.
8. Di Bella, G.; Saitta, M.; La Pera, L.; Alfa, M.; Dugo, G.;
Chemosphere2004, 56, 777.
9. Dellacassa, E.; Lorenzo, D.; Di Bella, G.; Dugo, G.; J. Essent. Oil Res. 1999, 11, 465.
10. Aramendia, M. A.; Borau, V.; Lafont, F.; Marinas, A.; Marinas, J. M.; Moreno, J. M.; Urbano, F. J.; Food Chem. 2007, 105, 855.
11. Agência Nacional de Vigilância Sanitária (ANVISA); Programa de Análise de Resíduos de Agrotóxicos em Alimentos (PARA),
Nota Técnica para Divulgação dos Resultados do PARA
2008; ANVISA: Brasília, 2009, available in www.anvisa.
gov.br/divulga/noticias/2009/pdf/150409_para.pdf acessed in November 2011.
12. International Conference on Harmonisation of Technical Requirements for Registration of Pharmaceuticals for Human Use (ICH), Q2B (CPMP/ICH/281/95) Validation of Analytical Procedures: Methodology: Text and Methodology, 1995.
13. Rissato, S. R.; Galhiane, M. S.; Knoll, F. R. N.; Andrade, R. M. B.; Almeida, M. V.; Quim. Nova2006, 29, 950.
14. González, F. J. E.; Torres, M. E. H.; Lopez, E. A.; Cuadros-Rodriguez, L.; Vidala, J. L. M.; J. Chromatogr., A 2002, 966, 155.
15. Miller, J.C.; Miller, J.N.; Statistics for Analytical Chemistry,
2nd, Addison-Wesley Wilmington: Delaware, 1993, pp. 42-45.
Figure 6. GC-ECD chromatograms of EOs: (a) EO 2 and (b) EO 9 ECD,
16. Frenich, A. G.; Moreno, J. L. F.; Vidal, J. L. M.; Liébanas, F. J. A.;
J. Agric. Food Chem.2007, 55, 8346.
17. Rodrigues, M. V. N.; Reyes, F. G. R.; Magalhaes, P. M.; Rath, S.;
J. Braz. Chem. Soc. 2007, 18, 135.
18. Barrek, S.; Paisse, O.; Loustalot, M.-F. G.; Anal Bioanal. Chem. 2003, 376, 157.
19. Milhome, M. A. L.; Souza, P. L. R.; Keukeleire, D.; Nascimento, R. F.; J. Braz. Chem. Soc.2011, 22, 2048.
20. Zuin, V. G.; Yariwake, J. H.; Bicchi, C.; J. Chromatogr., A2003,
985, 159.
Submitted: July 11, 2011