Brazilian Journal of Physics, vol. 40, no. 3, September, 2010 353
Dielectric and piezoelectric properties of
Ba
(
ZrxTi
1−x)
O
3lead-free ceramics
Wei Li,∗ Zhijun Xu, Ruiqing Chu, Peng Fu, and Guozhong Zang
College of Materials Science and Engineering, PlaceNameLiaocheng PlaceTypeUniversity, Liaocheng 252059, country-regionplaceChina (Received on 19 May, 2010)
Lead-free ceramicsBa(ZrxTi1−x)O3(x=0.02−0.2)were prepared using a solid-state reaction technique. The
structural and electrical properties were systemically investigated. Crystalline structures and microstructures were analyzed by X-ray diffraction and scanning electron microscope (SEM) at room temperature. All the samples possess pure perovskite structure. A small amount of Zr content has great effect on the microstructure ofBa(ZrxTi1−x)O3ceramics. The homogeneous microstructure with grain size about 30µm is obtained for the
sample atx=0.05. The phase transitions merge together in one peak for the samples atx=0.10 and the highest dielectric constant 15900 is obtained for the sample atx=0.15. TheBa(ZrxTi1−x)O3 ceramics at x=0.05
exhibit excellent piezoelectric properties of highd33=208pC/N,kp=31.5% andQm=500.
Keywords: Ceramics; Microstructure; Dielectric properties; Piezoelectric properties.
1. INTRODUCTION
Lead zirconate titanate (PZT) ceramics are the most widely used piezoelectric materials due to their superior piezoelectric properties close to the morphotropic phase boundary (MPB) between rhombohedral and tetragonal phases. Nevertheless, they are not environment friendly for lead oxide toxicity. With the recent growing demand of global environmental protection, many researchers have greatly focused on free ceramics to replace the lead-based ceramics [1-3].
Barium titanate (BaTiO3)is one of the most widely stud-ied lead-free piezoelectric material [4-10]. It is well known that BaTiO3, which is a typicalABO3 perovskite-type ma-terial, has five kinds of crystal systems: hexagonal, cubic, tetragonal, orthorhombic and rhombohedral, depending on the phase transition temperature: 14320C, 1300C, 50Cand −900C, respectively [5,6]. Donor-dopingBaTiO3solid so-lutions with ions (e.g.,Ca2+, Sr2+,La3+,Zr4+andNb5+, etc.) have been and continue to be of interest for investiga-tion, not only because of their various applications, but also for their interesting dielectric and ferroelectric behaviors [7-9]. In particular, compositionally modified BaZrxTi1−xO3 (BZT) receives much attention due to the tunable structure and electrical properties to specific applications, because of Zr4+ is chemically more stable than Ti4+ [9]. The poly-morphic phase transitions ofBaZrxTi1−xO3(rhombohedral – orthorhombicT1, orthorhombic – tetragonalT2and tetrag-onal – cubic Tc) move closer with increasing Zr content
and merge near room temperature for the composition of x=0.15. Further increase inZrcontent, especially forx> 0.25, the samples show broad dielectric peaks with frequency dispersion, i.e., ferroelectric-relaxor behavior [10,11]. In the last few years, BZT ceramics have been used as a di-electric material in multi-layer ceramic capacitors (MLCC). The compositional and microstructure modification play im-portant roles to meet the required dielectric constant and dielectric temperature characteristic, however, dependence of ferroelectric properties on Zr content has not been well understand [12,13]. In this work, the structure, dielectric
∗Electronic address:[email protected]
properties and ferroelectric properties of theBaZrxTi1−xO3
(x=0.02−0.2)ceramics as a function ofZrcontent were systemically investigated.
2. EXPERIMENTAL
BaZrxTi1−xO3ceramics ofx=0.02, 0.05, 0.07, 0.10, 0.15
and 0.20 were prepared by conventional solid-state reaction technique, respectively. Raw materials ofBaCO3(99.0%), ZrO2(99.0%) andTiO2(99.5%) were mixed with addition of alcohol, then dried and calcined at 12000C for 4 h. There-after, they were remixed and pressed into 12mm-diam pellets and sintered at 14000C for 5 h in air. The sample crystal-lization behavior was examined using an X-ray diffraction meter using aCu Kα radiation (λ=1.54178 ˚A) (XRD, D8 Advance, Bruker Inc., Germany). The dielectric properties were measured by the precision impedance analyzer (4294 Agilent Inc., America) controlled by a computer at 100kHz with the testing temperature ranged from room temperature to 2000C. Ferroelectric hysteresis loops were measured at room temperature using an aix-ACCT TF2000FE-HV ferro-electric test unit (aix-ACCT Inc., Germany). The piezoelec-tric constantd33was measured using a tester quasi-staticd33 meter (YE2730 SINOCERA, China). The mechanical qual-ity factorQmand the planar electromechanical coupling
fac-torkpwere calculated following IEEE standards by using the
impedance analyzer.
3. RESULTS AND DISCUSSION
Figure 1 shows the XRD patterns of theBa(ZrxTi1−x)O3 ceramics. As can be seen, all the samples show pure per-ovskite structure, suggesting thatZrdiffuse into theBaTiO3 lattice to form a solid solution. Moreover, it is clearly seen that the diffraction peaks (220) at 66 0 shift signifi-cantly to low angle with increasingZrcontent. Although the microscopic mechanism underlying this observation is cur-rently unclear, the obvious shift and evolution of the split-ting (202)/(220) peaks with increasingZrcontent imply that Zr doping not only induces the lattice distortion but also changes the phase composition ofBa(ZrxTi1−x)O3
354 Wei Li et al.
20 40 60
20 30 40 50 60 70
20 30 40 50 60 70
20 30 40 50 60 70
20 30 40 50 60 70
20 2 220 21 1 20 0 111 11 0 10 0 21 0 In tensit y(a.u .)
2 Theta/(Degrees)
FIG. 1: X-ray diffraction patterns of theBa(ZrxTi1−x)O3ceramics
atx=0.02, 0.05, 0.07, 0.10, 0.15 and 0.20.
x=0.02 x=0.05 x=0.20
FIG. 2: SEM micrographs of the Ba(ZrxTi1−x)O3 ceramics at x=0.02, 0.05 and 0.20.
˚
A) is larger than that of Ti4+ (0.75 ˚A), thus, the substitu-tion ofTi4+ withZr4+could increase the lattice parameter of ceramics [14,15]. Fig. 2 shows the SEM micrographs of Ba(ZrxTi1−x)O3ceramics (x=0.02, 0.05 and 0.20). The
microstructure ofBa(Zr0.02Ti0.98)O3ceramics is inhomoge-neous and some distinct pores exist in the grain boundary. For the sample atx=0.05, the microstructure is homogeneous and little pores exist in the grain boundary, while the grain size is about 30µm. It is well known that clear grain bound-ary and uniformly distributed grain size could enhance the mechanical strength of piezoelectric ceramics and be advan-tageous to the electric properties [16]. For the sample at x=0.20, the microstructure is inhomogeneous and some of the grain size become singularly large (50µm).
The dielectric constants as a function of temperature for the Ba(ZrxTi1−x)O3 system measured at frequency of 100
kHz are shown in Fig. 3. As can be seen, two obvious phase transitions above 200C corresponding to the orthorhombic-tetragonal and orthorhombic-tetragonal-cubic, respectively, are observed for the samples ofx=0.02-0.07. TheTcshifts to lower
tem-perature whileT2shifts to higher temperature with the in-crease ofZrcontent. This is the well-known pinching effect in these compositions [10]. With further increase ofZr con-tent, atx=0.10, the three phase transitions merge together in one broad peak. This result is different from the previ-ous studies, i.e., the three phase transitions merge together at x=0.15 [13]. On the other hand, the dielectric constants of Ba(ZrxTi1−x)O3ceramics increase with increasingZr
con-tent. The highest dielectric constant (15900) is obtained for the sample atx=0.15.
20 40 60 80 100 120 140
0 2000 4000 6000 8000 10000 12000 14000 16000
Temperature(oC)
Dielec tr ic constant x=0.02 x=0.05 x=0.07 x=0.10 x=0.15
FIG. 3: Temperature dependence of dielectric constant for the Ba(ZrxTi1−x)O3ceramics at x=0.02, 0.05, 0.07, 0.10, 0.15 and
0.20 measured at 100 kHz.
-4000 -2000 0 2000 4000
-20 -15 -10 -5 0 5 10 15 20
Ec(V/mm)
Pr (µ
C/cm 2 ) x=0.02 x=0.05 x=0.07 x=0.10 x=0.15 x=0.20
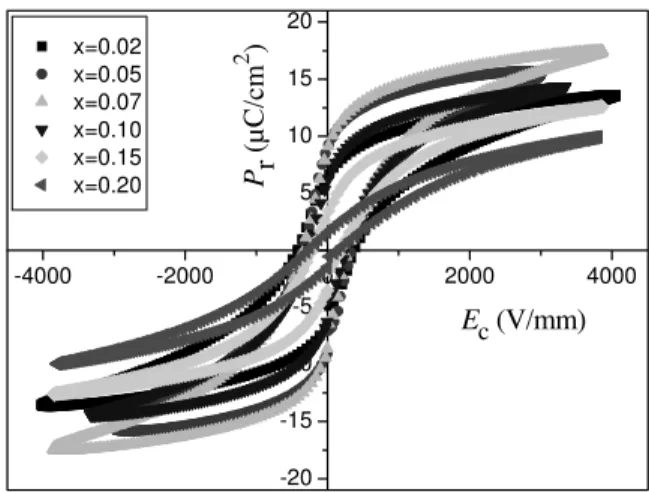
FIG. 4: Polarization vs electric field for variousZrcontent samples at room temperature.
The hysteresis loops of polarization versus electric field are shown in Fig. 4. The remnant polarizationPr and the
coercive fieldsEc as a function of composition are shown
in Fig. 5. It can be seen that the coercive field of the Ba(ZrxTi1−x)O3ceramics atx=0.02 is 390V/mm, while the
value decreases continuously with the increase of Zr con-tent. The coercive fields of theBa(ZrxTi1−x)O3 ceramics at x=0.05, x=0.07, x=0.10, x=0.15 and x=0.20 are 330V/mm, 260V/mm, 240V/mm, 180V/mm, and 140V/mm, respectively. With increasingZrcontent, the remnant polar-izations of theBa(ZrxTi1−x)O3ceramics increase to a
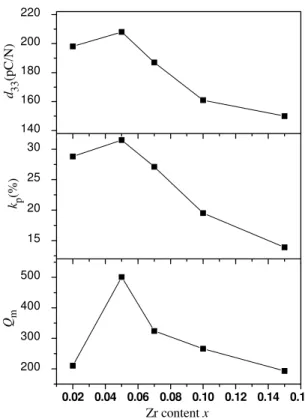
max-imum value 9.0µC/cm2 atx=0.05 and then decrease. Fig. 6 shows the piezoelectric coefficientd33, planar mode elec-tromechanical coupling coefficientkpand mechanical
qual-ity factorQm ofBa(ZrxTi1−x)O3ceramics as a function of
Zrcontent. Atx=0.02,d33,kpandQmare 198 pC/N, 28.8%
Brazilian Journal of Physics, vol. 40, no. 3, September, 2010 355
and Qm reach their maximum values of 208 pC/N, 31.5%
and 500, respectively. The highestd33value 208 pC/N of the Ba(ZrxTi1−x)O3ceramics could be attributed to the relative highPr(9.0µC/cm2) and lowEc(330V/mm)for the sample
atx=0.05. The highestQm(500) for the sample atx=0.05,
which is twice as large as otherBa(ZrxTi1−x)O3ceramic, is
considered to be reasonably consistent with it’s clear grain boundary and uniformly distributed grain size.
0.00 0.02 0.04 0.06 0.08 0.10 0.12 0.14 0.16 0.18 0.20 0.22 2
4 6 8 10
Zr content x
E
c
(V/mm)
Pr (µ
C
/cm
2 )
100 150 200 250 300 350 400 450 500
FIG. 5:PrandEcvariations withxof theBa(ZrxTi1−x)O3
ceram-ics.
0.02 0.04 0.06 0.08 0.10 0.12 0.14 0.16
200 300 400 500
Zr content x Qm
kp
(%)
d33
(pC/N)
15 20 25 30 140 160 180 200 220
FIG. 6: Piezoelectric constantd33, planar electromechanical
coeffi-cientkpand mechanical quality factorQmof theBa(ZrxTi1−x)O3 ceramics as a function ofx.
4. CONCLUSIONS
Lead-freeBa(ZrxTi1−x)O3(x=0.02-0.2) ceramics prepared
by solid-state reaction were systemically investigated. Re-sults show that all the samples are pure perovskite struc-ture. The phase transitions merge together for the samples atx=0.10 and the highest dielectric constant 15900 is ob-tained for the sample atx=0.15. The ceramics atx=0.05 exhibite excellent piezoelectric properties of highd33=208 pC/N,kp=31.5% andQm=501.
Acknowledgments
356 Wei Li et al.
[1] Y. Saito, H. Takao, T. Tani, T. Nonoyama, K. Takatori, T. Homma, T. Nagaya, and M. Nakamura, Nature43284 (2004). [2] E. Hollenstein, M. Davis, D. Damjanovic, and N. Setter, Appl.
Phys. Lett.87182905 (2005).
[3] P. Kantha, K. Pengpat, P. Jarupoom, U. Intatha, G. Ruji-janagul, and T. Tunkasiri, Curr. Appl. Phys.9460 (2009). [4] Z. Yu, R.Y. Guo, and A. S. Bhalla, J. Appl. Phys. 88 410
(2000).
[5] X.S. Wang, L.L. Zhang, H.Liu, J.W. Zhai, X. Yao, Mater. Chem. Phys.112675 (2008).
[6] C.J. Xiao, C.Q. Jin, X.H. Wang, Mater. Chem. Phys.111209 (2008).
[7] P.Z. Zhang, M.R. Shen, L. Fang, F.G. Zheng, X.L. Wu, J.C. Shen, and H.T. Chen Appl. Phys. Lett.92222908 (2008). [8] R.L. Brutchey, G.S. Cheng, Q. Gu, and D.E. Morse, Adv.
Mater.201029 (2008).
[9] T. Maiti, R. Guo, and A.S. Bhalla, Appl. Phys. Lett.89122909 (2006).
[10] P.S. Dobal, A. Dixit, and R.S. Katiyar, J. Appl. Phys.898085 (2001).
[11] Z. Yu, R. Guo, A.S. Bhalla, J. Cryst. Growth233460 (2001). [12] F. Zimmermann, M. Voigts,W. Menesklou, E. Ivers-Tiffe’e, J.
Eur. Ceram. Soc.241729 (2004).
[13] Z. Yu, C. Ang, R.Y. Guo, and A. S. Bhalla, J. Appl. Phys.92 2655 (2002).
[14] B.L. Cheng, C.Wang, S.Y.Wang, H. Lu, Y.L. Zhou, Z.H. Chen, and G.Z. Yang, J. Eur. Ceram. Soc.252295 (2005).
[15] P.Z. Zhang, M.R. Shen, L. Fang, F.G. Zheng, X.L. Wu, J.C. Shen, and H.T. Chen, Appl. Phys. Lett.92222908 (2008). [16] Z.P. Yang, B. Liu, L.L. Wei, Y.T. Hou, Mater. Res. Bull.4381