Optimization and Non-destructive Test Analysis of SS316L Weldments Using GTAW
Balaji Chandrakantha*, S. V. Abinesh Kumarb, S. Ashwin Kumarc, R. Sathishd
aCollege of Engineering, Guindy, Chennai, Tamil Nadu India bWestern India Products Limited – WIPRO, Bangalore, Karnataka, India
cNewcastle University – NCL, New Castle upon Tyne, United Kingdom dSt. Joseph’s College of Engineering, Chennai, Tamil Nadu, India
Received: February 18, 2013; Revised: October 12, 2013
This work aims at optimization and analysis of SS316L weldments using TIG Welding, SS316L is selected over other grades because of its lower carbon content and its weldability properties. The welding parameters are being assessed by means of Taguchi’s L9 orthogonal array with varying gas low, current and bevel angle with the predictions achieved the sample is welded. The level of importance of welding parameters for tensile strength is determined by using analysis of variance (ANOVA) and it was concluded that gas low played the prominent role and the bevel angle was least contributor. The optimization of power and the gas low is made analytically so some conirmatory tests were performed to check the eficiency of the predictions found. The Radiography inspection and microstructure test were performed on samples which showed low, medium and high tensile strength in order to view the changes occurred after welding.
Keywords: SS316L, ANOVA, Taguchi, non-destructive test
1. Introduction
Gas Tungsten Arc Welding (GTAW), also known as tungsten inert gas (TIG) welding is a process that produces an electric arc maintained between a non-consumable tungsten electrode and the part to be welded1. The Heat-Affected Zone, the molten metal and the tungsten electrode are shielded from atmospheric contamination by a blanket of inert gas fed through the GTAW torch. Argon and helium are the preferred inert gases in TIG welding and they generally do not react with the metals being joined. The shielding gas serves as a blanket to the weld and excludes the active properties in the surrounding air. The heavier argon is most effective at shielding the arc because helium requires approximately two to three times higher low rates than argon to provide equal protection2.
2. Taguchi’s Method for Optimization of
Process Parameters
In full factorial design, the number of experimental runs exponentially increases as the number of factors as well as their level increases. This results in a huge experimentation cost and a considerable loss of time3. The parameters which are required for welding is being arranged by means of Taguchi’s orthogonal array with our own sample range4. The Taguchi method is preferred over other methods because it is a simple and robust technique for optimizing the process parameters and it can be effectively used to quickly identify the problems that are incurred during a manufacturing process from data already in existence5. The statistical tool
Minitab is used for the construction of the array. It also emphasizes the mean performance characteristic value close to the target values, thus improving the product quality. With such an arrangement, completely randomized experiments can be performed6.The optimization of process parameters using Taguchi’s method permits evaluation of individual parameters independent of other parameter and also their interactions on the identiied quality characteristics that is the ultimate tensile strength7. Using a signal-to-noise ratio
to analyse the experimental data could help to easily ind out the optimal parametric combinations8.
3. Experimental Procedure
The SS316L with a chemical composition presented in Table 1 was used to conduct the test. The Table 2 shows the three levels and the three parameters which we have employed for the welding the samples. The rod of 25mm diameter was selected for this procedure. The machining of sample is done in accordance to the ASTM-A-370 standards. The machining is done in order to perform the tensile test on the samples9. In a factorial design, the number of experimental runs exponentially increases as the number of factors and their respective level increases.
So, in order to minimise these two factors and to search for an optimal process condition through a limited number of experimental runs, the Taguchi’s L9 orthogonal array consisting of 9 sets of data is as shown in Table 3 has been selected to optimize the multiple performance characteristics of the TIG welding which is to be performed10.
4. Results and Discussions
4.1.
Tensile test
The welding operation was performed on the test-pieces with respect to the parameters incurred by the Taguchi’s orthogonal array, which is represented in Table 3. The tensile test was conducted with the help of UTM on the samples and the data was recorded for further tests. The results of the tensile tests are shown in Table 4.
The Figure 1 shows the Engineering Stress-Strain curve of Sample-I.
4.2.
Contour plots
In a contour plot, the values for two variables are represented on the x- and y- axes, while the values for a third variable are represented by shaded regions, called contours. A contour plot is like a topographical map in which x-, y- and z- values are plotted instead of longitude, latitude and altitude.
Figure 2 shows a contour plot of tensile strength vs gas low in LPM and bevel angle in degrees. The maximum tensile strength has occurred when both the gas low and the bevel angle is minimum. As the igure shows that the for a tensile strength greater than 570 MPa we need to have an angle range of 60 to 63° approximately and the gas low below 0.72 LPM which is calculated approximately from the graph.
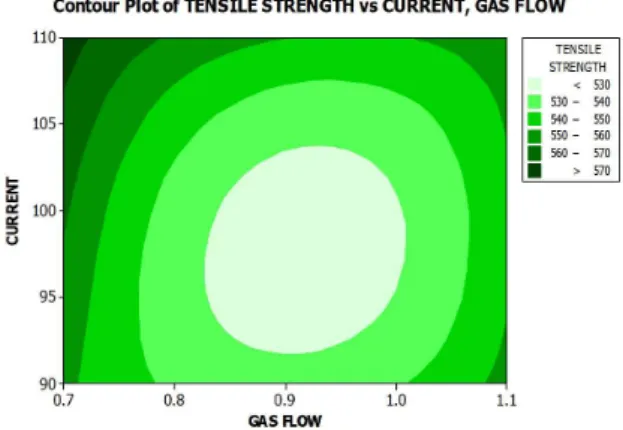
Figure 3 shows the Contour plot of Tensile strength vs Current in Amperes, Gas low in LPM. The maximum value of tensile strength is achieved with the gas low to be minimal, as discussed in the previous igure and the current needs to be maximum which is indicated in the top left corner of the igured which is observed from the graph.
Figure 4 Contour plot of Tensile strength vs Bevel angle in degrees, current in Amperes. The maximum value of tensile strength is reached when the current is maximum
Table 3. Experimental data.
Sample ID Current (Amperes)
Bevel angle (Degrees)
Gas flow (LPM)
Sample A 90 60 1.1
Sample B 90 70 0.9
Sample C 90 80 0.7
Sample D 100 60 0.9
Sample E 100 70 0.7
Sample F 100 80 1.1
Sample G 110 60 0.7
Sample H 110 70 1.1
Sample I 110 80 0.9
Table 1. Chemical composition.
Elements C Si Mn P
Wt % 0.03 0.29 1.58 0.027
Elements S Cr Mo Ni
Wt % 0.003 16.25 2.27 11.9
Table 2. Parameters and factors.
Levels Current (A)
Bevel angle (°)
Gas flow (LPM)
Level A 90 60 1.1
Level B 100 70 0.9
Level C 110 80 0.7
Table 4. Tensile test.
Sample ID Tensile strength (MPa)
Sample A 554.74
Sample B 535.04
Sample C 553.47
Sample D 526.29
Sample E 562.30
Sample F 549.44
Sample G 575.57
Sample H 557.97
Sample I 551.20
Figure 1. Tensile graph for sample I.
which is indicated in the bottom right corner and when the bevel angle needs to be in the range of 60 to 63° which is observed from the Figure 3.
4.3.
Probability plots
Use of probability plots helps to determine whether a particular distribution its your data or to compare different sample distributions. It calculates the cumulative distribution function (cdf) and conidence intervals based on parameters estimated from your data. We can also provide historical parameters using the distribution options. The parameter estimates the historical parameters which are displayed in an output table along with an Anderson-Darling goodness of it statistic and associated p-value and the number of observations.
If the distribution its your data:
• The plotted points will roughly form a straight line; • The plotted points will fall close to the fitted
distribution line.
The Figures 5, 6 and 7 shows the probability plots which were obtained using the statistical software Minitab showed that the plotted points roughly formed a straight line and the plotted points have fallen close to the itted distribution line which indicates that the distribution has itted the data which is given as input.
4.4.
Main effect plot for means
Average response for each combination of control factor levels in the design. When performing a statistical analysis, one of the simplest graphical tools at our disposal is a main effects plot. This plot shows the average outcome for each value of each variable, combining the effects of the other variables as if all the variables are independent.
Figure 8 shows the main effect of plot for means where the optimum parameters will be based on the highest peak at each parameter. From the igure, the optimum parameter is determined. The best parameter according to the graph
Figure 3. Contour plot of Tensile strength vs Current, Gas low.
Figure 4. Contour plot of Tensile strength vs Bevel angle, current.
Figure 5. Probability plot of gas low.
Figure 6. Probability plot of current.
shows the gas low to be 0.7 LPM approximately, the bevel angle should be 60° approximately and the current should be at a value of 110 amperes.
4.5.
Analysis of Variance (ANOVA) -tensile
strength
The purpose of the analysis of variance (ANOVA) is to investigate which welding parameters signiicantly affect the performance characteristic. In addition, the F-test was used to determine which welding parameters have a signiicant effect on the response (UTS). Usually, the change of the welding parameter has a signiicant effect on the performance characteristic when the F-value is large as shown in Table 5.
5. Confirmative Test
5.1.
Radiography inspection
This test was performed to ind the weld defects in a more detailed and simpler ways11.The Radiography test were conducted on the test pieces which showed low, medium and high tensile strength. The radiography test were performed and the test reports are shown in the below Table 6.
As the images in the table show that there are defects in Sample D and Sample G. The Sample I showed no defects. In order to double check the other side of the rod element
was also tested and that is also shown in the Table 6. The defect incurred was Lack of penetration (LOP) occurs when the weld metal fails to penetrate the joint. It is one of the most objectionable weld discontinuities12.
Table 5. ANOVA.
Source DF SEQ. SS
ADJ. SS
ADJ. MS
F P
Current 3 1290.15 913.30 304.43 190.42 0.000 Bevel angle 2 518.26 518.26 259.13 162.08 0.000
Gas low 3 3157.81 2967.78 989.26 618.77 0.000
Error 18 28.78 28.78 1.60
Total 26 4994.99
S = 1.26442 R-Sq = 99.42 R-Sq (adj) = 99.17%.
Table 6. Radiography results.
Sample D Sample G Sample I
“A” Side Result
“B” Side Result
Table 7. Microstructure.
Sample ID Weld zone Base metal Heat affected zone
Sample D
Sample G
Sample I
Lack of penetration allows a natural stress riser from which a crack may propagate. These defects is one of the non-objectionable defects but on major cases this lack of penetration defect can cause lamellar cracks13 which proves to be one of the major defect so in order to minimize the LOP defect the following are the main reasons for the defect Improper joints design, too small bevel angle, less Arc current, longer arc length, wrong electrode manipulation.
5.2.
Microstructure study
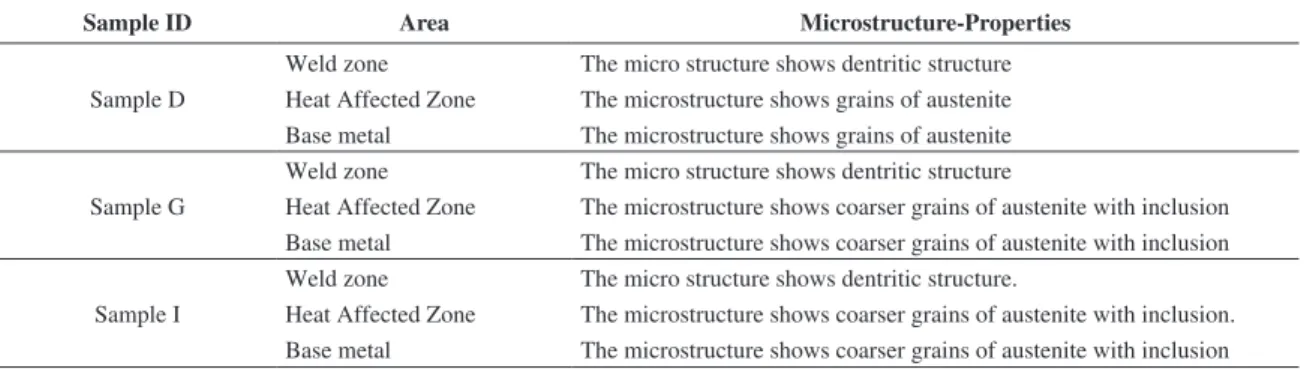
The microstructure study is made in order to view the material properties after the welding operation being performed on the sample. The equipment used is metallurgical Microscope-METSCOPE-1 and the magniication of 100x is used and the microstructure of the three main zones that is Weld zone, Heat affected zone and the base metal is presented in Table 7 and the microstructure was taken only for the samples which possessed Low, Medium and High Tensile strength. The properties of the microstructure Sample D, Sample G and Sample I is clearly presented in Table 8.
6. Conclusions
All the experimental steps were carried out under precautionary measures are in order to keep the error factor low and to increase the reliability of the results. In spite of these measures taken, the results are prone to some deviations
which subjected due to the uncontrolled conditions and factors which were not taken into considerations during the scope of this work.
• Taguchi method is a very effective tool for process optimization under limited number of experimental runs;
• The optimized parameters have 95% conidence limit which makes the process parameters to be signiicant. The prediction and actual values are also signiicant; • The results conclude that the Gas low has a major
impact in affecting the output tensile strength that is desired and the Bevel angle has the least impact in affecting the tensile strength. This concludes that selection of parameters and their combinations and their values relies on the output weld characteristics desired and the contribution of each parameter on the outputs;
• The radiography results showed us the defect of lack of penetration, thus the result concludes that the defect does not create a major impact;
• The micro structure results showed some inclusions in the weldments and the Heat affected zone.
Acknowledgements
The authors are sincerely thankful to the Managing Director, St. Joseph’s College of Engineering, Chennai and Team NS for extending their support to carry out this work.
Table 8. Microstructure properties.
Sample ID Area Microstructure-Properties
Sample D
Weld zone The micro structure shows dentritic structure Heat Affected Zone The microstructure shows grains of austenite Base metal The microstructure shows grains of austenite
Sample G
Weld zone The micro structure shows dentritic structure
Heat Affected Zone The microstructure shows coarser grains of austenite with inclusion Base metal The microstructure shows coarser grains of austenite with inclusion
Sample I
Weld zone The micro structure shows dentritic structure.
Heat Affected Zone The microstructure shows coarser grains of austenite with inclusion. Base metal The microstructure shows coarser grains of austenite with inclusion
References
1. Gas Tungsten Arc Welding - GTAW. Guidelines. 2013. p. 5.
2. American Welding Society - AWS. Welding handbook. v. 2. 9th ed. Welding processes part 1.
3. Datta S, Bandyopadhyay A and Pal PK. Grey-based taguchi method for optimization of bead geometry in submerged arc bead-on-plate welding. International Journal of Advanced Manufacturing Technology. 2008; 39(11-12):1136-1143. http:// dx.doi.org/10.1007/s00170-007-1283-6
4. Gadewar S, Swaminadhan P and Harkare M. Experimental
investigations of weld characteristics for a Single pass TIG welding with Stainless steel. Journal of Engineering and Technology. 2010; 2(8):3676-3686.
5. Lim S-H, Lee C-M and Chung WJ. A study on the optimal cutting condition of a high speed feeding type laser cutting
machine by using Taguchi method. International Journal of Precision Engineering and Manufacturing. 2006; 7:18-23.
6. Kwak JS. Application of Taguchi and response surface
methodologies for geometric error in surface grinding process. International Journal of Machine Tools & Manufacture. 2005; 45:327-334. http://dx.doi.org/10.1016/j. ijmachtools.2004.08.007
7. Madusudhan reddy G, Gokhale AA and Prasad Rao K.
Weld microstructure reinement in a 1441 grade Al-Lithium
alloy. Journal of Materials Science. 1997; 32(15):4117-21. 10.1023/A:1018662126268
8. Eşme U. Application of taguchi method for the optimization of resistance spot welding process. Arabian Journal for Science and Engineering. 2009; 34(2b):518-523.
9. Balaji C, Abinesh Kumar SV, Kumar SA and Sathish R.
using Tungsten Inert gas welding. International Journal of Engineering Science and Technology. 2012; 4(5):2053. 10. Fraley S, Oom M, Terrien B and Date JZ. Design of experiments
via Taguchi methods: orthogonal arrays. Michigan Chemical
Process Dynamic and Controls Open Text Book; 2006.
11. Silva RR, Siqueira MHS, Souza MPV, Rebello JMA and Calôba LP. Estimated accuracy of classiication of defects
detected in welded joints by radiographic tests. NDT & E International. 2005; 38(5):335-343. http://dx.doi. org/10.1016/j.ndteint.2004.10.007
12. Weld defects and quality control. chapt. 11, p. 199-215. Available from: <http://bbssystem.com/manuals>