Article
J. Braz. Chem. Soc., Vol. 27, No. 7, 1264-1272, 2016. Printed in Brazil - ©2016 Sociedade Brasileira de Química 0103 - 5053 $6.00+0.00
*e-mail: [email protected]
Simultaneous Voltammetric Determination of Antihypertensive Drugs Amlodipine
and Atenolol in Pharmaceuticals Using a Cathodically Pretreated Boron-Doped
Diamond Electrode
Jaqueline T. Moraes, Ana P. P. Eisele, Carlos A. R. Salamanca-Neto, Jessica Scremin and Elen R. Sartori*
Departamento de Química, Centro de Ciências Exatas, Universidade Estadual de Londrina (UEL), Rodovia Celso Garcia Cid (PR 445), km 380, CP 10011, 86057-970 Londrina-PR, Brazil
The simultaneous voltammetric determination of antihypertensive drugs amlodipine besylate (AML) and atenolol (ATN) using a cathodically pretreated boron-doped diamond electrode (BDDE) is reported for the first time. The anodic peak potentials of AML and ATN at a CP-BDDE were found to be 0.727 and 1.32 V (vs. Ag/AgCl (3.0 mol L–1 KCl)) in phosphate buffer
(pH 7.0), respectively, by cyclic voltammetry. It was observed that the CP-BDDE possesses improved performance for the simultaneous determination of AML and ATN when compared to other carbon-based electrodes in these conditions. Using square-wave voltammetric technique, the obtained analytical curves were linear in the concentration range from 2.9-33 µmol L–1 for AML
and 9.8-190 µmol L–1 for ATN, with limits of detection of 0.17 and 0.22 µmol L–1, respectively.
The proposed method was successfully applied to the simultaneous determination of AML and ATN in pharmaceutical samples.
Keywords: simultaneous determination, amlodipine determination, atenolol determination, diamond electrode, voltammetry
Introduction
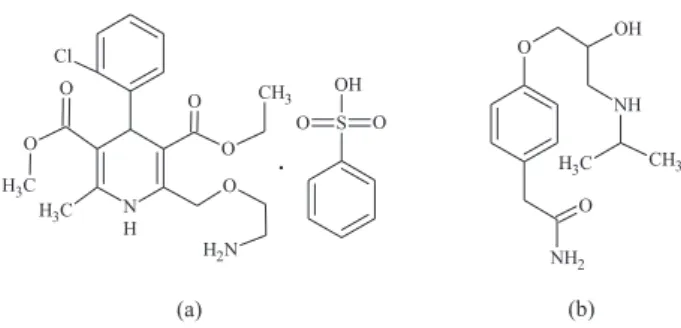
Amlodipine besylate (AML) and atenolol (ATN) are two antihypertensive drugs found conjugated in pharmaceutical formulations. They are widely used for the prevention and treatment of high blood pressure and cardiovascular diseases. AML is a calcium channel blocker and ATN is a β-blocker agent (Figure 1), and this combination is among the preferred antihypertensive combined drugs for the treatment of high blood pressure, heart failure and artery disease in hypertensive patients, because both drugs have been found to be more effective in the treatment of hypertension in patients whose blood pressure is not adequately controlled by an individual drug.1
There is a major concern regarding the safety of AML and ATN due to many patients need to maintain blood pressure control with the use of both antihypertensives. Inappropriate use of these drugs may cause fatigue, depression, mental confusion, hallucinations and sometimes lead to death.1 Therefore, the development of a simple,
sensitive and accurate detection procedure for the
simultaneous determination of AML and ATN to ensure the quality and safety of pharmaceutical formulations that contain both drugs is of paramount importance.
There have been several reports on the individual or simultaneous determination of AML and ATN in pharmaceuticals and biological samples, including the use of chromatography2-4 and spectrophotometry.5,6 The official
method recommended by the British Pharmacopoeia7 for
the individual determination of AML and ATN involves the use of high performance liquid chromatography (HPLC), but there is not yet a method for simultaneous determination of AML and ATN described in any pharmacopeia. The use of HPLC is preferred over other methods because of the
N H C
H3
O
O
C
H3
Cl
O O
CH3
O
N
H2 NH2
O
NH OH
O
CH3
C
H3
(a) (b)
S
O O
OH
.
possibility of simultaneous determination of AML and ATN, without interferences. However, these techniques may suffer from some disadvantages, such as high maintenance and acquisition cost, use of organic solvents, extensive preliminary sample pretreatment, and in some cases low selectivity and sensitivity, thus justifying the need for reliable, low cost and simpler methods.
Compared with other methods, voltammetric methods can be an alternative for simultaneous determination of AML and ATN, because they are simple, fast, environment-friendly, and low cost. Square-wave voltammetry (SWV) coupled to the unique properties of the boron-doped diamond electrode (BDDE) offers the possibility of determining the concentration of analyte directly in the sample without any pretreatment or chemical separation, as well as offering the possibility of simultaneous determination of a wide range of analytes.8 These characteristics make them very
competitive methods and usually the best choice for determination of electroactive compounds, being suitable for routine analysis.9-12
BDDE is widely used in the individual and simultaneous determination of organic substances,13-19 due to particular
properties, as an electrochemical stability in both alkaline and acidic media, a lower residual current, inertness of the surface to adsorption of reaction products with good resistance to passivation, high chemical stability, and a very wide potential range.
For individual determination of ATN working electrode BDDE,20 glassy carbon electrode (GCE),21 carbon
paste electrode (CPE),22 graphite-polyurethane,23 and
gold nanoparticles/multi-walled carbon nanotubes (MWCNTs)-modified GCE24 have already been used, and
for AML, gold electrode,25 CPE,26 poly-L
-methionine-gold nanocomposite/MWCNTs-modified GCE27 have
been used. To the best of our knowledge, no report related to the simultaneous determination of AML and ATN in pharmaceutical dosage forms or biological sample using a voltammetric method, has, so far, been mentioned in literature or in pharmacopeias and hence the present work was undertaken.
In this sense, this work deals with the use of BDDE for simultaneous voltammetric determination of AML and ATN. Oxidation potentials for both antihypertensive drugs are distinct without the need for prior separation or deposition steps for simultaneous determination. The performance obtained by BDDE was also compared with other electrodes, such as a GCE, CPE and multi-walled carbon nanotubes paste electrode (MWCNTsPE). The proposed procedure was applied to determination of AML and ATN in combined pharmaceutical formulations. Moreover, this method is sensitive, simple, does not
involve extraction step, and is free from usage of hazardous chemicals. Since it is inexpensive and easily available chemicals and equipment are used, the developed methods evidence low cost per analysis.
Experimental
Apparatus
The voltammetric measurements were carried out using a µAutoLab type III potentiostat/galvanostat (Eco Chemie, Netherlands) controlled by the general purpose electrochemical system (GPES) software. A three-electrode system was used with a glass cell at room temperature (25.0 ± 0.5 oC) containing BDDE as a working electrode
(8000 ppm doping level, 0.25 cm2 exposed geometrical
area; Adamant Technologies SA, Switzerland), Ag/AgCl (3.0 mol L–1 KCl) as reference electrode and a Pt plate as
auxilary electrode. The pretreatment of the BDDE was carried out in a MQPG-01 potentiostat (Microquímica, Brazil).
The pH of solutions was measured using a pHmeter (Hanna Instruments, USA), model HI-221, employing a combined glass electrode with an Ag/AgCl (3.0 mol L–1
KCl) external reference electrode. Prior to the experiments, the BDDE was electrochemically pretreated in a 0.5 mol L–1
H2SO4 solution: first an anodic pretreatment (0.5 A cm–2,
30 s), which was followed by a cathodic one (–0.5 A cm–2,
120 s). When the BDDE was under cathodic pretreatment conditions, its surface was predominantly hydrogen terminated.28
The HPLC determination of AML and ATN was carried out using a Waters (USA) Alliance® e2695 separation
module, with a Waters 2998 UV-Vis photodiode array detector. The chromatographic separation conditions were carried out according to Barman et al.2 The separation of
AML and ATN was accomplished in an ACE 5 C18 column (250 mm × 4.6 mm i.d., particle size: 5 µm). The mobile phase consisted of a mixture of ammonium acetate buffer solution (pH was adjusted to 4.5 with glacial acetic acid), acetonitrile and methanol (35:30:35 v/v/v), the flow rate was 1.5 mL min–1, column temperature of 40 ºC and the
oil (Nujol®) at a ratio of 30:70% (m/m), as described
previously.29 This functionalization was attended by the
treatment with mixture of HNO3:H2SO4 (3:1, v/v) for 12 h
at room temperature. Carbon paste and mineral oil were carefully homogenized in a Petri dish with a stainless steel spatula for 10 min. Finally, the carbon paste was carefully packed into the cavity of a Teflon® tube supported
with a carbon plate, and was compacted with the spatula resulting in a smooth surface. The geometric area of working electrodes, MWCNTsPE and CPE, was equal to 0.0707 cm2.
Reagents and solutions
All solutions were prepared using ultra-purified water (resistivity ≥ 18.2 MΩ cm) supplied by a Milli-Q system (Millipore®, USA). All chemicals were of analytical reagent
grade and were used as received without any further purification.
A 0.1 mol L–1 phosphate buffer supporting electrolyte
was chosen for the simultaneous determination of AML and ATN. This solution was prepared by mixing 0.1 mol L–1
monobasic potassium phosphate solution and 0.1 mol L–1
anhydrous dibasic potassium phosphate solution with pH adjusted to 7.0.
The 10 mmol L–1 stock solutions of AML and ATN
(Sigma-Aldrich, USA) were prepared in 1:2 (v/v) methanol:water and water, respectively; both AML and ATN working solutions were prepared by appropriate dilution of these stock solutions with the phosphate buffer solution (pH 7.0) just before use.
Combined dosage form samples used in this study were AML/ATN capsules labeled 5:25 and 5:50 mg, respectively, in which 6.9 mg AML is equivalent to 5 mg of amlodipine base per capsule. These samples were purchased from a local drugstore in the city of Londrina, Paraná State, in Brazil.
Analytical procedures
Cyclic voltammetry (CV), SWV and differential pulse voltammetry (DPV) were employed for studies of behavior of AML and ATN. CV was employed for the studies of electrochemical pretreatment and scan rate, while SWV was employed for the studies of pH, supporting electrolyte and electrode comparative purposes. SWV and DPV were employed for the development of analytical procedure. After optimizing the experimental parameters, the analytical curves were obtained by adding small volumes of the concentrated standard solutions of two analytes. Square-wave and differential pulse voltammograms were obtained after each aliquot addition of both antihypertensives. The
limit of detection (LOD) value was calculated as three times the standard deviation of the blank solution/slope of the analytical curve, according to IUPAC recommendation.30
The proposed method was carried out for the simultaneous determination of AML and ATN in pharmaceutical formulations. To prepare solutions containing samples of commercial pharmaceutical combination dosage of AML and ATN, 10 tablets of each combined dosage form were reduced to a homogeneous fine powder in a mortar with a pestle. These powders were weighed and a mass corresponding to one tablet was transferred to a 25 mL calibrated volumetric flask containing 10 mL methanol. After sonication for 5 min, the volumes of the flasks were supplemented with ultra-pure water. For both AML and ATN dosage forms, an aliquot of 170 µL of these solutions was transferred directly to the electrochemical cell containing 10.0 mL of phosphate buffer solution (pH 7.0), after which the voltammogram was obtained. The AML and ATN concentrations in each sample solution were directly determined by interpolation on previously obtained calibration curves.
For recovery studies (performed in triplicate), aliquots of standard solutions of AML and ATN were added to commercial pharmaceutical sample solutions from both antihypertensives.
The results obtained using the proposed SWV method were compared with those from chromatographic method.2
For such, 10 tablets of each pharmaceutical product were reduced to a homogeneous fine powder in a mortar with a pestle. These powders were weighed and a mass corresponding to one tablet was transferred to a 25 mL calibrated volumetric flask and was dissolved in the mobile phase. The sample solutions and mobile phase were filtered using a 0.20 µm PTFE and 0.45 µm nylon membrane filters (Millipore®), respectively. After appropriate dilution with
the mobile phase, chromatograms were obtained for both antihypertensives.
Results and Discussion
Electrochemical behavior of AML and ATN on BDDE
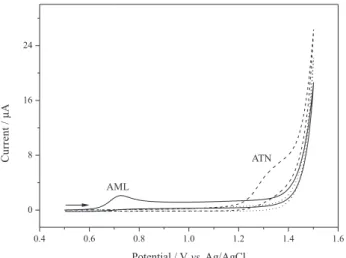
Figure 2 shows the cyclic voltammograms obtained for 49.0 µmol L–1 AML and 49.0 µmol L–1 ATN in phosphate
BDDE are irreversible.31,32 The difference in the oxidation
peak potential values (∆Eap) is close to 0.590 V, indicating
that the determination of one drug is feasible in the presence of the other one and that simultaneous determination is possible at this electrode.
A c c o r d i n g t o t h e f o l l o w i n g e q u a t i o n Ep – Ep/2 = 47.7 mV / αn,33 the number of electrons transferred
(n) in oxidation of AML and ATN at a BDDE was estimated. For AML, Ep is 0.727 V and Ep/2 is 0.677 V. For ATN, Ep is
1.32 V and Ep/2 is 1.27 mV. Considering transfer coefficient
(α) value as 0.5 (which is commonly employed for totally irreversible systems),34 n was estimated to be equal to
2 for both antihypertensives. These results demonstrate that two electrons are involved in the oxidation of AML and two electrons are involved in the oxidation of ATN in phosphate buffer solution (pH 7.0). According to previous studies of AML oxidation,32 the electrochemical oxidation
of AML is believed to occur in 1,4-dihydropyridine ring, involving a two-electron two-proton mechanism, and for ATN, the anodic peak here observed corresponds to the oxidation of the secondary alcoholic group in this molecule, as suggested by Goyal et al.,31 based on results reported by
Hiremath et al.35 on the oxidation of ATN by permanganate in alkaline medium.
The effect of pretreatment of BDDE on a mixture containing AML and ATN was investigated. The BDDE was either anodically or cathodically pretreated and its response was assessed in phosphate buffer solution (pH 7.0). Anodic pretreatment implies in predominance of oxygen terminated surfaces and cathodic pretreatment implies in a predominance of hydrogen terminated ones.28
In this study, the electrochemical behavior of AML and ATN in anodic and cathodic pretreatment was very similar.
Nevertheless, the best results were obtained using a CP-BDDE, which yielded magnitude and best repeatability for the oxidation signal of both antihypertensives with a well-defined voltammetric profile, similarly to what was previously observed for several other analytes.8,15,16,36,37
Hence, all of the following experiments were carried out using predominantly hydrogen terminated surface of BDDE. This pretreatment was preceded by an anodic pretreatment in order to guarantee the oxidation of possible contaminants. The pretreatment of electrode surface was performed only once in the working day, which allowed using the electrode for a long time with the same response.
Effect of pH and supporting electrolyte
The electrochemical behavior of 46 µmol L–1 AML
and 550 µmol L–1 ATN on the CP-BDDE was explored
in Britton-Robinson (BR) buffer solutions at different pH values (2.0-11.0) by using SWV (square-wave frequency (f) = 30 Hz, pulse amplitude (a) = 50 mV and scan increment (∆ES) = 2 mV). By increasing the pH values,
there is a displacement to less positive values of potential peaks for both antihypertensives and the ∆Eap becomes
shorter. The highest current values for AML and ATN were obtained in pH 6.0 and 7.0, respectively. As ATN has a lower magnitude of oxidation current than AML, for equal concentration, and whereas that the amount of ATN in both dosage forms is higher than AML (8.8 µmol of AML and 94 and 188 µmol of ATN), pH 7.0 was selected as determining medium for simultaneous determination of AML and ATN.
Additionally, the response obtained with BR buffer solution (pH 7.0) was compared with that obtained with phosphate buffer (pH 7.0). The results were very similar for AML and a higher peak current for ATN was obtained in phosphate buffer, with a better repeatability of analytical signal. Therefore, phosphate buffer solution (pH 7.0) was chosen for the sequential analysis.
Effect of scan rate
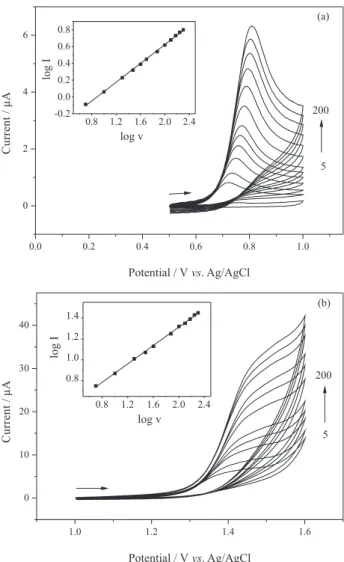
Scan rate study was carried out to get useful information about behavior of AML and ATN at BDDE. Using 48 µmol L–1 AML and 190 µmol L–1 ATN in phosphate
buffer solution (pH 7.0), the voltammetric peak currents were observed as the scan rate over the range 5-200 mV s–1.
The corresponding voltammograms are shown in Figure 3a for AML and Figure 3b for ATN. The peak potential for both antihypertensives was shifted slightly to more positive values with increasing scan rate, a typical characteristic of an irreversible electrochemical reaction.38 A linear
plot of peak current vs. square root of the scan rate was
0.4 0.6 0.8 1.0 1.2 1.4 1.6
0 8 16 24
ATN
AML
C
u
rr
e
n
t
/
µ
A
Potential / Vvs.Ag/AgCl
Figure 2. Cyclic voltammograms (50 mV s–1) in phosphate buffer solution
(pH 7.0) using a BDDE: blank solution (dotted line), 49.0 µmol L–1 AML
obtained for both antihypertensives (r = 0.999 for AML and r = 0.998 for ATN), suggesting that the oxidation of these antihypertensives follows a diffusion-controlled mechanism.38 In addition, plot of the log I
apvs. log v was
linear (inset in Figures 3a and 3b), with a slope of 0.56 for AML and 0.44 for ATN, in close agreement with the theoretical value (0.50) for a diffusion-controlled process.38
Diffusion coefficients for AML and ATN were determined on CP-BDDE in phosphate buffer solution (pH 7.0) using chronoamperometric technique. The currents for AML and ATN were recorded at 0.727 and 1.32 V, respectively, for different concentrations of each antihypertensive (mol cm–3). From the slopes of I vs. t–1/2
and Cottrell’s equation,33 D
o values for AML and ATN were
calculated. The results obtained for Do for AML and ATN
were 3.1 × 10⁻⁵ and 1.2 × 10⁻⁵ cm2 s–1, respectively. D o value
for AML is in close agreement with the reported elsewhere (5.4 × 10⁻⁵ cm2 s–1 in BR buffer solution (pH 5.0)).39
Comparison with other carbon electrodes
It is worthwhile to mention that the response obtained by CP-BDDE was compared with the square-wave voltammetric responses of GCE, CPE and MWCNTsPE for 49 µmol L–1 AML and 97 µmol L–1 ATN (Figure 4)
in phosphate buffer solution (pH 7.0). As can be seen, well-defined peak currents for both compounds were obtained with CPE and CP-BDDE. No peak potential was observed for ATN using a GCE and MWCNTsPE, under identical experimental conditions. No repeatability of analytical signals was obtained for both antihypertensives using a CPE. Hence, taking into account the repeatability of the obtained oxidation signals for AML and ATN (relative standard deviation (RSD) < 1.0%, for n = 6) and higher peak current for ATN, further studies were carried out only with the CP-BDDE.
Simultaneous determination of AML and ATN using a CP-BDDE
Based on the above results, the proposed voltammetric procedure was employed for the simultaneous determination of AML and ATN in pharmaceutical formulations. The SWV and DPV curves presented a good peak-potential separation, which clearly allows the simultaneous determination of these antihypertensives. In order to construct the analytical curves for simultaneous determination of AML and ATN, the effects of the experimental parameters of SWV were investigated. For this, the instrumental parameters that affect the current response of both antihypertensives were optimized. The DPV technique was also used to comparison of results. The investigated parameters were the pulse 0.0 0.2 0.4 0.6 0.8 1.0
0 2 4 6
0.8 1.2 1.6 2.0 2.4 -0.2
0.0 0.2 0.4 0.6 0.8
log
I
log v
C
u
rr
e
n
t
/
µ
A
Potential / Vvs. Ag/AgCl
(a)
200
5
1.0 1.2 1.4 1.6
0 10 20 30 40
0.8 1.2 1.6 2.0 2.4 0.8
1.0 1.2 1.4
lo
g
I
log v
C
u
rr
e
n
t
/
µ
A
Potential / Vvs. Ag/AgCl
(b)
200
5
Figure 3. Cyclic voltammograms for (a) 48 µmol L–1 AML and
(b) 190 µmol L–1 ATN in phosphate buffer solution (pH 7.0) at different
scan rates (v): 5-200 mV s–1. Inset: linear dependence of log I
ap with log v.
0.0 0.4 0.8 1.2 1.6
0 80 160 240 320
Potential / Vvs. Ag/AgCl
j
/
(
µ
A
c
m
-2 )
Figure 4. Square-wave voltammograms obtained for 49 µmol L–1 AML
and 97 µmol L–1 ATN in phosphate buffer (pH 7.0) using CPE (dotted line),
amplitude (a), scan rate (v) and modulation time (t). Table 1 shows range of studied instrumental parameters and their optimum values for this simultaneous determination. These parameters were optimized in phosphate buffer solution (pH 7.0) containing 46 µmol L–1 AML and 570 µmol L–1
ATN.
After these studies, both antihypertensives were determined simultaneously increasing their concentrations in phosphate buffer solution (pH 7.0) using SWV and DPV techniques. The analytical parameters obtained for simultaneous determination of AML and ATN are listed in Table 2. The best values for analytical parameters such as sensitivity and linearity were obtained by DPV. However, SWV presents a better correlation coefficient and precision, which was thus the chosen method for the determination of both AML and ATN. Figure 5 shows the square-wave voltammograms obtained for solution containing both antihypertensives.
The intra-day repeatability of the magnitude of peak current was determined by successive measurements (n = 10) of 9.7 µmol L–1 AML and 48 µmol L–1 ATN. The
inter-day repeatability of magnitude of the peak current
was evaluated by measuring the peak current for similar fresh solutions over a period of 5 days. As can be seen in Table 2, good RSD values were obtained.
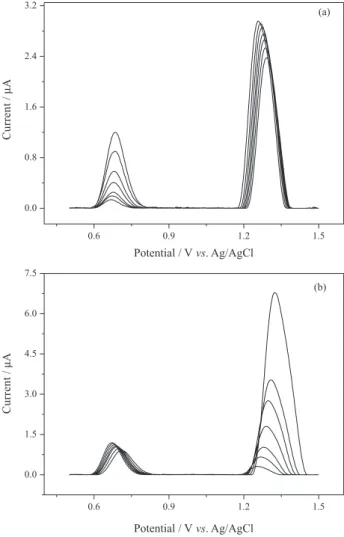
Next, the interference of each analyte in the simultaneous determination of its pairs was performed by changing one analyte concentration and keeping the other unchanged, in the phosphate buffer solution (pH 7.0) by SWV (Figure 6). The separate determination of AML in the concentration range 2.9-34 µmol L–1 was accomplished
in solutions containing ATN at the fixed concentration of 71 µmol L–1 (its peak oxidation current remained constant
(RSD = 7.9%)), according to the analytical equation IAML (µA) = 0.060 + 3.5 × 10⁴[c (mol L−1)] (r = 0.993). On
the other hand, the separate determination of ATN in the concentration range 9.6-190 µmol L–1 was accomplished
in solutions containing AML at the fixed concentration of 24 µmol L–1 (its peak oxidation current remained constant
(RSD = 9.4%)), according to the analytical equation
Table 1. Instrumental parameters optimized for simultaneous determination of AML and ATN on the CP-BDDE
Technique Instrumental parameter Studied range value
Optimized value
DPV
pulse amplitude (a) / mV 10-100 75
scan rate (v) / (mV s–1) 3-7.5 5
modulation time (t) / ms 2-7 3
SWV
square-wave frequency (f) / s–1 10-60 20
pulse amplitude (a) / mV 10-100 70 scan increment (∆ES) / mV 1-5 3
DPV: differential pulse voltammetry; SWV: square-wave voltammetry.
Table 2. Analytical parameters for the voltammetric determination of AML and ATN by SWV and DPV in phosphate buffer solution (pH 7.0), using a CP-BDDE
AML ATN
SWV DPV SWV DPV
Peak potential / V 0.68 0.68 1.24 1.27
Linear range / (µmol L–1) 2.9-33 0.98-33 9.8-190 1.4-14
Slope / (µA mol−1 L) 3.14 × 10⁴ 7.06 × 10⁴ 3.72 × 10⁴ 7.40 × 10⁴
Intercept / µA 0.08 0.16 0.05 1.37
Correlation coefficient 0.992 0.973 0.999 0.974
Detection limit / (µmol L−1) 0.17 0.16 0.22 0.19
Repeatability intra-day (RSD) / % 2.95 5.71 1.02 4.14
Repeatability inter-day (RSD) / % 4.21 9.35 3.62 8.70
AML: amlodipine besylate; ATN: atenolol; SWV: square-wave voltammetry; DPV: differential pulse voltammetry; RSD: relative standard deviation. Figure 5. Square-wave voltammograms at CP-BDDE in phosphate buffer solution (pH 7.0) at concentration range 2.9-33 µmol L–1 for AML and
9.8-190 µmol L–1 for ATN. Inset: analytical curves of AML and ATN
IATN (µA) = 0.017 + 3.6 × 10⁴[c (mol L−1)] (r = 0.998).
It can be concluded that the change of concentration of one studied drug did not have significant influence on the peak current and peak potential of the other one. It is very important to note that the oxidation processes of AML and ATN on CP-BDDE are independent.
Comparison with other analytical methods
A comparison between the analytical parameters of the present method and some previous methods reported in the literature for the simultaneous determination of AML and ATN are given in Table 3. From these data, it can be seen that the analytical parameters for the simultaneous voltammetric determination of AML and ATN herein proposed are better than those for other analytical methods. Furthermore, the method herein proposed only requires minimal sample pretreatment. Here it should be mentioned once again that there are no papers reporting on voltammetric methods for the simultaneous determination of AML and ATN in real samples until this paper was undertaken. Considering the advantages of the technique and the use of BDDE, such as simplicity of use, stability and lifetime, it can be used for the simultaneous determination of both antihypertensives. Besides, the sample preparation for electrochemical analysis is simple and practical, no filtration and a small volume of solution are required; the procedure does not involve the use of hazardous chemicals for analysis or the environment, when compared with other techniques.
Interference study
The selectivity of the proposed method was evaluated by the addition of possible interferents (commonly present in the analyzed pharmaceutical formulations), such as starch, povidone, microcrystalline cellulose, titanium dioxide, magnesium carbonate and magnesium stearate, to standard solution containing AML and ATN, at the concentration ratios (standard solution:interferent compound) of 1:1, 1:10, and 10:1 (m/m). The corresponding oxidation peak currents were compared with those obtained in the absence of each interferent. The analysis of the obtained responses allowed concluding that these compounds do not significantly interfere (< 5%) in the determination of AML and ATN under the used working conditions.
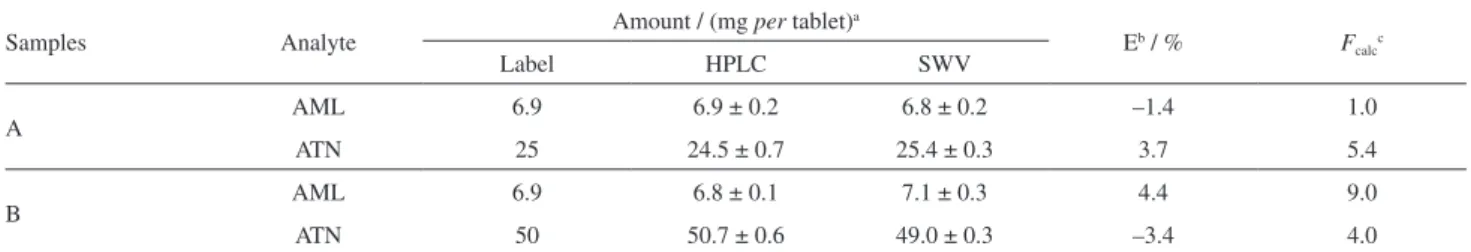
Application of the voltammetric method to pharmaceutical formulations
In order to evaluate the validity of the herein proposed method, two different commercial pharmaceutical samples
Table 3. Comparison of the analytical parameters obtained using different techniques for the determination of AML and ATN
Analyte Technique
Concentration range / (µmol L–1)
LOD /
(µmol L–1) Reference
AML
HPLC 18-880 3.5 4
HPLC 98-150 8.9 5
UV 7.1-35 0.09 6
UV 7.1-56 0.51 7
SWV 2.9-33 0.17 this work
ATN
HPLC 38-1900 3.8 4
HPLC 1500-2300 20 5
UV 15-90 0.31 6
UV 75-750 5.7 7
SWV 9.8-190 0.22 this work
LOD: limit of detection; AML: amlodipine besylate; ATN: atenolol; HPLC: high performance liquid chromatography; SWV: square-wave voltammetry.
0.6 0.9 1.2 1.5
0.0 0.8 1.6 2.4 3.2
C
u
rr
e
n
t
/
µ
A
Potential / Vvs. Ag/AgCl
(a)
0.6 0.9 1.2 1.5
0.0 1.5 3.0 4.5 6.0 7.5
(b)
C
u
rr
e
n
t
/
µ
A
Potential / Vvs. Ag/AgCl
Figure 6. Square-wave voltammograms at CP-BDDE in phosphate buffer solution (pH 7.0) of (a) 2.9-34 µmol L–1 AML and fixed concentration of
71 µmol L–1 ATN, and (b) fixed concentration of 24 µmol L–1 AML and
containing AML and ATN in a combined formulation were analyzed to determine these substances. The results of the analysis of all samples are summarized in Table 4. No significant differences were observed between the values found for the contents of AML and ATN in the commercial pharmaceutical samples using the proposed method and the comparative one. According to the F-test,40 the two
methods provide equivalent level of precision at 95% confidence level. All calculated values were lower than the standard value (Fcritical = 19.0). Besides, paired t-test40 was
applied and the results obtained were statistically equal with calculated t values smaller than the critical one (tAML = 2.00,
tATN = 3.25 and tcrit = 12.7 at a 95% confidence level) thus indicating that there is no difference between the obtained results and they are free from interferences in different pharmaceutical samples.
Addition and recovery studies were carried out by addition of known volumes of AML and ATN standard solutions to that of a given sample, followed by analysis using SWV. Good recoveries were obtained for the investigated commercial tablets, ranging from 93.7 to 102 and 95.3 to 104% for AML and ATN, respectively; clearly the proposed method does not suffer from any significant effects of matrix interference.
Conclusions
The present study shows that the use of BDDE led to the development of analytical procedure for the simultaneous voltammetric determination of AML and ATN, with excellent sensitivity and selectivity. Optimization of the experimental parameters yielded linear calibration curves in the range of 2.9-33 µmol L−1 for AML and 9.8-190 µmol L−1
for ATN, adequate for the quantification in different dosages of both antihypertensives in pharmaceutical formulations. Addition-recovery tests were satisfactory, with values similar to those obtained using a chromatographic method. The results demonstrate that the CP-BDDE possesses improved performance for the simultaneous determination of AML and ATN when compared with the GCE, CPE and
MWCNTsPE. Moreover, the reported results demonstrate that the combination of BDDE and SWV is a feasible alternative for the simultaneous determination of both antihypertensives in pharmaceuticals without previous separation, necessity of expensive apparatus, along with time-consuming sample preparations and also reducing the use and generation of toxic substances and mathematical approaches. Finally, this method is an attractive alternative because of its high sensitivity, relatively low cost, simplicity, environment-friendly and speed, which can be easily and conveniently adopted for routine quality control analysis.
Acknowledgments
The authors gratefully acknowledge financial support and scholarships from the Brazilian funding agencies CNPq (Proc. 445841/2014-1), CAPES and Fundação Araucária do Paraná. Special thanks to Prof Ieda Spacino Scarminio for her kind help with chromatography measurements and to DIA laboratory for the availability of use of chromatograph.
References
1. Hardman, J. G.; Limbird, L. E.; Gilman A. G.; Goodman & Gilman’s The Pharmacological Basis of Therapeutics, 9th ed.; McGraw-Hill: New York, 1996.
2. Barman, R. K.; Islam, M. A. U.; Ahmed, M. M.; Wahed, I. I.; Islam, R.; Khan, A.; Hossain, M. B.; Rahman, B. M.; Pak. J. Pharm. Sci.2007, 20, 274.
3. Argekar, A. P.; Powar, S. G.; J. Pharm. Biomed. Anal. 2000,
21, 1137.
4. Aryal, S.; Skalko-Basnet, N.; Acta Pharm. 2008, 58, 299.
5. Pawar, P. Y.; Mane, B. Y.; Auti, S. M.; Trivedi, V. V.; Der Pharma Chem. 2013, 5, 97.
6. Rathee, P.; Rathee, S.; Thakur, S.; Kumar, V.; Int. J. ChemTech Res. 2010,2, 62.
7. British Pharmacopoeia; HMSO: London, 1980.
8. Mansano, G. R.; Eisele, A. P. P.; Sartori, E. R.; Anal. Methods
2015,7, 1053.
Table 4. Results obtained in the simultaneous determination of AML and ATN in combined dosage forms using the proposed method compared with HPLC
Samples Analyte Amount / (mg per tablet)
a
Eb / % F
calcc
Label HPLC SWV
A AML 6.9 6.9 ± 0.2 6.8 ± 0.2 –1.4 1.0
ATN 25 24.5 ± 0.7 25.4 ± 0.3 3.7 5.4
B AML 6.9 6.8 ± 0.1 7.1 ± 0.3 4.4 9.0
ATN 50 50.7 ± 0.6 49.0 ± 0.3 –3.4 4.0
aAverage of 3 measurements; b100 × (SWV method – comparative method / comparative method); ccritical F-value = 19 (95% confidence level). HPLC:
9. Goyal, R. N.; Gupta, V. K.; Bachheti, N.; Anal. Chim. Acta
2007, 597, 82.
10. Goyal, R. N.; Gupta, V. K.; Chatterjee, S.; Electrochim. Acta
2008, 53, 5354.
11. Goyal, R. N.; Gupta, V. K.; Chatterjee, S.; Talanta2008, 76, 662.
12. Goyal, R. N.; Gupta, V. K.; Bachheti, N; Sharma, R. A.;
Electroanal.2008, 20, 757.
13. Švorc, L.; Cinkova, K.; Sochr, J.; Vojs, M.; Michniak, P.; Marton, M.; J. Electroanal. Chem.2014, 728, 86.
14. Santos, M. C. G.; Tarley, C. R. T.; Dall’Antonia, L. H.; Sartori, E. R.; Sens. Actuators, B2013,188, 263.
15. Scremin, J.; Karimi-Maleh, H.; Sartori, E. R.; Anal. Methods
2015, 7, 3750.
16. Santos, S. B.; Valezi, C. F.; Scremin, J.; Salamanca-Neto, C. A. R.; Dall’Antonia, L. H.; Sartori, E. R.; Quim. Nova 2014,
37, 1579.
17. Gimenes, D. T.; Marra, M. C.; Freitas, J. M.; Muñoz , R. A. A.; Richter, E. M.; Sens. Actuators, B 2015, 212, 411.
18. Lima, A. B.; Faria, E. O.; Montes, R. H. O.; Cunha, R. R.; Richter, E. M.; Muñoz, R. A. A.; Santos, W. T. P.; Electroanal.
2013, 25, 1585.
19. Figueiredo-Filho, L. C. S.; Sartori, E. R.; Fatibello-Filho, O.;
Anal. Methods2015, 7, 643.
20. Sartori, E. R.; Medeiros, R. A.; Rocha-Filho, R. C.; Fatibello-Filho, O.; Talanta 2010, 81, 1418.
21. Hegde, R. N.; Kumara-Swamy, B. E.; Sherigara, B. S.; Nandibewoor, S. T.; Int. J. Electrochem. Sci. 2008, 3, 302.
22. Patil, R. H.; Hegde, R. N.; Nandibewoor, S. T.; Ind. Eng. Chem. Res. 2009, 48, 10206.
23. Cervini, P.; Ramos, L. A.; Cavalheiro, E. T. G.; Talanta 2007,
72, 206.
24. Shamsipur, M.; Saber, R.; Emami, M.; Anal. Methods 2014, 6, 7038.
25. Stoiljkovic, Z. Z.; Avramov Ivic, M. L.; Petrovic, S. D.; Mijin, D. Z.; Stevanovic, S. I.; Lacnjevac, U. C.; Marinkovic, A. D.;
Int. J. Electrochem. Sci. 2012, 7,2288.
26. Kazemipour, M.; Ansari, M.; Mohammadi, A.; Beitollahi, H.; Ahmadi, R.; J. Anal. Chem. 2009, 64, 65.
27. Emami, M.; Shamsipur, M.; Saber, R.; J. Solid State Electrochem. 2014, 18, 985.
28. Suffredini, H. B.; Pedrosa, V. A.; Codognoto, L.; Machado, S. A. S.; Rocha-Filho, R. C.; Avaca, L. A.; Electrochim. Acta
2004, 49, 4021.
29. Salamanca-Neto, C. A. R.; Hatumura, P. H.; Tarley, C. R. T.; Sartori, E. R.; Ionics 2015, 21, 1615.
30. Long, G. L.; Winefordner, J. D.; Anal. Chem. 1983, 55, 712.
31. Goyal, R. N.; Gupta, V. K.; Oyama, M.; Bachheti, N.;
Electrochem. Commun. 2006, 8, 65.
32. Goyal, R. N.; Bishnoi, S.; Bioelectrochemistry 2010, 79, 234. 33. Bard, A. J.; Faulkner, L. R.; Electrochemical Methods:
Fundamentals and Applications, 2nd ed.; John Wiley & Sons: New York, 2001.
34. Li, C.; Colloids Surf., B 2007, 55, 77.
35. Hiremath, G. C.; Kulkarni, R. M.; Nandibewoor, S. T.; Indian J. Chem. 2005, 44, 245.
36. Eisele, A. P. P.; Mansano, G. R.; Oliveira, F. M.; Casarin, J.; Tarley, C. R. T.; Sartori, E. R.; J. Electroanal. Chem. 2014, 732, 46.
37. Miyano, D. M.; Lima, T.; Simões, F. R.; La-Scalea, M. A.; Oliveira, H. P. M.; Codognoto, L.; J. Braz. Chem. Soc. 2013,
25, 602.
38. Gosser, D. K.; Cyclic Voltammetry; VCH Publishers: New York,
1994.
39. Mansano, G. R.; Eisele, A. P. P.; Dall’Antonia, L. H.; Afonso, S.; Sartori, E. R.; J. Electroanal. Chem. 2015, 738, 188.
40. Anderson, R. L.; Practical Statistics for Analytical Chemists;
Van Nostrand Reinhold: New York, 1987.