Article
Printed in Brazil - ©2016 Sociedade Brasileira de Química0103 - 5053 $6.00+0.00*e-mail: [email protected]
Pesticide Residues Method Validation by UPLC-MS/MS for Accreditation Purposes
Ionara R. Pizzutti,*,a Jonatan V. Dias,a André de Kok,b Carmem D. Cardosoa and
Giovana M. E. Velaa
aCentro de Pesquisa e Análise de Resíduos e Contaminantes (CEPARC), Departamento de Química,
Universidade Federal de Santa Maria (UFSM), 97105-900 Santa Maria-RS, Brazil
bNetherlands Food and Consumer Product Safety Authority (NVWA), Chemistry Laboratory,
R&D Group, National Reference Laboratory (NRL) for Pesticide Residues in Food and Feed, 6708 WB, Wageningen, Netherlands
The development and validation of an analytical method for the determination of 51 pesticides in tomato using UPLC-MS/MS (ultra performance liquid chromatography coupled to tandem mass spectrometry) was performed in order to fulfill the requirements of the NBR ISO/IEC 17025:2005. The goal of the validation was to evaluate all required parameters, such as linearity of analytical curves, instrument and method limits of detection and quantification, matrix effect and accuracy (trueness and precision). Stock solutions of the pesticides were prepared in organic solvent by two different analysts independently, in order to validate this preparation by comparing the detector response areas of injections (n = 7). Pesticides were extracted from tomatoes applying the Dutch mini-Luke method with 30 mL of each solvent as acetone, petroleum ether as well as dichloromethane. A small aliquot of the organic solvent extract was evaporated and reconstituted in methanol with 0.1% of acetic acid (v/v) for UPLC-MS/MS analysis. The recovery experiments
were done by spiking blank samples at 10, 20 and 50 µg kg-1, performed by two analysts, seven
replicates for each concentration level plus the blank sample. From the 51 studied compounds, 46 showed recoveries within the acceptable range of 70-120% for all evaluated concentrations. For 82% of pesticides, the validated method limit of quantification was the lowest concentration
studied (10 µg kg-1). The intermediate precision was below 20% for all evaluated pesticides showing
excellent repeatability of the method.
Keywords: validation, accreditation, pesticides, Dutch mini-Luke method, UPLC-MS/MS
Introduction
Since 2008, Brazil has had the worrying position of being the largest consumer of pesticides in the world. According to the Ministry of Agriculture, Livestock and Supply (MAPA), in that year 673.9 t of these toxic products ended up in the environment.1
The extensive use of pesticides is a serious public health problem in developing countries, especially those with economies based on agribusiness, as is the case in Brazil. Two monitoring programs for pesticide residues are currently in place in Brazil aiming to evaluate compliance with national maximum residues levels (MRL). The Program on Pesticide Residues Analysis in Food (PARA), coordinated by the National Health Surveillance Agency (ANVISA), aims to analyze fruits and vegetables sold
at Brazilian market places. The National Residue and Contamination Control Program (PNCRC), coordinated by MAPA, intends to control animal products, as well as fruits and vegetables products that are destined mainly for exportation.2
Furthermore, there is a need to develop rapid and accurate analytical methods for determination of pesticide residues in agricultural products, including a wide range of pesticide groups, with very different properties (polar, non-polar, planar, acids, bases), and doing that in a single chromatographic run and one extraction per sample.3,4
Laboratory accreditation appears in this context as a powerful tool to demonstrate the ability of laboratories not only in the field of determining pesticides residues in foods, but in all areas where the presence of a quality management system is required to act accurately and effectively in order to demonstrate the ability of laboratories to solve problems that occur.
Laboratory accreditation is a way to determine the technical competence of laboratories to perform specific types of tests, measurements and calibration. It also provides formal recognition of competent laboratories, thus providing an easy way for customers to identify and select reliable testing, measurement and calibration services able to meet their needs.5
Many countries around the world have one or more organizations responsible for laboratory accreditation. Most of these organizations adopt the ISO/IEC 17025 norm6 as the basis for accrediting testing and calibration
laboratories.7
The General Accreditation Coordinator (CGCRE) linked to the National Institute of Metrology, Standardization and Industrial Quality (INMETRO) is the accreditation body for conformity assessment recognized by the Brazilian government, as laid down in decree No. 6275 of November 28, 2007. Therefore, CGCRE is, within the organizational structure of INMETRO, the main organizational unit that has full responsibility and authority over all aspects of the accreditation, including accreditation decisions.7
Laboratory accreditation by CGCRE is performed by the Laboratory Accreditation Division (DICLA), which performs activities related to the granting and maintenance of accreditation, in accordance with requirements of the
NBR ISO/IEC 17025 norm.8
Accreditation involves a complete review of all structural parts of the laboratory that contribute to generate accurate and reliable results. The criteria that the auditors refer for quality control are based on an international standard (ISO/IEC 17025:2005), which is applicable to all laboratories involved in sampling, development of new methods, testing and calibration. Official accreditation bodies use this international standard, published by the International Organization for Standardization (ISO), to ensure the parameters that influence the laboratory’s ability to generate precise and accurate results of tests and/or calibration, including adequate control of the procedures, quality, qualification, training and experience of all personnel involved, as well as proper maintenance and calibration of all equipment.9
Efficient management of the quality system enhances and improves development, competence and discipline of
the staff. The accreditation allows the laboratory, above all, to assess its performance using it as reference to demonstrate their technical competence through regular reviews.
To be accredited by an accreditation body, it is essential that the laboratory implement a Quality Management System, which is a set of minimum rules in order to guide each part of the organization to run its duties properly, in time and planning, and everything must be directed towards the common goal of the organization: customer satisfaction.
Thus, the objective of this study was to validate an analytical method for the simultaneous determination of 51 pesticide residues in tomatoes, in order to evaluate the method performance and the compliance of the laboratory according with ISO/IEC 17025 requirements.6
The validation for tomato as matrix is representative for all crops classified in the same commodity group, which is high water content matrices.10
Experimental
Reference standards, chemicals and reagents
Methanol, acetonitrile, toluene, acetone, petroleum ether, dichloromethane, acetic acid, all pesticide purity grade were purchased from J. T. Baker Chemical or Mallinckrodt (Phillipsburg and Center Valley, USA respectively). Pesticides reference standards were obtained from Dr. Ehrenstorfer (Augsburg, Germany). Sodium sulfate was obtained from UCT (Bristol, USA) and ammonium formate from Sigma-Aldrich (Seelze, Germany).
Preparation of analytical standard solutions
Stock solutions of individual pesticide reference
standards were prepared at 1000 mg L-1 in organic
solvent taking into account the solubility and purity of the standard. Reference standards were weighed directly into a 20 mL flask and the required volume of the appropriate solvent (preferably toluene or methanol and only if strictly necessary acetonitrile or acetone) was added using automated and calibrated pipettes. Finally, the solutions were placed for about 5 min in an ultrasonic bath in order to assure complete dissolution.
After the preparation of individual stock solutions, a stock mixture standard solution containing all 51 compounds was prepared at 1 mg L-1 in methanol containing 0.1% of acetic
over four different flasks in order to avoid contamination during handling. This solution was used to prepare all analytical standard solutions in organic solvent and in matrix blank extract for the linearity study of analytical curves.
Analytical solutions were stored in a freezer at 20 °C. Before use, all solutions were allowed to stand until room temperature was reached. Subsequently, the solutions were placed in an ultrasonic bath for 5 min.
In order to validate the stock solutions, they were prepared by two different analysts and their results were compared by UPLC-MS/MS (ultra performance liquid chromatography coupled to tandem mass spectrometry) measurement. The difference in detector response (peak area) of both solutions was calculated according to equation 1.
(1)
The criterion for the acceptable difference is < 10%, according to the SANCO document.10
UPLC-MS/MS experimental conditions
The UPLC-MS/MS system consisted of an ACQUITY UPLC coupled to a XEVO TQ-S (triple quadrupole) tandem mass spectrometer (Waters, Milford, USA).
Chromatographic separations were carried out using a BEH C18 column (2.1 mm × 100 mm, 1.7 µm particle size), maintained at 60 °C with a total run time of 14 min.
The mobile phases consisted of 0.3 g L-1 ammonium
formate solution (solvent A) and methanol (solvent B). The following gradient elution (0.45 mL min-1 flow rate)
was performed: 80% A at the injection time, decreasing linearly to 15% A over 11 min. This eluent composition was maintained for 1 min and then increased linearly to 80% A over 0.5 min. This condition was maintained until the end of the chromatographic run.
The mass spectrometer was operated in the positive electrospray ionization mode, ESI (+). The capillary voltage was settled at 3.00 kV. Desolvation gas temperature was 400 °C. Desolvation gas flow and cone gas flow were 500 and 150 L h-1, respectively. Collision gas flow was used at
0.15 mL min-1. Two MRM (multiple reaction monitoring)
transitions per analyte were monitored as can be seen in Table 1. One product ion was used for quantification and the ion ratio of both product ions was used for identification, with a ± 30% tolerance window (Table 1).10
Preliminary tuning experiments were carried out via direct infusion of individual diluted standard solutions (200 ng mL-1) into the mass spectrometer, in order to
establish the optimal detection conditions. The infusion flow rate was set at 5 µL min-1.
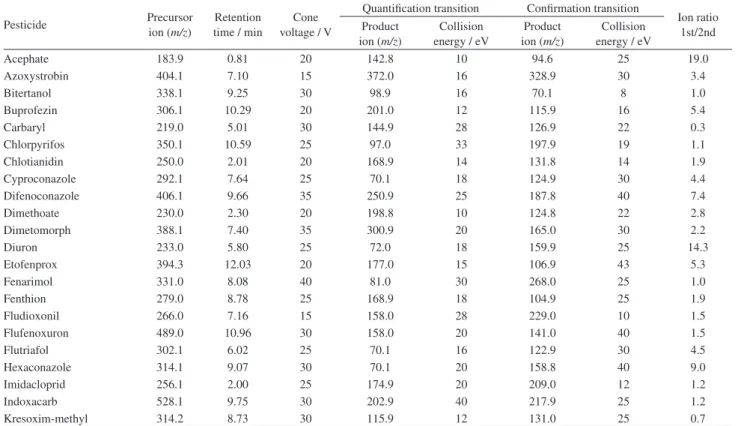
Table 1. Acquisition parameters for the pesticides analyzed by UPLC-MS/MS
Pesticide Precursor
ion (m/z)
Retention time / min
Cone voltage / V
Quantification transition Confirmation transition
Ion ratio 1st/2nd Product
ion (m/z)
Collision energy / eV
Product ion (m/z)
Collision energy / eV
Acephate 183.9 0.81 20 142.8 10 94.6 25 19.0
Azoxystrobin 404.1 7.10 15 372.0 16 328.9 30 3.4
Bitertanol 338.1 9.25 30 98.9 16 70.1 8 1.0
Buprofezin 306.1 10.29 20 201.0 12 115.9 16 5.4
Carbaryl 219.0 5.01 30 144.9 28 126.9 22 0.3
Chlorpyrifos 350.1 10.59 25 97.0 33 197.9 19 1.1
Chlotianidin 250.0 2.01 20 168.9 14 131.8 14 1.9
Cyproconazole 292.1 7.64 25 70.1 18 124.9 30 4.4
Difenoconazole 406.1 9.66 35 250.9 25 187.8 40 7.4
Dimethoate 230.0 2.30 20 198.8 10 124.8 22 2.8
Dimetomorph 388.1 7.40 35 300.9 20 165.0 30 2.2
Diuron 233.0 5.80 25 72.0 18 159.9 25 14.3
Etofenprox 394.3 12.03 20 177.0 15 106.9 43 5.3
Fenarimol 331.0 8.08 40 81.0 30 268.0 25 1.0
Fenthion 279.0 8.78 25 168.9 18 104.9 25 1.9
Fludioxonil 266.0 7.16 15 158.0 28 229.0 10 1.5
Flufenoxuron 489.0 10.96 30 158.0 20 141.0 40 1.5
Flutriafol 302.1 6.02 25 70.1 16 122.9 30 4.5
Hexaconazole 314.1 9.07 30 70.1 20 158.8 40 9.0
Imidacloprid 256.1 2.00 25 174.9 20 209.0 12 1.2
Indoxacarb 528.1 9.75 30 202.9 40 217.9 25 1.2
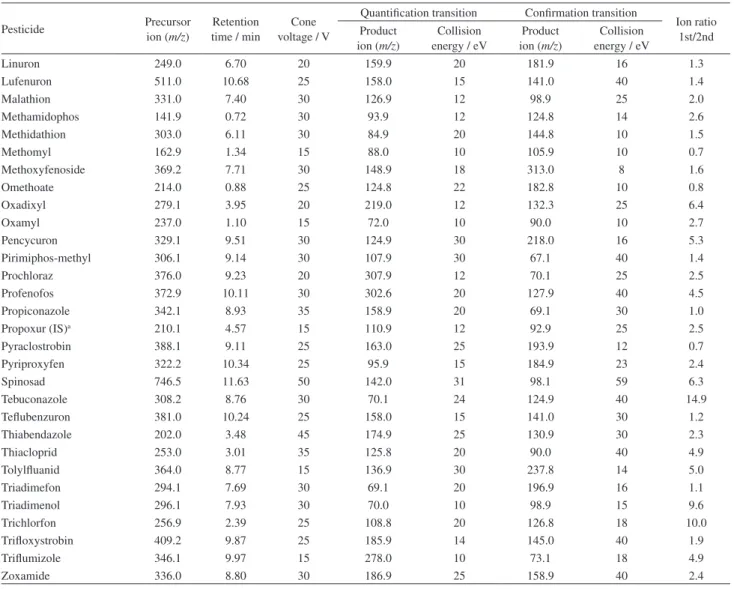
Table 1. Acquisition parameters for the pesticides analyzed by UPLC-MS/MS (cont.)
Pesticide Precursor
ion (m/z)
Retention time / min
Cone voltage / V
Quantification transition Confirmation transition
Ion ratio 1st/2nd Product
ion (m/z)
Collision energy / eV
Product ion (m/z)
Collision energy / eV
Linuron 249.0 6.70 20 159.9 20 181.9 16 1.3
Lufenuron 511.0 10.68 25 158.0 15 141.0 40 1.4
Malathion 331.0 7.40 30 126.9 12 98.9 25 2.0
Methamidophos 141.9 0.72 30 93.9 12 124.8 14 2.6
Methidathion 303.0 6.11 30 84.9 20 144.8 10 1.5
Methomyl 162.9 1.34 15 88.0 10 105.9 10 0.7
Methoxyfenoside 369.2 7.71 30 148.9 18 313.0 8 1.6
Omethoate 214.0 0.88 25 124.8 22 182.8 10 0.8
Oxadixyl 279.1 3.95 20 219.0 12 132.3 25 6.4
Oxamyl 237.0 1.10 15 72.0 10 90.0 10 2.7
Pencycuron 329.1 9.51 30 124.9 30 218.0 16 5.3
Pirimiphos-methyl 306.1 9.14 30 107.9 30 67.1 40 1.4
Prochloraz 376.0 9.23 20 307.9 12 70.1 25 2.5
Profenofos 372.9 10.11 30 302.6 20 127.9 40 4.5
Propiconazole 342.1 8.93 35 158.9 20 69.1 30 1.0
Propoxur (IS)a 210.1 4.57 15 110.9 12 92.9 25 2.5
Pyraclostrobin 388.1 9.11 25 163.0 25 193.9 12 0.7
Pyriproxyfen 322.2 10.34 25 95.9 15 184.9 23 2.4
Spinosad 746.5 11.63 50 142.0 31 98.1 59 6.3
Tebuconazole 308.2 8.76 30 70.1 24 124.9 40 14.9
Teflubenzuron 381.0 10.24 25 158.0 15 141.0 30 1.2
Thiabendazole 202.0 3.48 45 174.9 25 130.9 30 2.3
Thiacloprid 253.0 3.01 35 125.8 20 90.0 40 4.9
Tolylfluanid 364.0 8.77 15 136.9 30 237.8 14 5.0
Triadimefon 294.1 7.69 30 69.1 20 196.9 16 1.1
Triadimenol 296.1 7.93 30 70.0 10 98.9 15 9.6
Trichlorfon 256.9 2.39 25 108.8 20 126.8 18 10.0
Trifloxystrobin 409.2 9.87 25 185.9 14 145.0 40 1.9
Triflumizole 346.1 9.97 15 278.0 10 73.1 18 4.9
Zoxamide 336.0 8.80 30 186.9 25 158.9 40 2.4
aIS = internal standard.
Extraction procedure
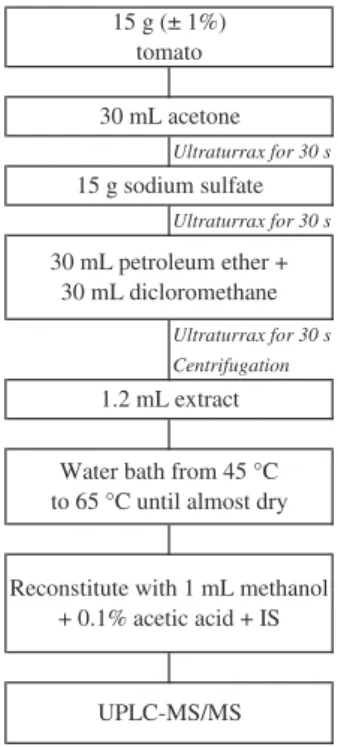
The method used for pesticides extraction from tomato was the acetone-based Dutch mini-Luke method issued by the Netherlands Food and Consumer Product Safety Authority.11,12 The Dutch mini-Luke method is a
miniaturized and optimized adaptation of the original Luke method developed in 1975.13 The miniaturization enabled
a considerable reduction of sample amount and solvents used, as well as analysis time.
Tomato samples were homogenized after stalk removal and 15 g (± 1%) were weighed into 250 mL Teflon® tubes.
Then, 30 mL of acetone was added and the mixture was homogenized with an ultraturrax for 30 s at 15,000 rpm. Sodium sulfate (15 g) was added and mixed with the ultraturrax for 30 s. After this step, 30 mL of petroleum ether and 30 mL of dichloromethane were added and
mixed (ultraturrax) for 30 s to induce partitioning. The tubes were centrifuged for 3 min at 20 °C and 3600 rpm. After centrifugation, 1.2 mL of extract was transferred to evaporation tubes and the organic solvent mixture was evaporated (stepwise first at 45 °C, then at 65 °C) until nearly dry. Complete dryness was achieved in a fume hood, letting the tubes stand at room temperature. Finally, 1 mL of methanol with 0.1% of acetic acid (v/v) and the internal standard (propoxur at 40 ng mL-1) was added to
reconstitute the extract using a vortex mixer. Figure 1 shows the extraction procedure.
Method validation
Calibration curves, linearity, limit of detection (LOD) and limit of quantification (LOQ)
Linearity of analytical curves was evaluated by injecting analytical solutions prepared in solvent (methanol with 0.1% of acetic acid, v/v) and in blank tomato extracts at 0.1, 0.2, 0.5, 1.0, 5.0, 20.0 and 100.0 ng mL-1.
First, the blank of solvents and reagents (extraction procedure without the presence of matrix and analytes) and matrix blank extract (matrix extraction without analytes) were injected. Then, the analytical solutions prepared in organic solvent and in blank matrix extract were injected. These solutions were injected in ascending concentration order to avoid carry over in the chromatographic system between injections. Furthermore, solutions in solvent and in blank matrix extract were injected alternately. This sequence was repeated seven times.
Using data obtained from the linearity study for each analyzed pesticide, the estimated instrument limit of detection (LODi) and method (LODm), as well as
estimated instrument limit of quantification (LOQi) and
method (LOQm) were calculated. The estimated LOQm was
evaluated against the target validated LOQm (10 µg kg-1).
Matrix effect evaluation
Components present in tomatoes (typically of natural origin) can influence the quantitative measurement of pesticides without being detected as interfering compounds. Some analytes are more affected than others.15,16
The matrix effect is the effect observed by the increase or decrease in detector response for a particular analyte present in the matrix extract compared to the detector response for the analyte in organic solvent.17
In this study, the matrix effect was evaluated in two different ways. The first way was by comparison of peak areas obtained from analytical solutions prepared in organic solvent and from those in blank matrix extract at each individual concentration, according to equation 2.
(2)
The second way was performed by comparing the slopes of the analytical curves obtained from solutions prepared in organic solvent and those in the blank matrix extract, and calculated via equation 3.
(3)
Using those two methods, it was possible to determine whether the matrix caused a positive (increase of the detector response) or negative effect (decrease of the detector response).
Accuracy and precision
In order to evaluate the accuracy (trueness) and precision of the method, recovery experiments were done. Blank tomatoes were spiked with a known amount of the mixture solution (1 mg L-1) to obtain a concentration
of all analytes studied at 10, 20 and 50 µg kg-1. For each
concentration, seven replicates were performed. Seven replicates of the blank sample extract were also prepared. Accuracy in terms of recovery percentage was calculated according to equation 4.
(4)
To evaluate the repeatability of the analytical method in terms of intermediate precision, the fortification and recovery tests were performed by two different analysts on different days. The trueness, expressed as average percentage recovery of seven replicates for each concentration was calculated for each pesticide studied.
Thereafter, the average of averages from the results of both analysts and the standard deviation for each concentration were calculated. From these results, the precision, expressed as RSD (relative standard deviation), was calculated for each level for each pesticide.
Results and Discussion
Selected internal standard
An internal standard is a chemical substance added to a known matrix portion or matrix extract in a specific step of the analysis in order to assess the correct execution of the test procedure (or part of it). The internal standard must be chemically stable and must preferably demonstrate similar behavior as of the target analytes.10
In pesticide residue analysis, the internal standard generally is a pesticide that has its use banned or a compound that is not found in the matrices. For this study, the pesticide propoxur (at 40 ng mL-1) was used,
which was also added to all analytical solutions. For the analytical curves as well as in the samples used to evaluate the accuracy and precision of the extraction method. This compound had the purpose of identifying potential losses and errors during the whole procedure.
Despite the use of propoxur as QC (quality control) internal standard, quantification was done via external calibration.
Validation of stock solutions
The preparation of stock solutions was considered satisfactory if the difference between the results from both analysts was less than ± 10%.10
For 43 of the 51 studied compounds, the difference (%) between areas of the same substance obtained from analysis of solutions prepared by two different analysts, were between –7.6 and 5.6%. These results show the excellent preparation procedure of stock solutions.
Method validation
Analytical curves and linearity
To evaluate the linearity of analytical curves, the solutions were prepared in organic solvent (methanol with 0.1% of acetic acid, v/v) and in blank tomato extract.
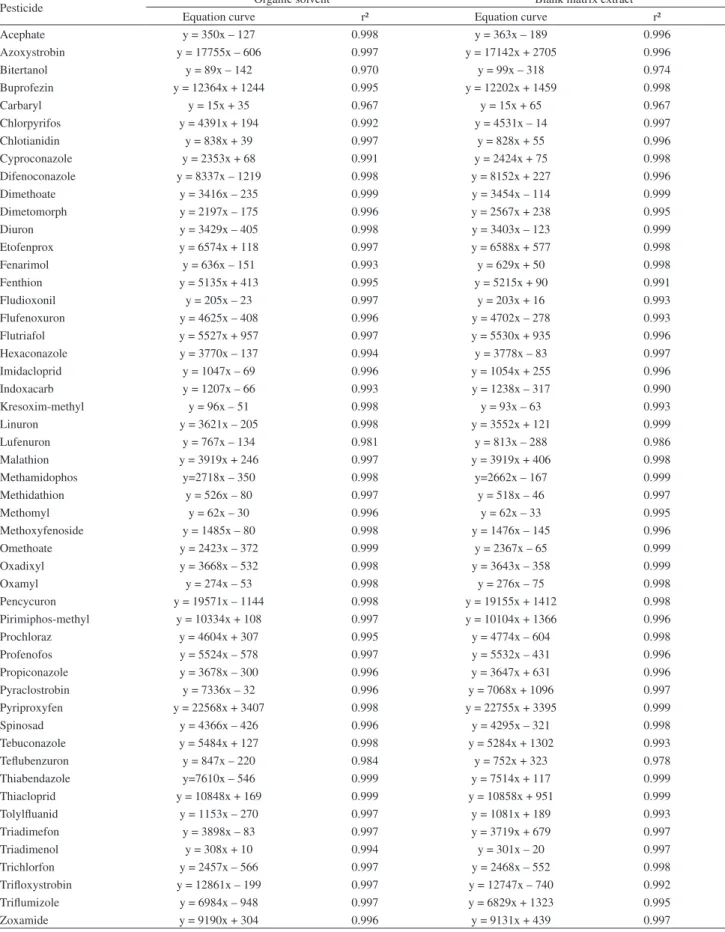
The determination coefficient (r²) value numerically expresses the percentage of total analytical signal variation due to the analyte concentration variation. This percentage varies from 0 to 100% and r² value ranges from 0 to 1. Ideally, the closer the percentage of the variance observed in the analytical signal by varying the concentration is to 100%, the closer the r² value will be to 1. Consequently, the quality of the calibration curve will be better, because the variation of the analytical signal as a function of analyte concentration will be more sensitive and best represented by the linear equation obtained.
As can be seen in Table 2 from the 51 studied compounds, both in organic solvent and in matrix extract, 47 (92%) showed a determination coefficient greater than or equal to 0.99. On the other hand, bitertanol, carbaryl, lufenuron and teflubenzuron showed r² between 0.96 and 0.99 for both analytical curves. These results are in accordance to INMETRO requirements.14
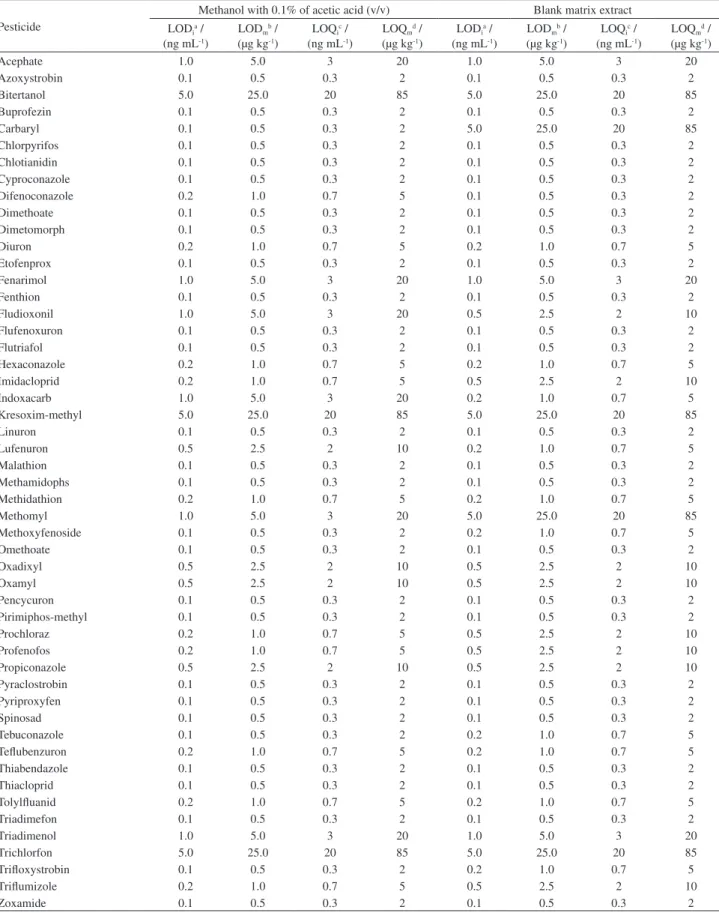
LOD and LOQ
Table 3 shows the limits of detection and quantification (of the instrument and method) calculated from individual solutions prepared in methanol with 0.1% of acetic acid (v/v) and in blank matrix extract.
For analytical solutions prepared in organic solvent, 28 of the 51 studied pesticides showed a LODi of 0.1 ng mL-1.
For 10, 4 and 6 compounds, the calculated LODi was 0.2,
0.5 and 1.0 ng mL-1, respectively.
For analytical solutions prepared in blank matrix extract, 25 of the studied pesticides showed a LODi of
0.1 ng mL-1. For the other 10, 8 and 3 compounds, the
calculated LODi was 0.2, 0.5 and 1.0 ng mL-1, respectively.
As can be seen in the Table 3 is possible to note that for some compounds the limits are much different when results in solvent are compared to blank matrix extract.
For carbaryl for example, the LODi when solutions
were prepared in blank matrix extract is 50 times greater compared to results when solutions were prepared in organic solvent.
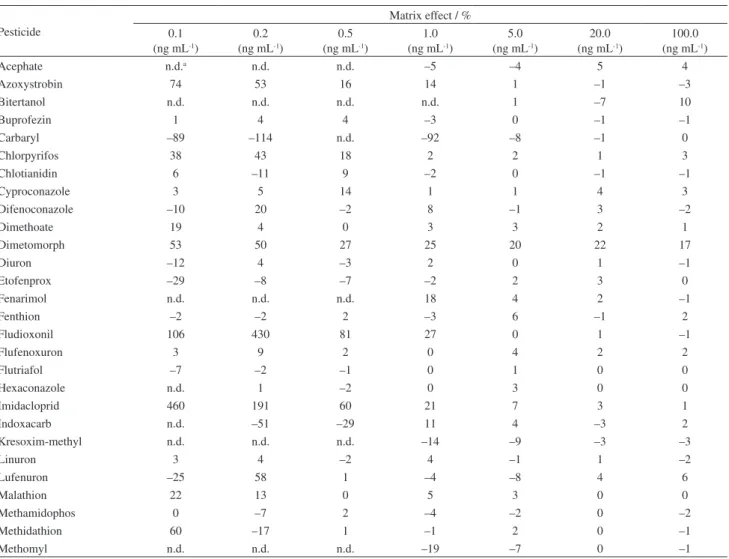
Matrix effect
The matrix effect is the effect observed by the increase or decrease in detector response for a particular analyte present in the matrix extract compared to the detector response for the analyte in organic solvent.18
For LC-MS/MS (liquid chromatography coupled to tandem mass spectrometry) analysis this effect is usually caused by interference of matrix components eluting near or at the same retention time of the analyte and competing with it during the ionization process. At low concentrations, the matrix effect can become significantly important, because there is a reduction in ionization due to lower analyte concentration in matrix.18
The matrix effect results were evaluated at each individual concentration of the analytical curves according to equation 2 at matrix effect evaluation section, as well as via analytical curves slope of standards in organic solvent and in matrix extract according to equation 3 (Table 3 and Figure 2, respectively).
Table 2. Linearity data of the target analytes: equation curve and determination coefficient (r²) of analytical curves obtained from solutions prepared in organic solvent (methanol/0.1% acetic acid) and in blank matrix extract
Pesticide Organic solvent Blank matrix extract
Equation curve r² Equation curve r²
Acephate y = 350x – 127 0.998 y = 363x – 189 0.996
Azoxystrobin y = 17755x – 606 0.997 y = 17142x + 2705 0.996
Bitertanol y = 89x – 142 0.970 y = 99x – 318 0.974
Buprofezin y = 12364x + 1244 0.995 y = 12202x + 1459 0.998
Carbaryl y = 15x + 35 0.967 y = 15x + 65 0.967
Chlorpyrifos y = 4391x + 194 0.992 y = 4531x – 14 0.997
Chlotianidin y = 838x + 39 0.997 y = 828x + 55 0.996
Cyproconazole y = 2353x + 68 0.991 y = 2424x + 75 0.998
Difenoconazole y = 8337x – 1219 0.998 y = 8152x + 227 0.996
Dimethoate y = 3416x – 235 0.999 y = 3454x – 114 0.999
Dimetomorph y = 2197x – 175 0.996 y = 2567x + 238 0.995
Diuron y = 3429x – 405 0.998 y = 3403x – 123 0.999
Etofenprox y = 6574x + 118 0.997 y = 6588x + 577 0.998
Fenarimol y = 636x – 151 0.993 y = 629x + 50 0.998
Fenthion y = 5135x + 413 0.995 y = 5215x + 90 0.991
Fludioxonil y = 205x – 23 0.997 y = 203x + 16 0.993
Flufenoxuron y = 4625x – 408 0.996 y = 4702x – 278 0.993
Flutriafol y = 5527x + 957 0.997 y = 5530x + 935 0.996
Hexaconazole y = 3770x – 137 0.994 y = 3778x – 83 0.997
Imidacloprid y = 1047x – 69 0.996 y = 1054x + 255 0.996
Indoxacarb y = 1207x – 66 0.993 y = 1238x – 317 0.990
Kresoxim-methyl y = 96x – 51 0.998 y = 93x – 63 0.993
Linuron y = 3621x – 205 0.998 y = 3552x + 121 0.999
Lufenuron y = 767x – 134 0.981 y = 813x – 288 0.986
Malathion y = 3919x + 246 0.997 y = 3919x + 406 0.998
Methamidophos y=2718x – 350 0.998 y=2662x – 167 0.999
Methidathion y = 526x – 80 0.997 y = 518x – 46 0.997
Methomyl y = 62x – 30 0.996 y = 62x – 33 0.995
Methoxyfenoside y = 1485x – 80 0.998 y = 1476x – 145 0.996
Omethoate y = 2423x – 372 0.999 y = 2367x – 65 0.999
Oxadixyl y = 3668x – 532 0.998 y = 3643x – 358 0.999
Oxamyl y = 274x – 53 0.998 y = 276x – 75 0.998
Pencycuron y = 19571x – 1144 0.998 y = 19155x + 1412 0.998
Pirimiphos-methyl y = 10334x + 108 0.997 y = 10104x + 1366 0.996
Prochloraz y = 4604x + 307 0.995 y = 4774x – 604 0.998
Profenofos y = 5524x – 578 0.997 y = 5532x – 431 0.996
Propiconazole y = 3678x – 300 0.996 y = 3647x + 631 0.996
Pyraclostrobin y = 7336x – 32 0.996 y = 7068x + 1096 0.997
Pyriproxyfen y = 22568x + 3407 0.998 y = 22755x + 3395 0.999
Spinosad y = 4366x – 426 0.996 y = 4295x – 321 0.998
Tebuconazole y = 5484x + 127 0.998 y = 5284x + 1302 0.993
Teflubenzuron y = 847x – 220 0.984 y = 752x + 323 0.978
Thiabendazole y=7610x – 546 0.999 y = 7514x + 117 0.999
Thiacloprid y = 10848x + 169 0.999 y = 10858x + 951 0.999
Tolylfluanid y = 1153x – 270 0.997 y = 1081x + 189 0.993
Triadimefon y = 3898x – 83 0.997 y = 3719x + 679 0.997
Triadimenol y = 308x + 10 0.994 y = 301x – 20 0.997
Trichlorfon y = 2457x – 566 0.997 y = 2468x – 552 0.998
Trifloxystrobin y = 12861x – 199 0.997 y = 12747x – 740 0.992
Triflumizole y = 6984x – 948 0.997 y = 6829x + 1323 0.995
Table 3. Estimated instrument and method LOD and LOQ, calculated from the data obtained from analytical solutions prepared in solvent (methanol with 0.1% of acetic acid, v/v) and in blank matrix extract
Pesticide
Methanol with 0.1% of acetic acid (v/v) Blank matrix extract LODia /
(ng mL-1)
LODmb /
(µg kg-1)
LOQic /
(ng mL-1)
LOQmd /
(µg kg-1)
LODia /
(ng mL-1)
LODmb /
(µg kg-1)
LOQic /
(ng mL-1)
LOQmd /
(µg kg-1)
Acephate 1.0 5.0 3 20 1.0 5.0 3 20
Azoxystrobin 0.1 0.5 0.3 2 0.1 0.5 0.3 2
Bitertanol 5.0 25.0 20 85 5.0 25.0 20 85
Buprofezin 0.1 0.5 0.3 2 0.1 0.5 0.3 2
Carbaryl 0.1 0.5 0.3 2 5.0 25.0 20 85
Chlorpyrifos 0.1 0.5 0.3 2 0.1 0.5 0.3 2
Chlotianidin 0.1 0.5 0.3 2 0.1 0.5 0.3 2
Cyproconazole 0.1 0.5 0.3 2 0.1 0.5 0.3 2
Difenoconazole 0.2 1.0 0.7 5 0.1 0.5 0.3 2
Dimethoate 0.1 0.5 0.3 2 0.1 0.5 0.3 2
Dimetomorph 0.1 0.5 0.3 2 0.1 0.5 0.3 2
Diuron 0.2 1.0 0.7 5 0.2 1.0 0.7 5
Etofenprox 0.1 0.5 0.3 2 0.1 0.5 0.3 2
Fenarimol 1.0 5.0 3 20 1.0 5.0 3 20
Fenthion 0.1 0.5 0.3 2 0.1 0.5 0.3 2
Fludioxonil 1.0 5.0 3 20 0.5 2.5 2 10
Flufenoxuron 0.1 0.5 0.3 2 0.1 0.5 0.3 2
Flutriafol 0.1 0.5 0.3 2 0.1 0.5 0.3 2
Hexaconazole 0.2 1.0 0.7 5 0.2 1.0 0.7 5
Imidacloprid 0.2 1.0 0.7 5 0.5 2.5 2 10
Indoxacarb 1.0 5.0 3 20 0.2 1.0 0.7 5
Kresoxim-methyl 5.0 25.0 20 85 5.0 25.0 20 85
Linuron 0.1 0.5 0.3 2 0.1 0.5 0.3 2
Lufenuron 0.5 2.5 2 10 0.2 1.0 0.7 5
Malathion 0.1 0.5 0.3 2 0.1 0.5 0.3 2
Methamidophs 0.1 0.5 0.3 2 0.1 0.5 0.3 2
Methidathion 0.2 1.0 0.7 5 0.2 1.0 0.7 5
Methomyl 1.0 5.0 3 20 5.0 25.0 20 85
Methoxyfenoside 0.1 0.5 0.3 2 0.2 1.0 0.7 5
Omethoate 0.1 0.5 0.3 2 0.1 0.5 0.3 2
Oxadixyl 0.5 2.5 2 10 0.5 2.5 2 10
Oxamyl 0.5 2.5 2 10 0.5 2.5 2 10
Pencycuron 0.1 0.5 0.3 2 0.1 0.5 0.3 2
Pirimiphos-methyl 0.1 0.5 0.3 2 0.1 0.5 0.3 2
Prochloraz 0.2 1.0 0.7 5 0.5 2.5 2 10
Profenofos 0.2 1.0 0.7 5 0.5 2.5 2 10
Propiconazole 0.5 2.5 2 10 0.5 2.5 2 10
Pyraclostrobin 0.1 0.5 0.3 2 0.1 0.5 0.3 2
Pyriproxyfen 0.1 0.5 0.3 2 0.1 0.5 0.3 2
Spinosad 0.1 0.5 0.3 2 0.1 0.5 0.3 2
Tebuconazole 0.1 0.5 0.3 2 0.2 1.0 0.7 5
Teflubenzuron 0.2 1.0 0.7 5 0.2 1.0 0.7 5
Thiabendazole 0.1 0.5 0.3 2 0.1 0.5 0.3 2
Thiacloprid 0.1 0.5 0.3 2 0.1 0.5 0.3 2
Tolylfluanid 0.2 1.0 0.7 5 0.2 1.0 0.7 5
Triadimefon 0.1 0.5 0.3 2 0.1 0.5 0.3 2
Triadimenol 1.0 5.0 3 20 1.0 5.0 3 20
Trichlorfon 5.0 25.0 20 85 5.0 25.0 20 85
Trifloxystrobin 0.1 0.5 0.3 2 0.2 1.0 0.7 5
Triflumizole 0.2 1.0 0.7 5 0.5 2.5 2 10
Zoxamide 0.1 0.5 0.3 2 0.1 0.5 0.3 2
aLOD
i = 3 × RSD × concentration; bLODm = LODi × dilution factor (5); cLOQi = LODi × 3.33 (rounded values); dLOQm = LOQi × dilution factor (5)
explained by the fact that in these low concentrations (0.1 to 1.0 ng mL-1), the pesticide amount is reduced
when compared to the higher concentrations of matrix compounds and, consequently, are most affected by the presence of these components.
On the other hand, all the compounds evaluated in this
study demonstrated a matrix effect between –20 and +20% when the calculation took only the slope of analytical curves into account, as can be seen in Figure 2. Thus, it is possible to conclude that the tomato matrix does not exert a significant effect on the detector signal from any of the analyzed compounds.
Figure 2. Matrix effect calculated from slopes differences of analytical curves obtained from solutions prepared in organic solvent and those prepared in blank matrix extract.
Table 4. Matrix effect calculated for each pesticide by injection of analytical solutions prepared in methanol (n = 7) and in blank matrix extract (n = 7)
Pesticide
Matrix effect / % 0.1
(ng mL-1)
0.2 (ng mL-1)
0.5 (ng mL-1)
1.0 (ng mL-1)
5.0 (ng mL-1)
20.0 (ng mL-1)
100.0 (ng mL-1)
Acephate n.d.a n.d. n.d. –5 –4 5 4
Azoxystrobin 74 53 16 14 1 –1 –3
Bitertanol n.d. n.d. n.d. n.d. 1 –7 10
Buprofezin 1 4 4 –3 0 –1 –1
Carbaryl –89 –114 n.d. –92 –8 –1 0
Chlorpyrifos 38 43 18 2 2 1 3
Chlotianidin 6 –11 9 –2 0 –1 –1
Cyproconazole 3 5 14 1 1 4 3
Difenoconazole –10 20 –2 8 –1 3 –2
Dimethoate 19 4 0 3 3 2 1
Dimetomorph 53 50 27 25 20 22 17
Diuron –12 4 –3 2 0 1 –1
Etofenprox –29 –8 –7 –2 2 3 0
Fenarimol n.d. n.d. n.d. 18 4 2 –1
Fenthion –2 –2 2 –3 6 –1 2
Fludioxonil 106 430 81 27 0 1 –1
Flufenoxuron 3 9 2 0 4 2 2
Flutriafol –7 –2 –1 0 1 0 0
Hexaconazole n.d. 1 –2 0 3 0 0
Imidacloprid 460 191 60 21 7 3 1
Indoxacarb n.d. –51 –29 11 4 –3 2
Kresoxim-methyl n.d. n.d. n.d. –14 –9 –3 –3
Linuron 3 4 –2 4 –1 1 –2
Lufenuron –25 58 1 –4 –8 4 6
Malathion 22 13 0 5 3 0 0
Methamidophos 0 –7 2 –4 –2 0 –2
Methidathion 60 –17 1 –1 2 0 –1
Pesticide
Matrix effect / % 0.1
(ng mL-1)
0.2 (ng mL-1)
0.5 (ng mL-1)
1.0 (ng mL-1)
5.0 (ng mL-1)
20.0 (ng mL-1)
100.0 (ng mL-1)
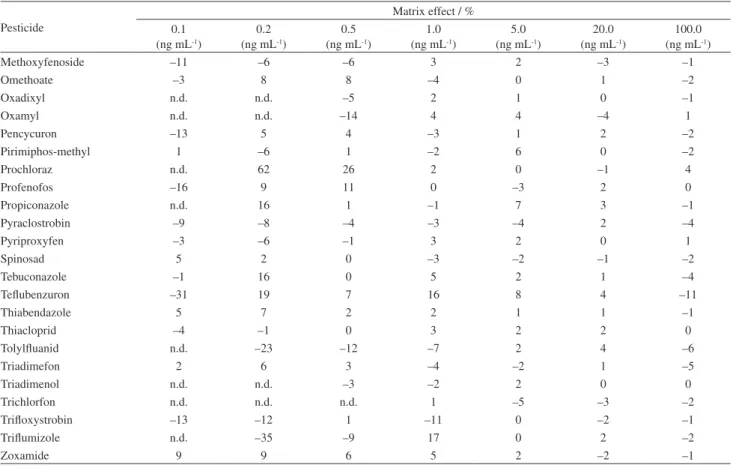
Methoxyfenoside –11 –6 –6 3 2 –3 –1
Omethoate –3 8 8 –4 0 1 –2
Oxadixyl n.d. n.d. –5 2 1 0 –1
Oxamyl n.d. n.d. –14 4 4 –4 1
Pencycuron –13 5 4 –3 1 2 –2
Pirimiphos-methyl 1 –6 1 –2 6 0 –2
Prochloraz n.d. 62 26 2 0 –1 4
Profenofos –16 9 11 0 –3 2 0
Propiconazole n.d. 16 1 –1 7 3 –1
Pyraclostrobin –9 –8 –4 –3 –4 2 –4
Pyriproxyfen –3 –6 –1 3 2 0 1
Spinosad 5 2 0 –3 –2 –1 –2
Tebuconazole –1 16 0 5 2 1 –4
Teflubenzuron –31 19 7 16 8 4 –11
Thiabendazole 5 7 2 2 1 1 –1
Thiacloprid –4 –1 0 3 2 2 0
Tolylfluanid n.d. –23 –12 –7 2 4 –6
Triadimefon 2 6 3 –4 –2 1 –5
Triadimenol n.d. n.d. –3 –2 2 0 0
Trichlorfon n.d. n.d. n.d. 1 –5 –3 –2
Trifloxystrobin –13 –12 1 –11 0 –2 –1
Triflumizole n.d. –35 –9 17 0 2 –2
Zoxamide 9 9 6 5 2 –2 –1
an.d. = not detected.
Table 4. Matrix effect calculated for each pesticide by injection of analytical solutions prepared in methanol (n = 7) and in blank matrix extract (n = 7) (cont.)
Recovery experiments
As can be seen in Figure 3, from the 51 studied pesticides, 45, 46 and 46 had an acceptable recovery percentage in the range from 70 to 120% for spike levels 10, 20 and 50 µg kg-1, respectively. One of the pesticides
(carbaryl) showed 64% recovery at 10 µg kg-1, but at 20
and 50 µg kg-1, the recovery values were 85 and 115%,
respectively. These values demonstrate the acceptable accuracy of the developed method.
Figure 3. Recoveries (%) for 51 evaluated pesticides spiked on blank tomato at 10, 20 and 50 µg kg-1.
Figure 4 shows the RSD values for the analyzed compounds at the studied spike concentrations. As can be seen, only four compounds (carbaryl, kresoxim-methyl, fludioxonil and triadimenol) showed RSD values above 20% at 10 µg kg-1. At 20 and 50 µg kg-1, only one compound
(carbaryl) had an RSD greater than 20%.
As for the method LOQ (Figure 5), the validated
LOQm (showing recovery and RSD values within the
acceptable range) was 10 µg kg-1 for 42 compounds.
triadimenol), the LOQm was 20 µg kg-1 and for three others
(acephate, methamidophos and omethoate), 50 µg kg-1.
For only one compound (carbaryl) the LOQm could not be
established because the performance criteria were not met, that is, recovery outside 70-120% range and/or RSD > 20% for all three studied concentrations.
Two compounds (bitertanol and triflumizole) were not detected in any of the three spiked concentrations.
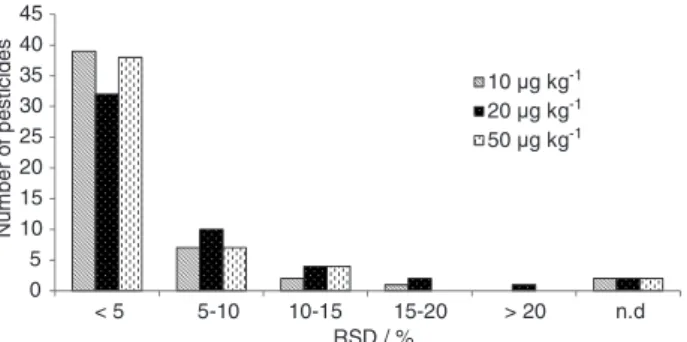
Intermediate precision
Intermediate precision of the developed method was evaluated varying two parameters: different analysts and different days. For all the studied pesticides, the RSD values for intermediate precision were within the acceptable range, except for the spike level of 20 µg kg-1 for carbaryl that
showed 78% of RSD.
Figure 6 shows the frequency distribution for the number of compounds, within various RSD ranges, for each spike concentration studied. As can be seen in this figure, only one pesticide (carbaryl) showed an RSD value above 20% at 20 µg kg-1. Two pesticides (bitertanol and
triflumizole) were not detected in any of the three spiked concentrations.
Conclusions
Laboratory accreditation provides recognition by official bodies for a laboratory’s technical competence in
performing particular services. For the accreditation of testing laboratories, it is necessary to validate methods developed in the laboratory itself to prove its ability to perform certain analyses through validation parameters required by the official accreditation standard for testing laboratories, the ISO/IEC 17025 norm.
For this purpose, a method for determination of 51 pesticides was developed and validated according to the parameters required by the Brazilian accreditation body (INMETRO/CGCRE) and in accordance with ISO/IEC 17025 as a prerequisite for laboratory application to be accredited.
Validation parameters were studied following the official document of Accreditation General Coordination, an agency of INMETRO responsible for laboratories accreditation.
The extraction method used for analysis was the Dutch mini-Luke method based on extraction using acetone and partitioning with petroleum ether and dichloromethane. After the evaporation and reconstitution step in appropriate solvent, the samples were analyzed by ultra-performance liquid chromatography coupled to tandem mass spectrometry (UPLC-MS/MS).
The validated method showed very good performance for most of the studied analytes in terms of sensitivity, accuracy, precision and linearity except for bitertanol, triflumizole and carbaryl and, for this reason the scope of the method was reduced for 48 pesticides. After all evaluated criteria, the method showed to be appropriate to determine pesticide residues in high water content matrices.
Acknowledgments
We gratefully acknowledge CNPq, FINEP, CAPES, MAPA, MCTI, FAPERGS/CAPES 0219/2015 and NVWA.
References
1. http://www.coepbrasil.org.br/portal/Publico/apresentarArquivo. aspx?ID=1efd7f1f-d132-426e-8644-29004872b236 accessed on December 2015.
2. Reichert, B.; Pizzutti, I. R.; Costabeber, I. H.; Uclés, A.; Herrera, S.; Fernández-Alba, A. R.; Talanta2015, 134, 415. 3. Camino-Sánchez, F. J.; Zafra-Gómez, A.; Ruiz-García, J.;
Bermúdez-Peinado, R.; Ballesteros, O.; Navalon, A.; Vílchez, J. L.; J. Food Compos. Anal. 2011, 24, 427.
4. Pizzutti, I. R.; Kok, A.; Cardoso, C. D.; Reichert, B.; Kroon, M.; Wind, W.; Righi, L. W.; Silva, R. C.; J. Chromatogr. A2012, 1251, 16.
5. http://ilac.org/publications-and-resources/ilac-documents/ promotional-brochures/ accessed on December 2015.
Figure 5. Number of pesticides that showed a LOQm of 10, 20 or 50 µg kg-1
(n.f.r. = not fulfilling requirements; n.d. = not detected).
6. ISO/IEC 17025: General requirements for the competence of testing and calibration laboratories, ISO: Geneva, 2005. 7. http://ilac.org/publications-and-resources/ilac-documents/
promotional-brochures/ accessed on April 2015.
8. http://inmetro.gov.br/credenciamento/sobre_lab.asp accessed on May 2015.
9. Saeger, S. D.; Determining mycotoxin and mycotoxigenic fungi in food and feed, 1st ed.; Woodhead Publishing, Cambridge,
2011.
10. SANCO/12571/2013: Guidance document on analytical quality control and validation procedures for pesticide residue analysis
in food and feed. European Commission: Brussels, 2013. 11. General Inspectorate for Health Protection; Analytical Methods
for Pesticide Residues in Foodstuffs, 6th ed.; The Netherlands:
Ministry of Public Health, Welfare and Sport, 1996. 12. Hiemstra, M.; Kok, A.; J. Chromatogr. A2007, 1154, 3. 13. Luke, M. A.; Frober, J. E.; Masumoto, H. T.; J. AOAC Int. 1975,
56, 1020.
14. DOQ-CGCRE-008: Orientation of analytical methods validation, INMETRO: Rio de Janeiro, 2011.
15. Fernández-Alba, A. R.; Chromatographic-Mass Spectrometric Food Analysis for Trace Determination of Pesticide Residues -
Wilson & Wilson’s comprehensive analytical chemistry, 1st ed.;
Elsevier:Amsterdam, 2005.
16. Pizzutti, I. R.; Kok, A.; Schoten, J.; Righi, L. W.; Cardoso, C. D.; Rohers, G. N.; Silva, R. C.; Talanta2014, 129, 352. 17. Pizzutti, I. R.; Kok, A.; Hiemstra, M.; Wickert, C.; Prestes,
O. D; J. Chromatogr. A2009, 1216, 4539.
18. Pizzutti, I. R.; Kok, A.; Zanella, R.; Adaime, M. B.; Hiemstra, M.; Wickert, C.; Prestes, O. D; J. Chromatogr. A
2007, 1142, 123.
Submitted: October 7, 2015
Published online: January 20, 2016