Article
J. Braz. Chem. Soc., Vol. 26, No. 4, 713-722, 2015. Printed in Brazil - ©2015 Sociedade Brasileira de Química 0103 - 5053 $6.00+0.00
A
*e-mail: [email protected]
Simultaneous Determination of Ascorbic Acid, L-Dopa, Uric Acid, Insulin, and
Acetylsalicylic Acid on Reactive Blue 19 and Multi-Wall Carbon Nanotube Modified
Glassy Carbon Electrode
Navid Nasirizadeh,* Zahra Shekari, Masoumeh Tabatabaee and Masoud Ghaani
Scientific Society of Nanotechnology, Yazd Branch, Islamic Azad University, Yazd, Iran
A trifunctional electrochemical sensor was fabricated for simultaneous determination of ascorbic acid (AA), levodopa (LD), and insulin. This was done by modifying a glassy carbon electrode (GCE) with multi-walled carbon nanotubes and reactive blue 19 (RB-MWCNT-GCE). Cyclic voltammetry was used to investigate the redox properties of this modified electrode. The electro-catalytic activity of the modified electrode was studied for the oxidation of AA, LD, and insulin. By differential pulse voltammetry (DPV), the detection limits of AA, LD, and insulin were estimated to be 0.45 µmol L−1, 0.37 µmol L−1, and 0.25 µmol L–1, respectively. In DPV
measurements, the RB-MWCNT-GCE could separate the oxidation peak potentials of AA, LD, uric acid (UA), insulin, and acetylsalicylic acid (ASA) in a mixture. The practical utility of this modified electrode was demonstrated by detecting AA, LD, UA, insulin, and ASA in real samples.
Keywords: trifunctional, ascorbic acid, L-dopa, uric acid, insulin
Introduction
Ascorbic acid (AA), or vitamin C, plays a key role in health care. It is well known for its ability to increase high-density lipoprotein production, to down-regulate cholesterol and triglyceride synthesis, to lower blood sugar and insulin requirements, and, thus, to reduce the risk for cardiovascular diseases.1 Uric acid (UA) is the primary
end product of purine metabolism.2 Extreme abnormalities
of UA levels indicate symptoms of several diseases, such as gout, hyperuricemia, leukemia, pneumonia, and Lesch-Nyhan.3,4 UA also coexists with AA in biological
fluids such as blood and urine.5 These compounds, which
usually coexist together in living systems, play important roles in physiological functions of organisms.6 Levodopa
(L-dopa, LD) is an important chemical substance used in the treatment of Parkinson’s disease.7 Moreover, LD
administration may elevate the uric acid concentration in the serum by preventing its renal excretion.8
Insulin is an important polypeptide hormone that controls the metabolism of glucose.9 It serves as a predictor
of diabetes in patients with insulinoma or trauma.10 The
cellular uptake of vitamin C is promoted by insulin and inhibited by hyperglycemia.11 In addition, insulin
hypoglycemia decreases the concentration of uric acid in the whole blood, serum, and plasma.12 So, determination
of this compound is greatly important for the clinical diagnosis of diabetes.13
Acetylsalicylic acid (ASA), or aspirin, is one of the oldest and most popular pharmaceuticals with anti-inflammatory, antipyretic, and analgesic functions.14 ASA is known to have
a bimodal effect on the renal handling of UA. High doses are uricosuric, while low doses cause UA retention.15 Also,
the addition of ascorbic acid to aspirin improves measures of gastrointestinal damage and oxidative stress.16 Furthermore,
the influence of salicylate compounds on insulin sensitivity is multifunctional, especially in high doses, and involves both beneficial and deleterious effects depending on the species and experimental models studied.17
Nowadays, there are intensive investigations carried out on chemically modified electrodes (CMEs).18 Electrode
surface modification has certain advantages. For example, a chemically modified electrode is less prone to surface fouling compared to a bare electrode. It also reduces the overvoltage and overcomes the slow kinetics of many electrode processes, thus facilitating the electrochemistry of redox biological compounds, which generally results in increased selectivity and sensitivity of determinations.19 In
Each electrochemical function can catalyse one analyte; therefore, at the surface of a modified electrode with multi-electrochemical functions, several analytes can be catalysed. Unifunctional or multi-functional modified electrodes have the ability to simultaneously determine different analytical samples. This may be regarded as another advantage of CMEs.20,21 So far, various articles have been published
regarding modified electrodes with one electrochemical function,22-24 but there are just a few studies ever done on
bifunctional and trifunctional electrochenmical sensors.25,26
Moreover, quinones have fundamental importance in the modification of electrodes. These compounds have cardinal role in biological electron transport and in industrial processes as redox catalysts.27 Thus, different quinone
derivatives have been employed as mediators in the study of the electrocatalytic reduction or oxidation and simultaneous determination of various samples.28-30 Reactive blue 19 (RB)
is a reactive dye mainly used for dyeing cellulosic fibers. This compound has an anthraquinone electroactive moiety (Scheme 1) which makes a good material for modification of electrodes, but the electrochemical behavior and electrocatalytic effect of RB have not been reported, so far. The present work describes the fabrication of a new modified glassy carbon electrode (GCE) based on a reactive blue 19 and multi-wall carbon nanotube modified glassy carbon electrode (RB-MWCNT-GCE), as a trifunctinal electrocatalyst for sensitive determination of AA, LD, and insulin. The used RB has four quasi-reversible redox pair. Based on obtained results in the present work, RB has good electrocatalytic effect for three analytes (AA, LD and insulin). Therefore, it seems that using RB as a modifier could be important enough to yield some new information about the catalysis of slow reactions. Additionally, the fabricated modified electrode was applied for simultaneous determination of AA, LD, UA, insulin, and ASA in mixture. To the best of our finding, there is no report in the literature yet about the use of trifunctional electrochemical sensors for oxidation of AA, LD, and insulin or simultaneous determination of AA, LD, UA, insulin, and ASA. Finally, this sensor was successfully applied to determine these compounds in real samples.
Experimental
Apparatus and chemicals
The electrochemical experiments were done using a µAutolab (Eco-Chemie, Ultrecht, and the Netherlands) potentiostat PGSTAT 30 equipped with GPES 4.9 in conjunction with a three-electrode system and a personal computer for data storage and processing. A conventional
three-electrode cell was used. An Ag/AgCl/KCl (3.0 mol L−1)
electrode, a platinum wire, and a RB-MWCNT-GCE were used as the reference, auxiliary, and working electrodes respectively. Also, pH measurements were done with a Metrohm model 827 pH/mV meter.
All the chemicals including AA, LD, UA, insulin, SA, dimethyl formamide (DMF), and the others had analytical reagent grades and were purchased from Merck Company. Also, the RB was obtained from Sigma-Aldrich. The multi-wall carbon nanotubes (purity of N95%, diameter of 10-20 nm, and length of 5-20 µm) were obtained from Nanolab Inc. (Brighton, MA). The phosphate buffer solutions (0.10 mol L–1) were prepared from H
3PO4 and
NaOH solutions using a pH meter.
Preparation of modified electrodes
Prior to modification, a bare GCE was mechanically polished with alumina powder (0.05 µm) to mirror finish and rinsed with doubly distilled water. The freshly cleaned GCE was electrochemically activated in a 0.10 mol L−1
sodium bicarbonate solution by continuous potential cycling from −1.45 to 1.7 V at a scan rate of 100 mV s−1.
To prepare a multi-wall carbon nanotube modified glassy carbon electrode (MWCNT-GCE), the activated GCE (AGCE) was rinsed with doubly distilled water, and 3 µL (1.0 mg mL−1) of an MWCNT-DMF solution was
placed directly onto the AGCE surface and dried at room temperature. An RB-MWCNT-GCE was prepared by immersing the MWCNT-GCE in a 0.10 mmol L−1 solution
of RB in a 0.10 mol L−1 phosphate buffer (pH 7.0) and
modified by 16 cycles of a potential sweep in the range of
−0.25 and 0.7 V at 20 mV s−1. To prepare an RB-GCE, the
AGCE was placed in a 0.10 mmol L−1 solution of RB in a
0.10 mol L−1 phosphate buffer (pH 7.0) and was modified in
the same procedure as described for the RB-MWCNT-GCE.
Results and Discussion
Characterization of RB-MWCNT-GCE
The effects of different experimental variables in the immobilization of RB were investigated to optimize
the testing performance. In other words, the effects of the MWCNT amounts, the modifier solution pH, its concentration, the potentials scan rate, and the number of potential recyclings were examined on the performance of modified electrode, and the anodic surface coverage was used as a measure of the surface deposited RB. The surface coverage (Γ) of the modified electrode was determined from the following equation, Γ = Q/nFA, where Q is the charge obtained by integrating the anodic or cathodic peak under the background correction and other symbols have their usual meanings, assuming an n value of 2. Table 1 illustrates the effect of different experimental conditions involved in the fabrication of RB-MWCNT-GCE. However, assuming that no interaction can exist between the variables, the one-at-a-time procedure31 was used for optimization. The results
of Table 1 show that the best surface coverage was obtained when the modification was carried out in a 1.0 mmol L−1
RB solution with pH 7.0 (0.1 mol L−1 phosphate buffer)
and the potential scan rate was 20 mV s−1.
The effect of the potential scan rate on the electrochemical properties of the RB-MWCNT-GCE was studied by cyclic voltammetry. Figure 1 shows the cyclic voltammograms of the RB-MWCNT-GCE in a 0.10 mol L−1 phosphate buffer
solution (pH 7.0) at various potential scan rates. As it can be seen, four well-defined redox couples corresponding to the electrodeposited RB appear when the potential scan is done over the range of −250 mV to 700 mV. Moreover, the plots of the anodic and cathodic peak currents versus the scan rate show a linear relationship for each of the four redox pairs [Figures S1A-D in the Supplementary Information (SI) section] as predicted theoretically for a surface-immobilized redox couple. In addition, the peak-to-peak potential separation (∆Ep = Epa − Epc) is small for each
of the four redox pairs, about 30, 60, 16, and 25 mV for scan rates below 200, 200, 100, and 100 mV s−1 for redox
pairs I, II, III, and IV, respectively (Figures S1E-H, in the SI section).
However, at higher scan rates, the separation between the peak potentials increases with the increase of scans rates (Figure S1I-L in the SI section), is indicating the limitation arising from the charge transfer kinetics. Moreover, the scan rate inevitably induces the increase of the ohmic drop which, in turn, makes the shift of peak potential in larger value dependent on the ohmic drop as well as the slow kinetic electron transfer.32
In other words, this is the range in which the reaction appears as quasi-reversible.33 The charge transfer
coefficient, α, and the apparent heterogeneous charge
Table 1. Variations in anodic peak surface coverage, Γ, as a function of MWCNT amounts, RB solution pH, RB solution concentration, [RB], potential scan rates, v, and number of cycles of potential scan, number of cycles, during the modification step. In all cases, the scan rate was 20 mV s−1 and the
surface coverage is in 10-11 mol cm−1
MWCNT amount /
(mg mL−1) Γ pH Γ [RB] / (mmol L
−1) Γ v / (mV s−1) Γ No. of cycles Γ
0.2 6.8 3 8.5 0.2 2.1 10 12.9 2 13.3
0.4 8.2 4 9.6 0.4 6.4 15 13.4 4 14.5
0.6 9.5 5 10.2 0.6 10.7 20 15.5 6 15.2
0.8 10.6 6 11.1 0.8 12.6 30 10.7 8 16.1
1.0 11.4 7 12.5 1.0 14.1 40 9.6 10 15.8
1.2 11.4 8 9.8 1.2 13.9 50 6.2 12 15.5
1.4 11.2 9 6.9 1.4 14.0 60 4.9 14 15.7
Figure 1. Cyclic voltammetric responses of the RB-MWCNT-GCE in a 0.1 mol L−1 phosphate buffer solution (pH 7.0) at different potential scan
transfer rate constant, ks, for the electron transfer between
the electrode (MWCNT) and a surface-confined redox couple of RB can be evaluated in cyclic voltammetry. According to the method described by Laviron,34 the
evaluation is made on the basis of the variation of the anodic and cathodic peak potentials with the logarithm of scan rates. This theory predicts a linear dependence of Ep upon
log ν for high scan rates, which can be used to extract the
kinetic parameters of α and ks from the slope and intercept
of such plots respectively. Using the slope and intercept of plots in Figure S1i-l (SI section), the values of α and ks were obtained as 0.51, 0.50, 0.50, and 0.50 as well as
26.9, 10.9, 6.3, and 6.0 s–1 at pH 7.0 for redox pairs I, II,
III and IV, respectively.
Electrocatalytic oxidation of AA, LD, and insulin
One of the objectives of the present study was to construct a trifuntional modified electrode that would be capable of electrocatalytic oxidation of AA, LD, and insulin simultaneously at a reduced overpotential. In order to test the electrocatalytic activity of the modified electrodes, the cyclic voltammograms at the RB-MWCNT-GCE, RB-GCE, MWCNT-GCE, and AGCE were depicted in the presence and absence of AA, LD, and insulin in a 0.10 mol L–1
phosphate buffer solution (pH 7.0).
Figure 2A presents the cyclic voltammetric responses of the RB-MWCNT-GCE, RB-GCE, MWCNT-GCE, and AGCE in a 0.10 mol L–1 phosphate buffer (pH 7.0) in the
presence and absence of 0.15 mmol L–1 AA. As it can be
seen, there is a drastic increase in the anodic peak current in the presence of 0.15 mmol L–1 AA (curve b), which
can be attributed to the strong electrocatalytic effect of the RB-MWCNT-GCE in the face of this compound.33
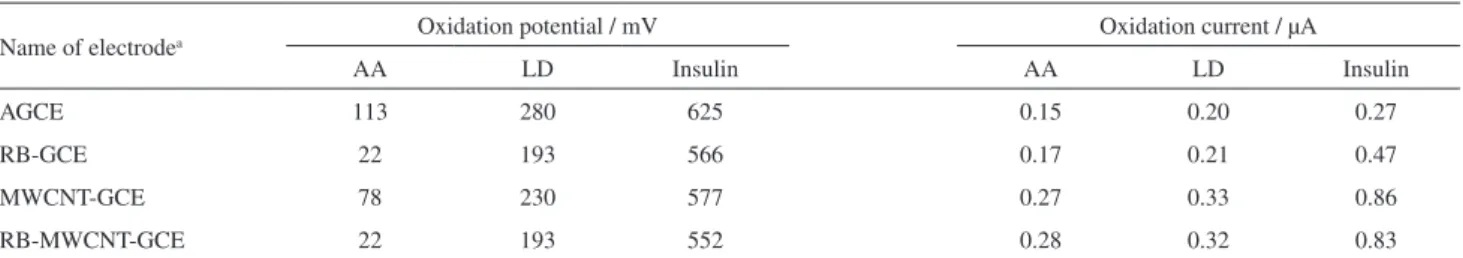
Figure 2A shows that the anodic peak potential for the oxidation of AA is about 22 mV at the RB-MWCNT-GCE (Figure 2A, curve b) and the RB-GCE (Figure 2A, curve d), while, at the MWCNT-GCE (Figure 2A, curve e) and the AGCE (Figure 2A, curve f), it is about 78 mV and 113 mV, respectively. The results suggest that the peak potential of AA oxidation at the RB-MWCNT-GCE (Figure 2A, curve b) shifts by about 56 and 91 mV towards the negative values as compared with that at the MWCNT-GCE (Figure 2A, curve e) and the AGCE CNPE (Figure 2A, curve f), respectively. Therefore, for AA, a decrease occurs in the overpotential and the enhancement peak current at the RB-MWCNT-GCE.
Figures 2B and 2C show the electrocatalytic oxidation of LD and insulin at various modified electrodes. As it can be seen, there are similar behaviors for the oxidation of LD and insulin. For example, the peak potential for the oxidation
of 0.20 mmol L–1 LD at the RB-MWCNT-GCE (Figure 2B,
curve b) shifts by about 37 and 87 mV towards the negative values as compared with that at the MWCNT-GCE (Figure 2B, curve e) and the AGCE (Figure 2B, curve f) respectively. Although, the shift of potential is not egregious, but the MWCNT-GCE and AGCE become polluted rapidly so these are not capable to generate a reproducible surface. Indeed, simultaneous determination of analytes at the surface of these electrodes is not possible, whereas it is possible at the surface of RB-MWCNT-GCE.
A similar behavior is observed for insulin. As shown in Figure 2C, the electrocatalytic anodic peak potential of 0.40 mmol L–1 insulin at the RB-MWCNT-GCE (Figure 2C,
curve b) appears at 552 mV, while, at the MWCNT-GCE (Figure 2C, curve e) and the AGCE (Figure 2C, curve f), the oxidation currents are observed at about 577 and 625 mV, respectively.
In addition, Figures 2B and 2C indicate that, after the addition of LD and insulin, a drastic enhancement occurs in the anodic peak II and IV current, and virtually a very small current is observed in the cathodic sweep. Table 2 shows the electrocatalytic oxidation characteristics of AA, LD, and insulin at various modified electrode surfaces at pH 7.0.
Figure 2D is the depiction of the cyclic voltammograms of the RB-MWCNT-GCE in a buffer solution, pH 7.0, in the absence (Figure 2D, curve a) and presence (Figure 2D, curve b) of a triplet mixture 0.10 mmol L–1
AA, 0.10 mmol L–1 LD, and 0.30 mmol L–1 insulin. As it
can be observed, the RB-MWCNT-GCE oxidizes AA, LD, and insulin in three well-defined cyclic voltammetry peaks. There is a drastic increase in the anodic peak current in the presence of 0.10 mmol L–1 AA, 0.10 mmol L–1 LD, and
0.30 mmol L–1 insulin (curve b), which can be attributed to
the strong electrocatalytic effect of the RB-MWCNT-GCE in the case of these compounds. This reveals that it is quite possible to simultaneously determine AA, LD, and insulin at an RB-MWCNT-GCE in mixture samples. Based on this finding, the modified electrode may be used to serve as a trifunctional electrochemical sensor for AA, LD, and insulin.
In order to obtain information about the rate-determining step of AA, LD, and insulin electrocatalytic oxidation at the RB-MWCNT-GCE, the linear sweep voltammograms of 0.10 mmol L–1 AA, 0.10 mmol L–1 LD, and 0.20 mmol L–1
insulin are depicted at different scan rates (Figures S2, S3 and S4 in the SI section). Insets A of Figures S2, S3, and S4 show that the plots of the catalytic peak current, Ip, versus the square root of the potential scan rate, v1/2, are
anodic oxidation of AA, LD, and insulin are found as n = 2.03 ca. 2, n = 2.1 ca. 2, and n = 2.1 ca. 2, respectively. They are obtained from the plot’s slope of Ip versus v
1/2
(Inset A of Figures S2, S3 and S4). The values obtained
for n are similar to those previously reported for these compounds with other modified electrode.7,11,20,26
The plot of the scan rate normalized current (Ip v −1/2)
versus the scan rate (Inset B of Figures S2, S3 and S4
Figure 2. (A) Cyclic voltammograms of RB-MWCNT-GCE in 0.1 mol L–1 phosphate buffer solution (pH 7) in the absence (a) and presence of 0.15 mmol L–1
AA (b). (c) as (a) and (d) as (b) for in RB-GCE. (e, f) As (b) for MWCNT modified, activated GCE. (B) Cyclic voltammograms of RB-MWCNT-GCE in 0.1 mol L–1 phosphate buffer solution (pH 7) in the absence (a) and presence of 0.20 mmol L–1 LD (b). (c) as (a) and (d) as (b) for in RB-GCE. (e, f) as (b) for
MWCNT modified, activated GCE. (C) Cyclic voltammograms of RB-MWCNT-GCE in 0.1 mol L−1 phosphate buffer solution (pH 7) in the absence
(a) and presence of 0.40 mmol L–1 insulin (b). (c) as (a) and (d) as (b) for in RB-GCE. (e, f) as (b) for MWCNT modified, activated GCE. (D) Cyclic
voltammograms of RB-MWCNT-GCE in the buffer solution, pH 7.0, in the absence (a) and the presence of 0.10 mmol L–1 AA, 0.10 mmol L–1 LD and
0.30 mmol L–1 insulin (b). Scan rate potential is 20 mV s–1.
Table 2. Comparison of electrocatalytic oxidation of AA (0.15 mmol L–1), LD (0.20 mmol L–1) and insulin (0.40 mmol L–1) on various electrode surfaces
at pH 7.0
Name of electrodea Oxidation potential / mV Oxidationcurrent / µA
AA LD Insulin AA LD Insulin
AGCE 113 280 625 0.15 0.20 0.27
RB-GCE 22 193 566 0.17 0.21 0.47
MWCNT-GCE 78 230 577 0.27 0.33 0.86
RB-MWCNT-GCE 22 193 552 0.28 0.32 0.83
aAGCE: activated glassy carbon electrode; RB-GCE: reactive blue modified glassy carbon electrode; MWCNT-GCE: multi-walled carbon nanotubes
in the SI section) exhibits a characteristic shape typical of an electrochemical catalytic (EC) mechanism for the oxidation reaction of AA, LD, and insulin at the RB-MWCNT-GCE surface.32 In the above conditions for
EC’ mechanisms, Andrieux and Saveant’s theoretical model,35 can be used to calculate the catalytic rate
constant (k’). Using this theory, the average values of k’ = (8.2 ± 0.22) × 10−4 cm s−1, k’ = (5.6 ± 0.15) × 10−3 cm s−1,
and k’ = (6.7 ± 0.20) × 10−4 cm s−1 are obtained for AA,
LD, and insulin, respectively.
The Tafel plots are drawn (Inset C of Figures S2, S3 and S4) using the points of the Tafel region of the linear sweep voltammograms of AA, LD, and insulin solutions at the RB-MWCNT-GCE surface. The exchange current density (j0) is accessible from the intercept of the Tafel plots.33 The
values of Tafel for AA, LD, and insulin indicate that the rate-limiting step is a one-electron transfer process, assuming the average charge transfer coefficients of α = 0.60 ± 0.013, α = 0.35 ± 0.0081, and α = 0.30 ± 0.0054 for AA, LD, and
insulin, respectively. Also, the j0 is accessible from the
intercept of the Tafel plots.32 The average values obtained
for the exchange current densities of AA, LD, and insulin at the RB-MWCNT-GCE are found to be 21.2, 0.04 and 1.1 µA cm−2.
The electrocatalytic oxidation of AA, LD, and insulin by the RB-MWCNT-GCE was also studied by chronoamperometry. A chronoamperometry technique was employed to determine the diffusion coefficients of AA, LD, and insulin at the RB-MWCNT-GCE. Chronoamperometric measurements of AA, LD, and insulin at the RB-MWCNT-GCE were made by setting the working electrode potential at 75, 275, and 625 mV, respectively. The diffusion coefficients of AA, LD, and insulin were calculated as 3.06 × 10⁻⁶ cm2 s−1, 2.91 × 10⁻⁶ cm2 s−1, and
1.70 × 10⁻⁶ cm2 s–1 using the Cottrell equation.33 These
values correspond to the diffusion coefficient of AA, LD, and insulin is in good agreement with those reported by others.7,20,26
DPV technique for determination of AA, LD, and insulin
Differential pulse voltammetry (DPV) has a much higher current sensitivity than cyclic voltammetry; therefore, it was used to estimate the linear ranges and the detection limits of AA, LD, and insulin. Figures S5, S6 and S7 (in the SI section) show the differential pulse voltammograms of a 0.1 mol L–1 phosphate buffer solution
(pH 7.0) containing different concentrations of AA (in the range of 1.62-1.07 × 10³ µmol L–1), LD (in the range
of 1.37-8.33 × 10² µmol L–1), and insulin (in the range
of 0.860-7.14 × 10² µmol L−1). Insets A and B of Figure
S5 show that the plot of the peak current versus the AA concentration is made up of two linear segments of 1.62-30.9 µmol L–1 and 30.9-1.07 × 10³ µmol L–1 with
different slopes. Also, LD concentration is made up of two linear segments with different slopes corresponding to two different ranges of substrate concentration (1.37-92.6 µmol L–1 and 92.6-83.3 × 101 µmol L–1)
(Insets A and B of Figure S6 in the SI section). Similar calibration graphs were obtained for determination of insulin. The calibration plot was linear for two concentration ranges of insulin, 0.860-1.28 × 10² µmol L–1
and 1.28 × 10²-7.14 × 10² µmol L–1 (Insets A and B
of Figure S7), with different slopes. The decrease of sensitivity (slope) in the second linear range (higher analytes concentrations) is likely to be due to electrode surface pollution.
Using the method mentioned by Bard and Faulkner,32 the
detection limits of AA, LD, and insulin in the lower range regions were found to be 0.45 µmol L–1, 0.37 µmol L–1,
and 0.25 µmol L–1.
The average voltammetric peak current and the precision of the repeated measurements (n = 12) of 10.0 µmol L–1
AA, 15.0 µmol L–1 LD, and 5.0 µmol L–1 insulin at
RB-MWCNT-GCE were 0.485 ± 0.0120 µA and 2.1% for AA,
0.302 ± 0.00704 µA and 2.3% for LD, and 0.51 ± 0.014 µA and 2.7% for insulin. This coefficient of variation value
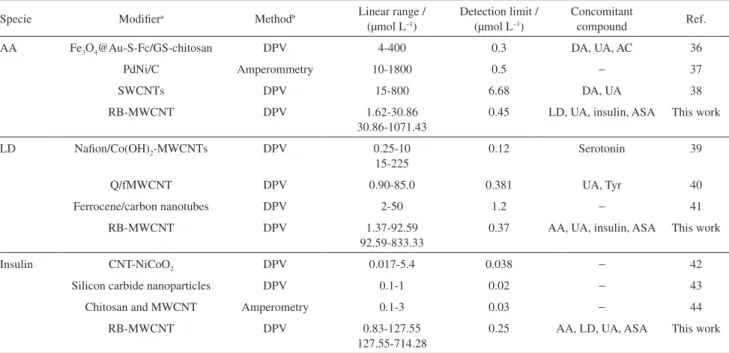
indicates that the RB-MWCNT-GCE is stable and does not undergo surface fouling during voltammetric measurements. This also points to the fact that the results obtained at the RB-MWCNT-GCE are repeatable. Table 3 displays some of the response characteristics obtained for AA, LD, and insulin in this study in comparison to those previously reported by others.36-44 The data show that the
responses of the proposed modified electrode are superior in most cases to those of the previously reported modified electrodes.
Simultaneous determination of AA, LD, UA, insulin, and ASA
The main objective of the present work was the development of a modified electrode capable of simultaneous determination of AA, LD, UA, insulin, and ASA. The electrooxidation of AA, LD, UA, insulin, and ASA at the RB-MWCNT-GCE was investigated simultaneously by varying the concentration of the analyte species. The DPV results show that the simultaneous determination of the above analytes with three well-distinguished anodic peaks at the potentials of −20, 132, 270, 585, and 790 mV,
Figures 3B to 4F show that the calibration curves for AA, LD, UA, insulin, and ASA are linear for the concentration ranges of 4.3-1.8 × 10² µmol L−1 of AA, 11.0-40.0 µmol L−1
of LD, 9.04-1.18 × 10² µmol L−1 of UA, 1.4-6.6 µmol L−1
of insulin, and 16.4-200.0 µmol L−1 of ASA.
The DPV of a mixture of 50.0 µmol L–1 AA,
20.0 µmol L–1 LD, 50.0 µmol L–1 UA, 4.0 µmol L–1
insulin, and 70.0 µmol L–1 ASA at a bare GCE shows just
two broad and overlapping peaks that cannot separate the voltammetric signals of AA, LD, UA, insulin, and ASA (inset a of Figure 3A). In contrast, an RB-MWCNT-GCE is able to show five well-defined voltammetric peaks for each analyte. The DPV of the RB-MWCNT-GCE in 0.1 mol L–1 phosphate buffer solution (pH 7.0) are depicted
in Figure 3A, inset b.
Application of RB-MWCNT-GCE for recover y and determination of AA, LD, UA, insulin, and ASA in real samples
In order to verify the reliability of the RB-MWCNT-GCE for the analysis of AA, LD, UA, insulin, and ASA in real samples, the modified electrode was applied to determine AA (100 mg), LD (250 mg), and ASA (500 mg) concentrations in tablets, UA in a human urine sample, and insulin (100 U mL–1) concentration in an injection
solution. Afterward, the analytical results were compared with those declared in the label of pharmaceutical products.
The insulin injection solution and the urine were diluted 350 and 120 times, respectively. AA, LD, and ASA tablet were dissolved in 500 mL of doubly distilled water and diluted 115, 130, and 110 times with a 0.10 mol L–1
phosphate buffer solution before the measurements. Then, the diluted sample solutions were placed in an electrochemical cell to determine their concentrations by a DPV method. The results are summarized in Table S1, in the SI section.
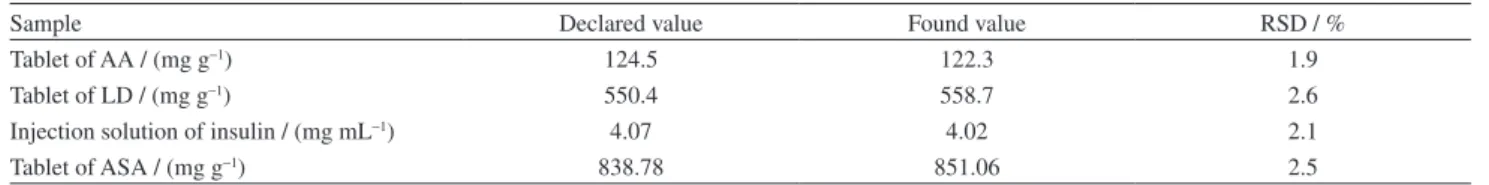
To ascertain the correctness of the results, the diluted samples were spiked with certain amounts of AA, LD, UA, insulin, and ASA. Satisfactory relative standard deviations (RSD%) and the recovery rates of the experimental results were found for AA, LD, UA, insulin, and ASA. The results in Table S1 (in the SI section) show that the RSD% and the recovery rates of the spiked diluted analyte solutions are acceptable. The reliability of the proposed sensor was also evaluated by comparing the obtained results with those declared in the label of the pharmaceutical products. The obtained results are listed in Table 4. As the table suggests, the results obtained by a differential pulse voltammetric method are in close agreement with the values declared on the labels of the samples.
Table 3. Comparison of analytical parameters of several modified electrodes for AA, LD and insulin determination
Specie Modifiera Methodb Linear range /
(µmol L–1)
Detection limit / (µmol L–1)
Concomitant
compound Ref.
AA Fe3O4@Au-S-Fc/GS-chitosan DPV 4-400 0.3 DA, UA, AC 36
PdNi/C Amperommetry 10-1800 0.5 − 37
SWCNTs DPV 15-800 6.68 DA, UA 38
RB-MWCNT DPV 1.62-30.86
30.86-1071.43
0.45 LD, UA, insulin, ASA This work
LD Nafion/Co(OH)2-MWCNTs DPV 0.25-10
15-225
0.12 Serotonin 39
Q/fMWCNT DPV 0.90-85.0 0.381 UA, Tyr 40
Ferrocene/carbon nanotubes DPV 2-50 1.2 − 41
RB-MWCNT DPV 1.37-92.59
92.59-833.33
0.37 AA, UA, insulin, ASA This work
Insulin CNT-NiCoO2 DPV 0.017-5.4 0.038 − 42
Silicon carbide nanoparticles DPV 0.1-1 0.02 − 43
Chitosan and MWCNT Amperometry 0.1-3 0.03 − 44
RB-MWCNT DPV 0.83-127.55
127.55-714.28
0.25 AA, LD, UA, ASA This work
aFe
3O4@Au-S-Fc/GS-chitosan: D-phenylethynyl ferrocene thiolate (Fc-SAc) modified Fe3O4@AuNPs coupling with graphene sheet/chitosan (GS-chitosan);
Table 4. Comparison of the total values of AA, LD, insulin and ASA of various formulations obtained using the RB-MWCNT-GCE with those declared in the label of the pharmaceutical productsa
Sample Declared value Found value RSD / %
Tablet of AA / (mg g−1) 124.5 122.3 1.9
Tablet of LD / (mg g−1) 550.4 558.7 2.6
Injection solution of insulin / (mg mL−1) 4.07 4.02 2.1
Tablet of ASA / (mg g−1) 838.78 851.06 2.5
aThe total values were obtained by multiplying the measured values by the appropriate dilution factor and number of sample assayed was four.
Figure 3. (A) Differential pulse voltammograms of RB-MWCNT-GCE in a 0.1 mol L–1 phosphate buffer solution (pH 7.0) containing different
concentrations of AA, LD, UA, insulin and ASA. Numbers 1-9 correspond to 4.3-181.8 µmol L–1 of AA, 11.0-40.0 µmol L–1 of LD, 9.0-117.6 µmol L–1 of
UA, 1.4-6.6 µmol L–1 of insulin, and 16.4-200.0 µmol L–1 of ASA. Insets show differential pulse voltammogram in (a) a mixed solution of 50.0 µmol L–1 AA,
20.0 µmol L–1 LD, 50.0 µmol L–1 UA, 4.0 µmol L–1 insulin and 70.0 µmol L–1 ASA at a bare GCE and (b) in 0.1 mol L–1 phosphate buffer solution (pH 7.0) at
Conclusions
In this paper, we introduced a new trifunctional electrode based on a reactive blue multi-wall carbon nanotube modified glassy carbon electrode. With regard to the results, it is concluded that an RB-MWCNT-GCE not only can be used as a trifunctional electrocatalyst for the oxidation of AA, LD, and insulin but also resolves the overlapped oxidation peaks of AA, LD, UA, insulin, and ASA in mixtures into five well-defined peaks. Chronoamperometry technique was used to determine the diffusion coefficients of AA, LD, and insulin. By DPV method, two linear calibration ranges were observed for AA, LD, and insulin. Also, the detection limits of AA, LD, and insulin were found to be 0.45 µmol L−1, 0.37 µmol L−1,
and 0.25 µmol L−1. In addition, the RB-MWCNT-GCE was
satisfactorily used to determine AA, LD, insulin, and ASA in pharmaceutical samples and UA in a human urine sample.
Supplementary Information
Supplementary information is available free of charge at http://jbcs.org.br as PDF file.
References
1. Hosseinzadeh, R.; Sabzi, R. E.; Ghasemlu, K.; Colloids Surf., B
2009, 68, 213.
2. Sathisha, T. V.; Kumara Swamy, B. E.; Chandrashekar, B. N.; Thomas, N.; Eswarappa, B.; J. Electroanal. Chem.2012, 674, 57.
3. Ping, J.; Wu, J.; Wang, Y.; Ying, Y.; Biosens. Bioelectron.2012, 34, 70.
4. Wang, C.; Yuan, R.; Chai, Y.; Chen, S.; Zhang, Y.; Hu, F.; Zhang, M.; Electrochim. Acta2012, 62, 109.
5. Silva, F. A. S.; Lopes, C. B.; Kubota, L. T.; Lima, P. R.; Goulart, M. O. F.; Sens. Actuators, B2012, 168, 289.
6. Sheng, Z. H.; Zheng, X. Q.; Xu, J. Y.; Bao, W. J.; Wang, F. B.; Xia, X. H.; Biosens. Bioelectron.2012, 34, 125.
7. Leite, F. R. F.; Maroneze, C. M.; Oliveira, A. B.; Santos, W. T. P.; Damos, F. S.; Luz, R. C. S.; Bioelectrochemistry 2012, 86, 22. 8. Andreadou, E.; Nikolaou, C.; Gournaras, F.; Rentzos, M.; Boufidou, F.; Tsoutsou, A.; Zournas, C.; Zissimopoulos, V.; Vassilopoulos, D.; Clin. Neurol. Neurosurg.2009, 111, 724. 9. Wang, J.; Musameh, M.; Anal. Chim. Acta 2004, 511, 33. 10. Salimi, A.; Roushani, M.; Soltanian, S.; Hallaj, R.; Anal. Chem.
2007, 79, 7431.
11. Cunningham, J. J.; J. Am. Coll. Nutr. 1998, 17, 105. 12. Rosenberg, E. F.; J. Clin. Invest.1938, 17, 233.
13. Jaafariasl, M.; Shams, E.; Amini, M. K.; Electrochim. Acta
2011, 56, 4390.
14. Wudarska, E.; Chrzescijanska, E.; Kusmierek, E.; Rynkowski, J.; Electrochim. Acta2013, 93, 189.
15. Caspi, D.; Lubrat, E.; Graff, E.; Habot, B.; Yaron, M.; Segal, R.; Arthritis Rheum.2000, 43, 103.
16. Patel, V.; Fisher, M.; Voelker, M.; Gessner, U.; Pain Pract.2012, 12, 476.
17. Hammadi, S. H.; Al-Ghamdi, S. S.; Yassien, A. I.; Al-Hassani, S. D.; Open J. Endocr. Metab. Dis.2012, 2, 16.
18. Zare, H. R.; Nasirizadeh, N.; Golabi, S. M.; Namazian, M.; Mazloum-Ardakani, M.; Nematollahi, D.; Sens. Actuators, B
2006, 114, 610.
19. Ensafi, A. A.; Taei, M.; Khayamian, T.; J. Electroanal. Chem.
2009, 633, 212.
20. Zare, H. R.; Nasirizadeh, N.; Mazloum Ardakani, M.; J. Electroanal. Chem.2005, 577, 25.
21. Zare, H. R.; Nasirizadeh, N.; Sens. Actuators, B2010, 143, 666.
22. Zare, H. R.; Shekari, Z.; Nasirizadeh, N.; Jafari, A. A.; Catal. Sci. Technol.2012, 2, 2492.
23. Zare, H. R.; Rahmani, N.; Nasirizadeh, N.; Benvidi, A.; Catal. Sci. Technol.2013, 3, 1224.
24. Nasirizadeh, N.; Shekari, Z.; Zare, H. R.; Makarem, S.; Mater. Sci. Eng., C2013, 33, 1491.
25. Zare, H. R.; Ghanbari, Z.; Nasirizadeh, N.; Benvidi, A.; C. R. Chim.2013, 16, 287.
26. Nasirizadeh, N.; Shekari, Z.; Zare, H. R.; Shishehbore, M. R.; Fakhari, A. R.; Ahmar, H.; Biosens. Bioelectron.2013, 41, 608.
27. Martin, C. S.; Teixeira, M. F. S.; J. Solid State Electrochem.
2012, 16, 3877.
28. Yang, S.; Li, G.; Yang, R.; Xia, M.; Qu, L.; J. Solid State Electrochem.2011, 15, 1909.
29. Nasirizadeh, N.; Shekari, Z.; Ionics2014, 20, 275.
30. Nasirizadeh, N.; Shekari, Z.; Zare, H. R.; Ardakani, S. A. Y.; Ahmar, H.; J. Braz. Chem. Soc.2013, 24, 1846.
31. Miller, J. N.; Miller, J. C.; Statistics and Chemometrics for Analytical Chemistry, 4th ed.; Prentice Hall: Harlow, 2000.
32. Nasirizadeh, N.; Zare, H. R.; Fakhari, A. R.; Ahmar, H.; Ahmadzadeh, M. R.; Naeimi, A.; J. Solid State Electrochem.
2011, 15, 2683.
33. Bard, A. J.; Faulkner, L. R.; Electrochemical Methods. Fundamentals and Applications, 2nd ed., Wiley: New York, 2001.
34. Laviron, E.; J. Electroanal. Chem.1979, 101, 19.
35. Andrieux, C. P.; Saveant, J. M.; J. Electroanal. Chem. 1978, 93, 163.
36. Liu, M.; Chen, Q.; Lai, C.; Zhang, Y.; Deng, J.; Li, H.; Yao, S.; Biosens. Bioelectron.2013, 48, 75.
37. Zhang, X.; Cao, Y.; Yu, S.; Yang, F.; Xi, P.; Biosens. Bioelectron.
2013, 44, 183.
39. Babaei, A.; Taheria, A. R.; Aminikhah, M.; Electrochim. Acta
2013, 90, 317.
40. Raoof, J. B.; Ojani, R.; Amiri-Aref, M.; Baghayeri, M.; Sens. Actuators, B2012, 166-167, 508.
41. Yaghoubian, H.; Karimi-Maleh, H.; Khalilzadeh, M. A.; Karimi, F.; Int. J. Electrochem. Sci.2009, 4, 993.
42. Arvinte, A.; Westermann, A. C.; Sesay, A. M.; Virtanen, V.; Sens. Actuators, B2010, 150, 756.
43. Salimi, A.; Mohamadi, L.; Hallaj, R.; Soltanian, S.; Electrochem. Commun.2009, 11, 1116.
44. Zhang, M.; Mullens, C.; Gorski, W.; Anal. Chem.2005, 77, 6396.
Submitted: August 23, 2014
![Table 1. Variations in anodic peak surface coverage, Γ , as a function of MWCNT amounts, RB solution pH, RB solution concentration, [RB], potential scan rates, v, and number of cycles of potential scan, number of cycles, during the modification step](https://thumb-eu.123doks.com/thumbv2/123dok_br/18999318.463223/3.892.483.820.344.761/variations-coverage-function-solution-concentration-potential-potential-modification.webp)