Article
J. Braz. Chem. Soc., Vol. 24, No. 4, 621-630, 2013. Printed in Brazil - ©2013 Sociedade Brasileira de Química 0103 - 5053 $6.00+0.00
A
*e-mail: [email protected]
An Enhanced Electrochemical Sensing Platform Integrated with Graphene Oxide
and Iron Hydroxide Colloid for Sensitive Determination of Phloroglucinol
Junhua Li,* Daizhi Kuang, Yonglan Feng, MengqinLiu, Fuxing Zhang and Peihong Deng
Department of Chemistry and Material Science, Hengyang Normal University, Hengyang 421008, Hunan, P. R. China
Uma nova plataforma de sensoriamento eletroquímico foi fabricada com nanohíbrido consistindo de óxido de grafeno e hidróxido de ferro coloidal. Devido à elevada área superficial e à excelente condutividade elétrica do nanohíbrido, o sensor eletroquímico preparado exibiu atividade eletrocatalítica proeminente na oxidação do floroglucinol, resultando no aumento da corrente do pico de oxidação e redução do sobrepotencial de oxidação. O nanohíbrido foi utilizado como uma plataforma aprimorada de detecção eletroquímica para a determinação sensível do floroglucinol. O mecanismo de oxidação do floroglucinol nesta plataforma de detecção foi investigada em detalhes, as condições de determinação foram otimizadas, e os parâmetros cinéticos também foram calculados. Sob condições otimizadas, a corrente de pico de oxidação foi proporcional à concentração do floroglucinol no intervalo de 5,00-100,00 nmol L−1, com limites de detecção
e de quantificação de 3,45 e 11,51 nmol L−1, respectivamente. A plataforma de detecção exibiu
estabilidade em longo prazo, alta reprodutibilidade e alta capacidade de anti-interferência. A plataforma foi empregada para detectar floroglucinol em amostras ambientais de água com boas recuperações. O excelente desempenho, a simplicidade de operação e o baixo custo tornam o híbrido baseado no grafeno atraente na construção de um sensor.
A novel electrochemical sensing platform was fabricated with nanohybrid consisting of graphene oxide and iron hydroxide colloid. With high surface area and excellent electrical conductivity of the nanohybrid, the prepared electrochemical sensor exhibited preeminent electrocatalytic activity towards the oxidation of phloroglucinol, resulting in the increase of the oxidation peak current and decrease of the oxidation overpotential. The nanohybrid was used as an enhanced electrochemical sensing platform for sensitive determination of phloroglucinol. The oxidation mechanism of phloroglucinol at this sensing platform was investigated in detail, the determination conditions were optimized, and the kinetic parameters were also calculated. Under the optimized conditions, the oxidation peak current was proportional to phloroglucinol concentration in the range from 5.00 to 100.00 nmol L−1 with limits of detection and of quantification of 3.45 and 11.51 nmol L−1, respectively. This sensing platform displayed long-term stability, high reproducibility and super anti-interference capability. It was employed to detect phloroglucinol in environmental water samples with good recoveries. The excellent performance, operational simplicity and low expense make the graphene-based hybrid attractive in the sensor construction.
Keywords: graphene oxide, iron hydroxide colloid, electrochemical sensor, sensitive detection, phloroglucinol
Introduction
Phloroglucinol (benzene-l,3,5-triol) naturally occurs in plants. It has not only important physiological functions but also some pharmacological activities. It is widely used as a smooth muscle relaxant, being less toxic than most other antispasmodic agents.1 It can also be used as bio-reagent and
Until now, just few analytical methods were developed for the determination of phloroglucinol, such as fluorimetry,2 liquid chromatography tandem mass
spectrometry (LC-MS),3,4 capillary zone electrophoresis5
and chemiluminescent method.1 However, these methods
are not ideal for quantification of phloroglucinol, because the derivatization is necessary in fluorescence detection but the phloroglucinol itself is not fluorescent and the instrumentation for the LC-MS detection is rather complicated and expensive. In addition, these studies have mainly focused not on the detection of phloroglucinol, but instead on the separation of polyphenols, including phloroglucinol. So, they are too time-consuming and hardly employ on site measurement. Furthermore, they also need a relatively large amount of sample to reach a low limit of quantification. Thus, there is a need to explore new methods for the detection of phloroglucinol.
In recent years, the interest in developing electrochemical sensing devices for use in environmental monitoring, clinical assays or process control is growing rapidly. Electrochemical sensors satisfy many of the requirements for such tasks particularly owing to their inherent specificity, rapid response, sensitivity and simplicity of preparation.6 In this sense, an
electrochemical sensor based on innovative designs would be a good alternative for the detection of phloroglucinol. In order to enhance the electrochemical responses of analytes, the working electrode employed in familiar electrochemical technique often needs surface modification.7 For example,
Wang et al.8 utilized multi-wall carbon nanotube to modify
the electrode, and the oxidation current of phloroglucinol on the modified electrode was greatly enhanced by using the surfactant cetyl pyridinium chloride. Nevertheless, the reports regarding the electrochemistry and voltammetric determination of phloroglucinol have been published, but are very limited.
Graphene, which is a monolayer of carbon atoms packed closely into a two-dimensional honeycomb lattice, has drawn significant attention because of its fascinating properties and potential applications since the experimental discovery of single layers by Novoselov and Geim.9 Recent significant advances also reveal that the
clever combination of graphene with metal nanoparticles, leading to the development of a multicomponent nanoassembly system, opens a new application for graphene-based hybrid nanomaterials as enhanced elements for constructing higher-performance electrochemical sensing platform.10,11 The applications of graphene or
graphene based nanocomposites in electrochemical sensors with high sensitivity and selectivity are widely reported,12 such as glucose,13,14 hydrogen peroxide,15
organophosphorus pesticides,16 acetylcholinesterase,17
hydrazine,18 carbendazim,19 paracetamol20 and dopamine21
sensors. In addition, several works have demonstrated that graphene usually exhibits better electroanalytical or electrochemical performance22,23 than the extensively
used carbon nanotubes. Graphene oxide (GO) and reduced graphene oxide (RGO), two kinds of the important derivatives of graphene, also have high surface area, excellent conductivity and strong mechanical strength. Compared with GO, RGO has better conductivity but with relatively lower dispersity. This will restrict the film-forming property of the RGO nanohybrids and the application of RGO in modified electrodes. Moreover, the loading ratio (weight ratio) of GO is much higher than that of other loading nanostructures,24 suggesting a
more efficient enrichment substrate for target molecules. Meanwhile, the hybridization of GO and nanoparticles as an efficient strategy enhances the electronic, catalytic and optical properties of the GO-based hybrid by π-π stacking
and electrostatic interaction.25-27 Thus, GO was employed
here to fabricate a new electrochemical sensing device. In this work, an enhanced electrochemical sensing platform integrated with GO and Fe(OH)3 colloid was
developed and used for the detection of trace amounts of phloroglucinol. The two dimensional plane structure of GO affords a vast platform for loading the analytes, and Fe(OH)3 colloid can improve the adsorption and the catalytic
property of the nanohybrid. The prepared sensing platform was characterized by transmission electron microscopy (TEM), cyclic voltammetry (CV) and electrochemical impedance spectroscopy (EIS). The electrochemical behaviors and kinetic parameters of phloroglucinol at the sensing platform were also investigated in detail, and the results reveal that nanohybrid cast film can remarkably enhance the electrooxidation signal of phloroglucinol as well as its determining sensitivity. Moreover, this procedure was satisfactorily applied to the determination of phloroglucinol in environmental water samples. The resultant electrochemical sensor exhibits simple operation, rapid response, good reproducibility and it is independent from other potentially interfering species.
Experimental
Reagents
Phloroglucinol was purchased from Sigma Chemical Co. (St. Louis, Mo, USA), and its standard stock solutions of 1.0 mmol L−1 were prepared daily by dissolving the
required amount of phloroglucinol in 40% (m/v) ethanol solution. Graphite powder (spectrum pure), H2SO4, KMnO4,
from Shanghai Chemical Reagent Co. Ltd. (Shanghai, China). Phosphate buffer saline (0.1 mol L−1 PBS) with
various pH values was prepared by mixing stock standard solutions of Na2HPO4 and NaH2PO4 and adjusted by
0.1 mol L−1 H
3PO4 or 0.1 mol L−1 NaOH solutions.
Ultrapure water (18.2 MΩ cm) was obtained from a Milli-Q water purification system and used throughout. All other chemicals were of analytical grade and used without further purification.
Instruments
The morphological characterizations were obtained with a Tecnai G20 transmission electron microscope (FEI Corp., USA) at an accelerating voltage of 200 kV. Electrochemical measurements were performed on a CHI660D electrochemical workstation (Shanghai Chenhua Co., China), using a Pt wire as the counter electrode, a saturated calomel electrode (SCE) as the reference electrode, and a glassy carbon electrode (GCE, 4 mm diameter) or several modified GCEs as the working electrode. During all the electrochemical experiments, the solutions were thoroughly deoxygenated by bubbling high purity nitrogen for 15 min and a nitrogen atmosphere was maintained over the solutions. The pH measurements were carried out on PHS-3C exact digital pH meter (Shanghai REX Instrument Factory, China), which was calibrated with standard buffer solution every day.
Synthesis of GO and Fe(OH)3 colloid
GO was synthesized from graphite powder by using a modified Hummers method.28-30 Briefly, 2 g of graphite
powder were added into a mixed solution of 20 mL of concentrated H2SO4, 1 g of K2S2O8 and 1 g of P2O5, and the
solution was kept at 80 °C for 4 h. Then, the mixture was carefully diluted with water, and the resulting preoxidized product was filtered and dried. After this preoxidization process, the graphite was put into 50 mL of concentrated H2SO4. Then, 6 g of KMnO4 were added gradually under
stirring and ice-cooling to ensure that the temperature of the mixture was below 20 °C. The mixture was then stirred at 35 °C for 2 h, followed by adding 100 mL of water. After 1 h, another 300 mL of water were added to dilute the solution, and then, 5 mL of 30% H2O2 were injected into
the solution to terminate the reaction. Then, the mixture was filtered and washed with 3% HCl solution and water in this order. Finally, filter cake was dried out at 60 °C in a drying oven and the target product was labeled as GO.
Fe(OH)3 colloid was synthesized as follows. 50 mL
of water were firstly added into 100 mL beaker, and then
heated to full boil. 1 mL of saturated FeCl3 solution was
rapidly dropped into the boiling water, and the solution was heated constantly until the solution became red brown. The resulting solution was dialyzed in hot water through semipermeable membrane to eliminate Fe3+ and Cl− ions.
After dialyzing several times, the solution changed into pale yellow and Fe(OH)3 colloid was obtained.
Fabrication of the GO/Fe(OH)3 modified GCE
A amount of 0.1 mg of the as-prepared GO solution
was added into 5 mL Fe(OH)3 colloid solution with
ultrasonic treatment for 1 h to form a homogenous mixture of GO-Fe(OH)3. GCE was polished with 0.3 and 0.05 µm
α-alumina slurry to a mirror-like surface, then washed with
1:1 nitric acid, absolute ethanol and water in an ultrasonic bath and dried in room temperature. GO/Fe(OH)3/GCE
was prepared by casting 5 µL of GO-Fe(OH)3 suspension
on the surface of cleaned GCE and dried under an infrared lamp. For comparison, Fe(OH)3/GCE and GO/GCE were
fabricated with similar procedures.
Results and Discussion
Morphological characterization of the GO/Fe(OH)3
nanohybrid
The structure and morphology of the preparedFe(OH)3
colloid, GO and GO/Fe(OH)3 were characterized by
TEM. As shown in Figure 1A, the size distribution of the obtained Fe(OH)3 colloid particle was about 30-50 nm. In
our previous report,31 the GO sheets were characterized
by atomic force microscopy (AFM) and the results demonstrated the average thickness of the GO sheets was 1.0 nm. The TEM results in Figure 1B shows that the GO sheets possess the crumpled and wrinkled flake-like structure. In Figure 1C, it can be seen that the Fe(OH)3 is
dispersed in GO suspension, and the resulting composite has relative rough surface compared with GO sheets. This rough surface could increase the effective adsorption of the benzene ring compounds onto GO-based frameworks via the π-π interaction. The homogeneous and well-dispersed
solutions are observed in Figure 1D for the obtained nanohybrid. This is attributed to the presence of carboxyl groups in GO,31,32 which lead to a reduction of van der Waals
interactions between the particles.
Electrochemical characterization of GO/Fe(OH)3/GCE
Figure 2A shows the CVs of GCE (curve a),
GO/Fe(OH)3/GCE (curve d) obtained in 0.1 mol L−1 KCl
containing 5.0 mmol L−1 [Fe(CN) 6]
3−/4− at a scan rate of
0.1 V s−1. Well-defined redox peaks were observed at the
bare GCE, and the symmetrical peak current and close peak potential indicated the redox of [Fe(CN)6]3−/4− at GCE was a
reversible electron transfer process. When the electrode was coated with Fe(OH)3, the redox peaks decreased just a little,
suggesting that the charge transfer resistance at the Fe(OH)3
film electrode is a little bit higher than at bare electrode. When the electrode was coated with GO, the redox peaks is the smallest of all, which could be attributed to the negatively charged groups on GO, blocking the diffusion of [Fe(CN)6]3−/4− from solution to the electrode surface.
This phenomenon is in accordance with previous report.31
Nevertheless, after the GO/Fe(OH)3 immobilization on
GCE, the redox peak current increased a little compared with GO/GCE, indicating that Fe(OH)3 can effectively
increase the electron transfer rate of [Fe(CN)6]
3−/4− due to
its high electric conductivity and positive charges. For further information about the electrochemical properties of the modified electrode, EIS measurements were performed in 0.1 mol L−1 KCl solution containing
5.0 mmol L−1 [Fe(CN)
6]3−/4−, using an alternating current
voltage of 5 mV. The frequency range is from 105 to 0.1 Hz
at open-circuit potential. It can be seen in Figure 2B that a small well-defined semi-circle at higher frequencies was obtained at the bare GCE, indicating that a small interface electron resistance (Rct) appeared. When Fe(OH)3
was deposited on the surface of GCE, the Rct increased
a little. However, Rct increased remarkably after the GO
immobilization on the electrode, and this phenomenon could be attributed to the GO film itself imparted with negative charges, introducing a high resistance into
the electrode/solution system. Furthermore, Rct of
GO/Fe(OH)3/GCE was between Fe(OH)3/GCE and
GO/GCE. This result demonstrated that the GO/Fe(OH)3
composite film was successfully immobilized on the GCE surface just as designed.
Electrochemical behavior of phloroglucinol at GO/Fe(OH)3/
GCE
Figure 3 presents the CV curves for bare GCE,
Fe(OH)3/GCE, GO/GCE and GO/Fe(OH)3/GCE in
blank PBS of pH 7.0 and in the presence of 0.1 µmol L−1
phloroglucinol at the scan rate of 0.1 V s−1. As can be seen in
the inset of Figure 3, no electrochemical response appeared at GCE and modified GCEs in blank PBS, indicating that the modified electrodes themselves are non-electroactive in the selected scanning region. When phloroglucinol was added into PBS, no redox peak was obtained at bare GCE, indicating that the oxidation of phloroglucinol is hard to take place at bare GCE. However, it can be seen that the phloroglucinol oxidation peak appeared at +0.39 V
Figure 1. TEM images of (A) Fe(OH)3 colloid, (B) GO and (C) GO/
Fe(OH)3, and (D) photographs of the tubules containing (a) Fe(OH)3 colloid, (b) GO and (c) GO/Fe(OH)3 dispersions.
Figure 2. CV (A) and EIS (B) curves of bare GCE (a), Fe(OH)3/GCE (b),
GO/GCE (c) and GO/Fe(OH)3/GCE (d) in 0.1 mol L−1 KCl solution
containing 5.0 mmol L−1 [Fe(CN)
6]3−/4−. The scan rate of CV was 0.1 V s−1,
the amplitude of EIS was 5 mV with frequency range from 105 to 0.1 Hz
for Fe(OH)3/GCE with weak reduction peak, indicating
an irreversible oxidation process. The Fe(OH)3 film was
imparted with positive charges, so that, it could offer numerous adsorption sites for phloroglucinol. Hence, the Fe(OH)3 film is more active for phloroglucinol and
results in the remarkable enhancement of oxidation peak current. Moreover, the phloroglucinol oxidation peak increased at 0.30 V for GO/GCE, and its corresponding reduction peak potential appeared at −0.28 V. The reason for the major response of the GO-modified GCE may be due to the nanometer dimensions of GO, the electronic structure and the topological defects present on the GO surfaces. Meanwhile, GO could increase the effective area of the modified electrode. Quite significantly, a pair of well-defined redox peaks was observed at GO/Fe(OH)3/GCE with oxidation peak at 0.22 V which
was positively shifted compared with that at Fe(OH)3/GCE
and GO/GCE. Furthermore, the oxidation peak current of phloroglucinol at GO/Fe(OH)3/GCE was the largest in all
the electrodes. The increase of the oxidation peak current and decrease of the oxidation overpotential were attributed to the synergistic electrocatalytic effect caused by GO and Fe(OH)3. Based on this, GO/Fe(OH)3/GCE can be used as
an enhanced electrochemical sensing platform for sensitive determination of phloroglucinol.
The kinetic parameters of electrode process
Effective surface area (A) and diffusion coefficient (D)
The electrochemical effective surface area for bare GCE and GO/Fe(OH)3/GCE can be calculated by the slope of the
plot of Q vs. t1/2 obtained by chronocoulometry (Figure 4A)
using 0.1 mmol L−1 K
3[Fe(CN)6] as model complex based
on the equation 1 given by Anson,33
(1)
where A is effective surface area of working electrode, c is concentration of substrate, nis the number of transfer electron (n of K3[Fe(CN)6] is 1),D is the diffusion coefficient (D of
K3[Fe(CN)6] is 7.6 × 10⁻⁶ cm2 s–1), Q is quantity of electricity,
Qdl is double layer charge which could be eliminated by
background subtraction, and Qads is Faradaic charge. Other
symbols have their usual meanings. Based on the slope of the linear relationship between Qand t1/2 in Figure 4B, the effective
surface area A could be calculated as 0.1126 and 0.2545 cm2
for GCE and GO/Fe(OH)3/GCE, respectively. These results
indicate that GO/Fe(OH)3 can significantly increase the
reaction surface area of the electrodes and enhance the current of the charge transfer reaction between the electrode and solution species for lower electrode polarization. The diffusion coefficient of phloroglucinol at GO/Fe(OH)3/GCE
can also be determined by chronocoulometry based on equation 1. As can be seen in Figure 4C, a linear relationship between Q and t1/2 was obtained after point-by-point
background subtraction (Figure 4D), and the regression can be expressed as Q (C) = 2.0617 × 10⁻⁴ t1/2 s1/2 − 3.3856 × 10⁻⁵
(R2 = 0.9855). Based on the slope of 2.0617 × 10⁻⁴ C/s1/2,
n = 2, A = 0.2545 cm2 and c = 0.1 mmol L−1, D was calculated
as 7.527 × 10⁻⁶ cm2 s−1.
Electron transfer number (n) and standard heterogeneous rate constant (ks)
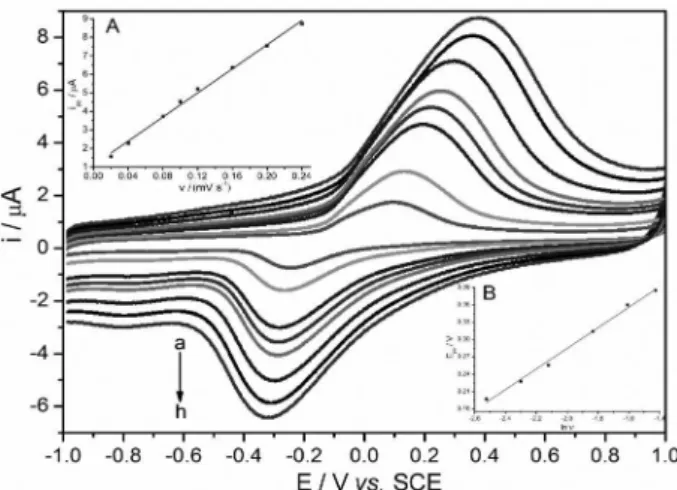
Useful information involving electrochemical mechanism usually can be acquired from the relationship between the peak current and scan rate. Therefore, the influence of scan rate on the oxidation peak current of phloroglucinol was investigated in detail and the results are shown in Figure 5. With the increase of the scan rate from 0.02 to 0.24 V s−1, the oxidation peak potential shifted
to more positive direction and the oxidation peak current increased gradually. The linear relationship between the peak current and the scan rate was obtained with the linear regression equation as: Ipa (µA) = 32.52 ν (V s
−1) + 1.0969
(R2 = 0.9957), which indicated that the oxidation
of phloroglucinol on GO/Fe(OH)3/GCE is a typical
adsorption-controlled process. According to this result, the surface coverage can be obtained from the following equation which was provided by Laviron,34
(2)
where n and Ts are electron transfer number and adsorption
capacity (mol cm−2), respectively. Due to n = 2, T s was
calculated as 3.399 × 10⁻⁹ mol cm−2. Figure 3. CV curves of bare GCE (a), Fe(OH)3/GCE (b), GO/GCE (c) and
GO/Fe(OH)3/GCE (d) in the presence and absence (inset) of 0.1 µmol L−1
In addition, the relationship between oxidation peak potential (Epa) and the natural logarithm of scan rate (ln ν)
is also shown in the inset of Figure 5. It can be seen that the plotting of the Epavs. ln ν produces a straight line at
high scan rates (0.08-0.24 V s−1) with the linear regression
equations as: Epa (V) = 0.6404 + 0.0278 ln ν (R2 = 0.9935).
According to the Laviron’s equation,34 E
pa is defined by the
following equation,
(3)
where α is the transfer coefficient, ks is the standard
heterogeneous rate constant of the reaction, n is the number of transferred electrons, ν is the scan rate and E0 is the
formal redox potential. Other symbols have their usual meanings. Thus, the value of αn can be easily calculated
from the slope of Epa vs. ln ν. In this system, the slope
was 0.0278, taking T = 298 K, R = 8.314 J K−1 mol−1 and
F = 96,500 C, the αn value was calculated as 0.9235.
According to Bard and Faulkner,35 the charge transfer
coefficient of α can be given from Tafel equation,
(4)
where i0 is the exchange current density and η is the
overpotential. A plot of log i vs. η, regarded as a Tafel
plot, is a useful device for evaluating kinetic parameters. In general, there is an anodic branch with slope (1 − α)F/2.3RT
and a cathodic branch with slope −αF/2.3RT in the Tafel
plot. In this work, the average value of anodic slope for five Tafel measurements is 8.96 V−1. So, the value calculated
for α is 0.47. Thus, the electron transfer number of n is 2.
The value of ks can be determined from the intercept of
the above plot if the value of E0 is known. The E0 value in
equation 3 can be obtained from the intercept of Epvs.ν
curve by extrapolating to the vertical axis at ν = 0.36 In our
system, the intercept for Epavs. ln ν plot is 0.6404 and E 0
0.0902 V, so the value calculated for ks is 123.9 s−1. Figure 4. (A): plot of Q vs. t curves for GCE (a) and GO/Fe(OH)3/GCE (b) in 0.1 mmol L−1 K
3[Fe(CN)6], (B): plot of Q vs. t1/2 curves for the GCE (a) and
GO/Fe(OH)3/GCE (b) in 0.1 mmol L−1 K
3[Fe(CN)6], (C): plot of Q vs. t curves for GO/Fe(OH)3/GCE in 0.1 mol L
−1 PBS (pH 7.0) in absence of (a) and in
presence of (b) 0.1 mmol L−1 phloroglucinol, (D): plot of Q vs. t1/2 curve for GO/Fe(OH)
3/GCE in presence of 0.1 mmol L
−1 phloroglucinol (background
The oxidation mechanism of phloroglucinol at GO/Fe(OH)3/
GCE
Without any doubt, the synergetic functions of GO and Fe(OH)3 make contributions to the higher current
response and detection sensitivity of phloroglucinol. To further elucidate the electrode reaction of phloroglucinol at GO/Fe(OH)3/GCE, the influence of solution pH on the
oxidation current of 0.1 µmol L−1 phloroglucinol was also
studied by CV in different pH values (4.0 to 9.0) at the scan rate of 0.1 V s−1. As shown in Figure 6A, the oxidation
peak current gradually increased with the increase of the pH value from 4.0 to 7.0. When the pH value improved, the electrochemical oxidation of phloroglucinol became much easier, so the peak current gradually increased. However, the oxidation signal of phloroglucinol gradually decreased, as further increasing pH value from 7.0 to 9.0, probably caused by the fact that the activity of the sensor lowered at higher pH value. Undoubtedly, Fe(OH)3 colloid
can keep stable at neutral conditions. Therefore, the pH value of 7.0 was chosen for sensitive determination of phloroglucinol.
Furthermore, it was also found that the peak potential shifted to lower values as the pH value increased (Figure 6B), indicating the protons were involved in the electrochemical oxidation of phloroglucinol. The relationship between the anodic peak potential and pH could be fitted into the regression equation: Epa (V) = 0.6324 − 0.0662 pH
(R2 = 0.9858). The calculated slope of 0.0662 V/pH is close
to the theoretical value of 0.0586 V/pH according to the Nernst equation,35 suggesting that the electron transfer was
accompanied by an equal number of protons in electrode reaction. As a results, there is a two-proton and two-electron
process for electrooxidation of phloroglucinol on GO/Fe(OH)3/GCE, so the possible reaction mechanisms
can be proposed according to the literature37 and are listed
in Scheme 1.
Optimum accumulation conditions
The two parameters of accumulation step, accumulation time and potential, were examined. Open circuit
Figure 5. CV curves of 0.1 µmol L−1 phloroglucinol at GO/Fe(OH) 3/GCE
with different scan rates in 0.1 mol L−1 PBS of pH 7.0 and the plot for the
linear relationship of (A) ipa vs. ν and (B) Epa vs. ln ν shown in the inset.
Curves (a-h) are obtained at 0.02, 0.04, 0.08, 0.10, 0.12, 0.16, 0.20 and 0.24 V s−1, respectively.
Figure 6. (A)CV curves of 0.1 µmol L−1phloroglucinol at GO/Fe(OH)3/GCE under different pH (a-g: 4.0, 5.0, 6.0, 7.0, 7.5, 8.5 and 9.0), and (B)effect of pH on the oxidation potential.
accumulation is widely used in electroanalytical chemistry to accumulate analyte and improve the sensitivity. The influence of the accumulation time ranging from 0 to 210 s on the oxidation of 0.1 µmol L−1 phloroglucinol
at GO/Fe(OH)3/GCE was investigated firstly. The current
increased gradually as accumulation time increased from 0 to 90 s. However, with further increase in the accumulation time, the peak current tended to be almost stable beyond 90 s. Therefore, the optimal accumulation time of 90 s was employed in further experiments. With the change of accumulation potential, the peak current of 0.1 µmol L−1 phloroglucinol varied a little, indicating the
accumulation potential has practically no effect on the peak current of phloroglucinol. Thus, the accumulation was carried out at open-circuit conditions.
Calibration curve
In order to develop a sensitive method for the determination of phloroglucinol, we selected the differential-pulse voltammetry (DPV), because the peaks are sharper and better defined at lower concentration than those obtained by CV. The quantitative determination is based on the dependence of oxidation peak current on the concentration of phloroglucinol. Figure 7 shows DPV curves for various concentrations of phloroglucinol in pH 7.0 PBS with accumulation time of 90 s at open-circuit potential. The calibration curve, which is shown in the inset of Figure 7, for phloroglucinol has a linear range from 5.00 to 100.00 nmol L−1 with the regression
equation as ipa (µA) = 0.1883C (nmol L−1) + 0.1943
(R2 = 0.9983). The limit of detection (LOD) and the limit
of quantification (LOQ) are calculated using, LOD = 3 s/m; LOQ = 10 s/m.6 Where s is the standard deviation of the
intercept (n = 5) and m is the slope of the calibration curve. The values of LOD and LOQ are calculated and found to be 3.45 nmol L−1 and 11.51 nmol L−1, respectively. The low
LOD and LOQ values confirmed good sensitivity of the proposed electrochemical sensor for the determination of phloroglucinol. The method presented in this work showed remarkable advantages such as sharp anodic waves with
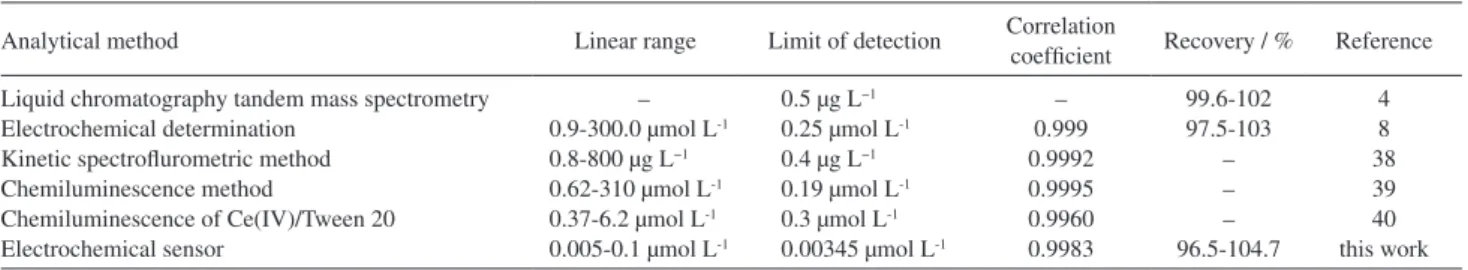
relatively large peak currents and low backgrounds, which can be conducted to improve the sensitivity and limit of detection in analytical determinations. In comparison with literature methods as shown in Table 1, the limit of detection of this method for phloroglucinol is two orders of magnitude lower than those of chemiluminescence method39,40 and the previous electrochemical method.8 To
the best of our knowledge, the limit of detection of this method is superior to most of the reported methodology and the detection range is broader in the low concentration region than others listed in Table 1.
Stability, reproducibility and interference
The stability of GO/Fe(OH)3/GCE was examined by
DPV, and it demonstrated that the electrode could retain 91.3% of its initial response after three-month storage. Such electrode stability seemed to be acceptable for most practical applications. Because the modified electrode could adsorb phloroglucinol, it was necessary to renew the electrode surface after each determination. Nonetheless, this
Figure 7. DPV curves obtained at GO/Fe(OH)3/GCE in 0.1 mol L−1
PBS (pH 7.0) containing different concentrations of phloroglucinol (a-k: 5.00, 7.00, 10.00, 14.00, 18.00, 28.00, 32.00, 40.00, 50.00, 75.00 and 100.00 nmol L−1). Operation conditions of amplitude 0.05 V, pulse width
of 0.05 s, pulse period of 0.2 s, accumulation conditions of 90 s at open-circuit potential. Inset: calibration curve.
Table 1 Comparison of the major characteristics of the different methods used in the determination of phloroglucinol
Analytical method Linear range Limit of detection Correlation
coefficient Recovery / % Reference
Liquid chromatography tandem mass spectrometry Electrochemical determination
Kinetic spectroflurometric method Chemiluminescence method
Chemiluminescence of Ce(IV)/Tween 20 Electrochemical sensor
– 0.9-300.0 µmol L-1
0.8-800 µg L−1
0.62-310 µmol L-1
0.37-6.2 µmol L-1
0.005-0.1 µmol L-1
0.5 µg L−1
0.25 µmol L-1
0.4 µg L−1
0.19 µmol L-1
0.3 µmol L-1
0.00345 µmol L-1
– 0.999 0.9992 0.9995 0.9960 0.9983
99.6-102 97.5-103
– – – 96.5-104.7
process was easily accomplished by soaking the modified electrode in blank PBS to sweep between −1.0 and +1.0 V for about 10 cycles by CV. The 0.1 µmol L−1 phloroglucinol
solution was repeatedly determined with the same electrode for 10 times. The average current was 19.82 µA with relative standard deviation (RSD) of 3.8%. The results indicated that the modified electrode possessed a good reproducibility.
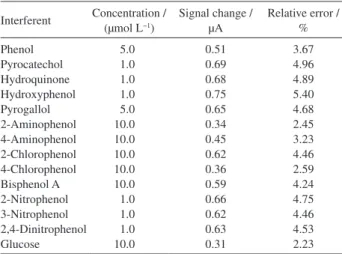
Interference studies were carried out with several chemical substances prior to the application of the proposed method for the assay of phloroglucinol in real samples. The potential interfering substances were chosen from the group of substances which contain hydroxyl in the benzene ring. The influence of various interference compounds on the determination of 0.1 µmol L−1 phloroglucinol under the
optimum conditions was studied and the results are given in Table 2. It can be seen that most of the phenols had no influence on the signals of phloroglucinol with deviations below 5%, but the hydroxyphenol was found to affect the determination because its hydroxyl group can be oxidized near the oxidation potential of phloroglucinol. However, their influence is not significant at low concentrations. For instance, 1.0 µmol L−1 hydroxyphenol influenced
on the detection signal with deviation of 5.4 % (listed in Table 2). Additionally, some inorganic ions such as 300 fold
concentration of K+, Na+, Mg2+, Ca2+, Zn2+, Fe2+, Cu2+, Cl−,
Br−, I−, NO 3
− and SO 4
2− have no influence on the signals
of phloroglucinol with deviations below 3%. The results obtained from reproducibility, stability and interference tests indicated that GO/Fe(OH)3/GCE might be suitable
for analytical application.
Analytical applications
To confirm the feasibility, the proposed method was applied to determine phloroglucinol in environmental water samples collected from a local place. No signal can be obtained when analyzing phloroglucinol in these water samples because there is no phloroglucinol in water samples or the content of phloroglucinol is generally lower than the limit of detection. Therefore, the standard addition method was employed to determine phloroglucinol in real samples, and the analytical results for five parallel specimens are listed in Table 3. The recoveries were reasonably good, varying between 96.5 and 104.7% with a satisfactory analytical precision (RSD ≤ 3.59%), which validated the reliability and practicality of this method.
Conclusion
A sensitive phloroglucinol sensor was fabricated based on the GO/Fe(OH)3 nanohybrid. The properties
of the sensor are significantly improved because of the unique properties of GO and Fe(OH)3 colloid, especially
the remarkable synergistic effect between GO and
Fe(OH)3 colloid. This nanocomposite is considered
to be a promising, low-cost and stable material in the modification of electrodes. The prepared electrochemical sensor exhibited good analytical characteristics in terms of rapidity, sensitivity, selectivity and stability. This novel material can be easily applied to other types of substrate electrodes and surfaces, and it will be a good alternative for further sensor development. Additionally, the simple, timesaving and effective approach could broaden the application of the GO hybrid, which provides an excellent sensing platform for the detection of biomolecule, inorganic and organic pollutants.
Table 2 The influence of the potential interferents on the DPV responses of 0.1 µmol L−1 phloroglucinol at GO/Fe(OH)
3/GCE
Interferent Concentration / (µmol L−1)
Signal change / µA
Relative error / % Phenol Pyrocatechol Hydroquinone Hydroxyphenol Pyrogallol 2-Aminophenol 4-Aminophenol 2-Chlorophenol 4-Chlorophenol Bisphenol A 2-Nitrophenol 3-Nitrophenol 2,4-Dinitrophenol Glucose 5.0 1.0 1.0 1.0 5.0 10.0 10.0 10.0 10.0 10.0 1.0 1.0 1.0 10.0 0.51 0.69 0.68 0.75 0.65 0.34 0.45 0.62 0.36 0.59 0.66 0.62 0.63 0.31 3.67 4.96 4.89 5.40 4.68 2.45 3.23 4.46 2.59 4.24 4.75 4.46 4.53 2.23
Table 3 Determination of phloroglucinol in environmental water samples by GO/Fe(OH)3/GCE
Sample Added / (nmol L-1) Amount founda / (n nmol L-1) Relative error / % RSDb / % Recovery / %
1 2 3 4 5 10.00 20.00 30.00 40.00 50.00 9.65 19.34 31.23 41.16 52.33 3.02 3.65 −1.08 2.38 −2.03 3.35 3.21 2.68 3.59 1.91 96.5 96.7 104.1 102.9 104.7
Acknowledgements
This work was supported by the National Natural Science Foundation of China (No. 21105024), the Project of Education Department of Hunan Province (No. 12C0536, No. 13JJ3112), Key Discipline Project of Hunan Province and the Youth Backbone Teacher Training Program of Hengyang Normal University (2010).
References
1. Cui, H.; Xie, C. G.; Lai, C. Z.; Luminescence 2003, 18, 318. 2. Pesez, M.; Bartos, J.; Colorimetric and Fluorimetric Methods
of Analysis, Marcel Dekker: New York, USA, 1974.
3. Kim, H.; Roh, H.; Lee, H. J.; Chung, S. Y.; Choi, S. O.; Lee, K. R.; Han, S. B.; J. Chromatogr., B: Anal. Technol. Biomed. Life Sci. 2003, 792, 307.
4. Kim, H.; Han, S. B.; Chromatographia 2003, 57, 539. 5. Guihen, E.; Glennon, J. D.; Cullinane, M.; O’Gara, F.;
Electrophoresis 2004, 25, 1536.
6. Hegde, R. N.; Hosamani, R. R.; Nandibewoor, S. T.; Colloids Surf., B 2009, 72, 259.
7. Li, J.; Kuang, D.; Feng, Y.; Zhang, F.; Liu, M.; Microchim. Acta 2011, 172, 379.
8. Wang, X. G.; Fan, Y. J.; J. Appl. Electrochem. 2009, 39, 1451. 9. Novoselov, K. S.; Geim, A. K.; Morozov, S. V.; Jiang, D.;
Zhang, Y.; Dubonos, S. V.; Grigorieva, I. V.; Firsov, A. A.; Science 2004, 306, 666.
10. Du, Y.; Guo, S.; Dong, S.; Wang, E.; Biomaterials 2011, 32, 8584.
11. Guo, S.; Wen, D.; Zhai, Y.; Dong, S.; Wang, E.; ACS Nano 2010, 4, 3959.
12. Gan, T.; Hu, C.; Chen, Z.; Hu, S.; Talanta 2011, 85, 310. 13. Gu, Z.; Yang, S.; Li, Z.; Sun, X.; Wang, G.; Fang, Y.; Liu, J.;
Electrochim. Acta 2011, 56, 9162.
14. Song, M. J.; Kim, J. H.; Lee, S. K.; Lim, D. S.; Hwang, S. W.; Whang, D.; Electroanalysis 2011, 23, 2408.
15. Cui, Y.; Zhang, B.; Liu, B.; Chen, H.; Chen, G.; Tang, D.; Microchim. Acta 2011, 174, 137.
16. Liu, T.; Xu, M.; Yin, H.; Ai, S.; Qu, X.; Zong, S.; Microchim. Acta 2011, 175, 129.
17. Wang, K.; Li, H. N.; Wu, J.; Ju, C.; Yan, J. J.; Liu, Q.; Qiu, B.; Analyst 2011, 136, 3349.
18. Wang, C.; Zhang, L.; Guo, Z.; Xu, J.; Wang, H.; Zhai, K.; Zhuo, X.; Microchim. Acta 2010, 169, 1.
19. Guo, Y.; Guo, S.; Li, J.; Wang, E.; Dong, S.; Talanta 2011, 84, 60.
20. Fan, Y.; Liu, J. H.; Lu, H. T.; Zhang, Q.; Colloids Surf., B 2011, 85, 289.
21. Zhang, F.; Li, Y.; Gu, Y.; Wang, Z.; Wang, C.; Microchim. Acta 2011, 173, 103.
22. Yin, H.; Zhou, Y.; Ma, Q.; Liu, T.; Ai, S.; Zhu, L.; Microchim. Acta 2011, 172, 343.
23. Wang, Y.; Li, Y.; Tang, L.; Lu, J.; Li, J.; Electrochem. Commun. 2009, 11, 889.
24. Yang, X. Y.; Zhang, X. Y.; Liu, Z. F.; Ma, Y. F.; Huang, Y.; Chen, Y.; J. Phys. Chem. C 2008, 112, 17554.
25. Zhang, B.; Cui, Y.; Chen, H.; Liu, B.; Chen, G.; Tang, D.; Electroanalysis 2011, 23, 1821.
26. Ren, W.; Fang, Y.; Wang, E.; ACS Nano 2011, 5, 6425. 27. Zhang, Y.; Sun, X.; Zhu, L.; Shen, H.; Jia, N.; Electrochim. Acta
2011, 56, 1239.
28. Hummers, W. S.; Offeman, R. E.; J. Am. Chem. Soc. 1958, 80, 1339.
29. Kovtyukhova, N. I.; Ollivier, P. J.; Martin, B. R.; Mallouk, T. E.; Chizhik, S. A.; Buzaneva, E. V.; Gorchinskiy, A. D.; Chem. Mater. 1999, 11, 771.
30. Ping, J.; Wang, Y.; Fan, K.; Wu, J.; Ying, Y.; Biosens. Bioelectron. 2011, 28, 204 .
31. Li, J.; Kuang, D.; Feng, Y.; Zhang, F.; Xu, Z.; Liu, M.; J. Hazard. Mater. 2012, 201, 250.
32. Tung, V. C.; Allen, M. J.; Yang, Y.; Kaner, R. B.; Nat. Nanotechnol. 2009, 4, 25.
33. Anson, F.; Anal. Chem. 1964, 36, 932.
34. Laviron, E.; J. Electroanal. Chem. 1979, 101, 19.
35. Bard, A. J.; Faulkner, L. R.; Electrochemical Methods, Fundamentals and Applications; Wiley: New York, USA, 2001. 36. Fotouhi, L.; Alahyari, M.; Colloids Surf., B 2010, 81, 110. 37. Gao, R.; Zou, H.; Yuan, Z; Chin. J. Anal. Chem. 1997, 25, 297. 38. Wang, Y. M.; Chen, L. H.; Chin. J. Anal. Sci. 2008, 24, 246. 39. Du, J. X.; Li, Y. H.; Lu, J. R.; Talanta 2001, 55, 1055. 40. Cui, H.; Li, S. F.; Lin, X. Q.; Analyst 2001, 126, 553.
Submitted: April 19, 2012


![Figure 4. (A): plot of Q vs. t curves for GCE (a) and GO/Fe(OH) 3 /GCE (b) in 0.1 mmol L −1 K 3 [Fe(CN) 6 ], (B): plot of Q vs](https://thumb-eu.123doks.com/thumbv2/123dok_br/18997554.462671/6.892.72.800.109.622/figure-plot-curves-gce-fe-gce-mmol-plot.webp)