of Chemical
Engineering
www.abeq.org.br/bjchePrinted in BrazilVol. 34, No. 02, pp. 583 - 596, April - June, 2017 dx.doi.org/10.1590/0104-6632.20170342s20150500
*To whom correspondence should be addressed
OIL REMOVAL FROM PRODUCED WATER BY
ULTRAFILTRATION USING POLYSULFONE
MEMBRANE
S. Kumar
1, B. K. Nandi
2, C. Guria
1and A. Mandal
1*1Department of Petroleum Engineering, Indian Institute of Technology (ISM), Dhanbad 826 004, India.
2Department of Fuel & Mineral Engineering, Indian Institute of Technology (ISM), Dhanbad 826 004, India.
Phone: +91 3262235485. Fax: +91 3262296632 E-mail: [email protected]
(Submitted: June 5, 2015; Revised: February 15, 2016; Accepted: February 21, 2016)
Abstract – The present paper deals with the ultrailtration (UF) of produced water using a polysulfone membrane. Membranes were prepared by the phase inversion technique using polysulfone (PSf) polymer base, poly vinyl pyrrolidone (PVP) additive and N-methyl-2-pyrrolidone (NMP) solvent. Prepared UF membranes were characterized by determining the surface morphology by scannaing electron microscopy (SEM), atomic force microscopy (AFM), porosity, (iii) water contact angle, equilibrium water content and pure water lux, whereas membrane performance was determined by measuring permeate lux and oil rejection using oily synthetic produced water. With the increase in trans-membrane pressure in the cell, the permeate lux increased signiicantly, but oil rejection showed a decreasing trend. The best UF membrane performance under diferent trans-membrane pressures was obtained by maintaining ≥90% oil rejection using an UF membrane with the following composition: PSf- 15%, PVP - 5% and NMP - 80%.
Keywords: Produced water; Polysulfone; Membrane morphology; Porosity; Ultrailtration.
INTRODUCTION
A large volume of water (called produced water) is usually produced as a byproduct during oil and gas production, which is mixed with dispersed oil, grease, dissolved solids and suspended solids (Chakrabarty et al., 2010). Discharging of produced water may pollute surface and underground water as well as soil. As per environmental regulations the permitted oil and grease limits for treated
produced water discharge ofshore is 10 mg.L-1(Mondal et al., 2008). Typical oil compositions of produced water generated during oil and gas operation are between 100 to
1000 mg.L-1 or even higher depending on the oil well and
cannot be discharged directly to the environment without
treatment (Nandi et al., 2010). Produced water may also be re-injected to some extent into the reservoir for enhanced oil recovery (EOR) after removal of oil and suspended solids to avoid damage to the oil formation (Karhu et al., 2014). Moreover, the direct disposal of produced water to the environment may cause disturbances in ecology. Thus, treatment of produced water before disposal is very important.
Several techniques are available in the literature for the treatment of produced water. In this regard, the gravity settling separation and mechanical coalescence methods are the well known traditional treatment processes. Chemical
emulsion breaking is also an efective way to separate oil
from produced water (Karhu et al., 2014). The coagulation
electrostatic and electrocoagulation separation methods were also applied to separate oil and water from produced water (Sarkar and De, 2011). However, these methods would lead to a huge production of sludge with complicated operational problems. Microwave treatment (Sahoo and De, 2010) and heat treatment (Chen and He, 2003) have been occasionally applied to oily water treatment in recent years. But all these methods are very complicated and it takes more time to separate oil from produced water (Karhu et al., 2014; Wei et al., 2013; Sarkar and De, 2011; Sahoo and De, 2010; Chen and He, 2003; Kumar et al., 2015) All
these methods are not eicient when the oil concentration
is below 400 mg.L-1 and the oil droplet size is less than one micrometer (Padaki et al., 2015).
Under such circumstances, the use of membranes ofers
a potential solution to the problem of oily produced water
puriication. The porous membrane matrix can promote
coalescence of micron and submicron oil droplets into larger ones that can be easily separated by gravity. Common membrane separation techniques employed for the
separation of oil from oily wastewater are: (i) microiltration
(Nandi et al., 2010), (ii) pervaporation (Mohammadi et al., 2003; Hlavacek, 1995), (iii) electrocoagulation (Ghosh et al., 2010), (iv) reverse osmosis (Duong and Chung, 2014;
Mahendran et al., 2004) and (v) ultrailtration (Nandi et al.,
2009; Sarkar and De, 2010; Singh et al., 2011). However, few studies addressed the application of polysulfone (PSf) membranes in wastewater treatment. Sinha and
Purkait (2013) tested a hydrophilic ultrailtration (UF) polysulfone membrane in cross low mode to treat oil ield produced water. Bhattacharjee et al. (1992) studied a tubular UF model equipped with polyvinylideneluoride membranes modiied by inorganic nano-sized aluminum particles to treat oilield-produced water. Vatanpour et al.
(2011) used poly(vinyl pyrrolidone) (PVP) as additive on poly(ether sulfone) (PES) membranes and showed
that addition of PVP increased the pure water lux. Chakrabarty et al. (2010) reported the efect of diferent
molecular weight of polyethylene glycol (PEG) on the morphology and performance of PSf membranes prepared with N-methyl-2-pyrrolidone (NMP) and dimethyl acetate (DMAc) as a solvent separately and found that the
molecular weight of PEG played a signiicant role on the
morphology and properties of the membranes prepared. Polysulfone membranes for separation of oily water were used because they has the following advantages: (i) highly resistant to mineral acids, alkali, and electrolytes, in pH ranging from 2 to 13, (ii) resistant to oxidizing agents, therefore they can be cleaned by bleaches (iii) resistant to surfactants and hydrocarbon oils, (iv) soluble in solvents like DMAc and NMP, making it easily applicable for the conventional phase inversion processes (v) good mechanical strength and permeability (vi) ability to modify the properties through blending with other polymers.
In this paper, we reported the use of polysulfone based membrane for the separation of oil from oily produced water with varying oil concentration (< 400 mg.L-1) to meet the environmental requirements. The surface morphology of the membrane was analyzed by Field Emission Scanning Electron Microscopy (FE-SEM), Atomic Force Microscopy (AFM), pore size distribution, Porosity
and pure water lux. The oil droplet size distribution of
produced water was measured to evaluate the membrane
performance. The efects of trans-membrane pressure
(TMP), oil concentration and oil droplet size in the feed on
the permeate lux and oil removal eiciency were studied.
EXPERIMENTAL
Materials
Polysulfone (MW. 75,000 Da) was supplied by Sigma-Aldrich Co, USA and was used as the main polymer in the membrane casting solution. Reagent grade N-methyl-2-pyrrolidone (99.5% purity) was supplied by Central Drug House Ltd., India, and poly(vinyl pyrrolidone) (MW. 40,000 Da) was supplied by LobaChemie Ltd, India. Crude oil was collected from the Digboi area (Oil India Limited, India) and synthetic produced water was prepared using this crude oil. The properties of crude oil, which were determined experimentally, are given in Table 1. The distilled water was used to prepare synthetic produced water (SPW). Tetrachloroethylene with purity > 99.9 % (wt/wt) was used as a solvent to measure the oil content in SPW and supplied by Beker (USA).
Preparation of synthetic produced water
Synthetic produced water (SPW) was prepared using crude oil (properties of crude oil are given in Table: 1)
procured from the Digboi oil ield, Assam, as a dispersed
phase and distilled water as a continuous phase. The measured amount of crude oil and distilled water was taken in a beaker and kept in a sonicator water bath (FB15051, Fisherbrand, Germany) for about 5-10 hrs depending upon the oil concentration at a temperature of 27°C. The
Table 1. Compositions and characteristics of crude oil
Sl. No. Parameters Values
1 Density (15.5 °C) (kg.m-3 ) 855.60 ± 10
4 Viscosity (cp) at 30°C 525 ± 10
5 Acid Number (mg KOH/g) 0.038 ± 0.002
6 Pour Point ( °C) 18 ± 0.5
7 Saturates (%wt/wt) 55 ± 2
8 Aromatics (%wt/wt) 35± 1
9 Resins (%wt/wt) 7.9± 0.1
Membrane preparation
The membrane casting solution was prepared by blending an appropriate composition of polysulfone, NMP solvent and PVP additive under constant stirring using a magnetic stirrer at 50°C for 6.0 hrs. A series of casting solutions was prepared and allowed to stand for 4.0 hours to remove air bubbles. After removing air bubbles, the casting solution was cast onto a clean glass plate and
spread uniformly at a ixed rate, keeping the desired gap
(100 µm) between glass plates and metal rod at 27°C.
After casting, the casted ilm, along with the glass plate,
was immersed horizontally into a distilled water bath at a temperature of 27°C for 24.0 hours to remove the residual solvent and to solidify the membrane. The phase immersion
precipitation occurs when the casting ilm along with the
glass plate is immersed into water. In the phase inversion process, the formation of membrane pores is controlled by both the thermodynamics of the casting solution and the kinetics of the transport process. The thermodynamics of the casting solution are related to the phase equilibrium between the components of the casting solution, while the kinetics of the transport process can be described by
the mutual difusion and transport of the components. In
the phase inversion processes, a liquid polymer solution is precipitated into two phases, i.e., a polymer-rich phase that will form the matrix of the membrane and a depleted polymer phase that will form the membrane pore in the membrane structure. The porous membrane morphology
is then ixed according to the subsequent solidiication
process. Finally, the prepared membranes were stored
in distilled water until the ultrailtration experiments. Three diferent membranes under varying composition of PSf and PVP were prepared with ixed thickness of
100 micrometer, which were designated as M1, M2, M3;
details are given in Table 3. The prepared membranes were characterized by morphological analysis using FE-SEM (Model: Supra 55, Make: Carl Zeiss, Germany) and AFM
analysis. AFM analysis were performed using a Dimension Icon (Nano Scope V, Bruker, USA) in Scan Asyst contact
and taping mode. All the images were processed using
the same Instrument (Dimension Icon) attached software. The software directly provides the values for the mean roughness.
Experimental apparatus and procedure
The membrane cell (capacity 500 ml, material of construction SS-316) was used to carry out the stirred batch
experiments with the lat circular membrane of diameter 0.068 m with efective area 3.631×10⁻³ m2. A typical
ultra-iltration setup is shown in Fig. 1. The cell was pressurized
using nitrogen gas. The permeating solution was collected from the bottom of the cell. Before using a fresh membrane, it was compacted with de-ionized water for 4 hours at a transmembrane pressure of 450 kPa which is higher than the maximum operating pressure in the present study.
Pore size distributions of membranes were measured from SEM images using the ‘ImageJ Launcher Broken Symmetry Software package’ under the assumption that the shapes of the pores are circular.
A hydrophilic membrane surface is beneicial to
antifouling and permeation performance of the membrane. In general, the hydrophilicity is evaluated by the contact angle between membrane and water. The water contact
angle of membranes is inluenced by surface roughness,
porosity, and types of additive in the membrane. To enhance the hydrophilicity of PSf membrane, poly(vinyl
Table 2. Properties of SPW used in the experiments at a temperature of 27˚C
Type of produced water
pH, ± 0.1
Oil content (mg.L-1)
TDS (ppm), ± 1
Salinity (mg.L-1),± 1
Average Oil droplet size (nm),± 10
E100 8.87 100 11 16 502
E200 8.57 200 14 19 514
E300 8.70 300 25 26 751
E400 8.20 400 33 34 938
resulting o/w emulsion showed a uniform yellowish colour. The average size and the size distribution of oil drops were estimated with a Zetasizer (Model: Nano-S90, Make: Malvern Instruments Ltd., UK). An optical microscope (Model: BX51, Make: Olympus, Japan) was used to observe the morphology of the SPW. The images were acquired by digital image extracting equipment attached
to the microscope. The total oil and grease (TOG) in SPW was measured with a TPH/TOG analyzer (Model CVH, Make: Wilks Enterprise). The total dissolved solids (TDS), salinity and pH of SPW were also measured by a multi parameter tester (Model: PCSTestr 35, Make: Singapore). The details properties of prepared SPW are shown in Table 2.
Table 3. Composition of membrane casting solutions and corresponding dry membranes
Membrane casting solutions (wt %) Dry membrane (wt%) Membrane PSf PVP NMP PSf PVP
M1 10 5 85 66.67 33.33
M2 12 5 83 70.58 29.42
pyrrolidone) (PVP) additive was used in the membrane preparation. The contact angle between water and membrane was measured using a contact angle goniometer (Drop shape Analyzer DSA25, Kruss, Germany) at a temperature of 27°C to evaluate membrane hydrophilicity. For this, accurately measured 10 µL of water was put on the membrane surface with an automatic piston syringe and photographed. To minimize the experimental errors,
the contact angle of each membrane was measured ive
times and the average value is reported.
Membrane porosity (φ) is a measure of permeate
holding capacity of the membrane and it was measured by a gravimetric method. The dried membrane samples were
weighed and then immersed into octane in order to ill the pores. Porosity, φ (%), was calculated as the quotient of
the volume of pores (Vpore) and the total volume of the dry membrane.
The volume occupied by the pores, (Vpore) was deduced
from the weight diference between dry membrane (Mdry)
and wet membrane (Mwet) sample, �����=����− ����
������� , where the density of octane (ρoctane) is 0.79 g/cm3.
Equilibrium water content (EWC) is indirectly related to the porosity and degree of hydrophilicity of the membranes and calculated by the following equation.
where W0 = wet sample weight (kg), W1 = dry sample
weight (kg).
The water lux was calculated from the experimental permeate low rate measured at every 5 min interval after attaining low stabilization.
Distilled water and produced water permeate luxes were measured using diferent membranes after compaction at diferent trans-membrane pressure using a standard lux
equation.
where Jp = permeate lux, Vp= volume of permeate, A=
area of the membrane and Δt = time taken to collect the measured amount of permeate collected at diferent
transmembrane pressures.
Percentage Oil rejection was calculated by the following equation.
where cp is the oil concentration in the permeate and cf is the oil concentration in feed.
RESULTS AND DISCUSSION
Droplet size distribution and morphology of the SPW
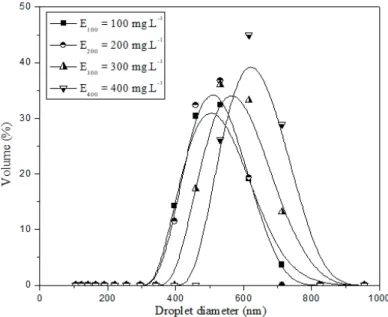
The droplet size distributions of the SPW with diferent
oil concentrations are given in Fig. 2. The droplet sizes of all these SPW show a normalized distribution with average oil droplet sizes in the range from 502-938 nm depending on the concentration of crude oil in the SPW.
The microscopic images of SPW are shown in Fig. 3. From Fig. 3 it can seen that the oil droplets are in dispersed form, whereas water is continuous. Fig. 3 is obtained
�
=
�
�����
��������× 100
���
=
�
0− �
1�
1× 100
�
�=
�∆�
�
��
% =
1
−
�
��
�× 100
Figure 1. Experimental set-up for separation of oil from produced water.
(1)
(2)
(3)
during microscopic analysis, in which oil droplets rest on a glass slide and deformed easily. Therefore, reported oil droplet size is greater than the actual size. In contrast, oil droplet size in Fig. 2 was obtained using a Zetasizer analyzer, where oil droplets were in suspension, giving a
more accurate measurement of oil droplet size distribution. As the concentration of dispersed phase, i.e., oil phase increased, the frequency of droplet collisions during agitation increased, resulting in the merger of smaller oil droplets to form bigger droplets.
Figure 2. Droplet size distributions of SPW with diferent oil concentration.
Figure 3. Optical microscopic images of synthetic produced water, E100: 100 mg.L-1, E
200: 200 mg.L -1, E
300: 300 mg.L -1, E
Characterization of membranes
Scanning electron microscopic analysis
Fig. 4A shows the top surface and Fig. 4B shows the
cross-sectional FE-SEM images of diferent membranes.
It can be seen from Fig. 4B that the membranes have an asymmetric structure and porous sub layer. The sub
layer seems to have inger – like pores as well as macro
void structures. From Fig. 4A it is found that the surface pore size decreased slightly when the PSf composition
increased from 10 % to 15%. However, the pore size,
which appears on the surface is not an efective pore of
the membrane because pores have a tortuous pattern and
therefore the efective pore size is nuch smaller than the
surface pore size. Fig. 4B shows the tortuous pattern of membrane pores. All the membranes have dense top skin layers, a porous sub-layer and sponge-like bottom layer.
These structures are formed due to the high mutual ainity
of NMP for water, resulting in instantaneous demixing.
AFM analysis of membrane
Fig.5A: shows the height sensor AFM image of
membranes M1, M2, M3 and Fig. 5B shows the pore
dimension of the corresponding membranes. Fig. 5B(i)
shows that the pore size of membrane M1 lies around 270
nm, whereas the depth of the pore is in the range of 91
nm. Fig. 5B (ii) shows that the pore size of membrane M2
lies around 200 nm, whereas the depth of the pore is in the
range of 50 nm. Similarly the pore size of membrane M3
lies around 150 nm and the depth of the pore in the range of 40 nm.
Pore size distribution
of the prepared membrane lie in the range of ultrailtration.
The pore size of membrane M1is 0.3 μm, whereas for
membrane M3 the pore size is 0.17 μm. Therefore, through
membrane M3 the water lux and oil rejection are greater
compared to the other two membranes.
The pore size decreased due to the increase in polymer (PSf) concentration and the corresponding decrease in
wt.% of PVP (on dry basis) in the membrane matrix. As the UF membrane was prepared by the phase inversion technique, the dry membrane consists of PSf and PVP, excluding NMP solvent. Therefore, the weight percent of PVP in the dry membrane will decrease with the increase of PSf.
Figure 6. Pore size distribution of membranes M1 (PSf: 10%), M2 (PSf: 12%) and M3 (PSf: 15%).
Membrane hydrophilicity
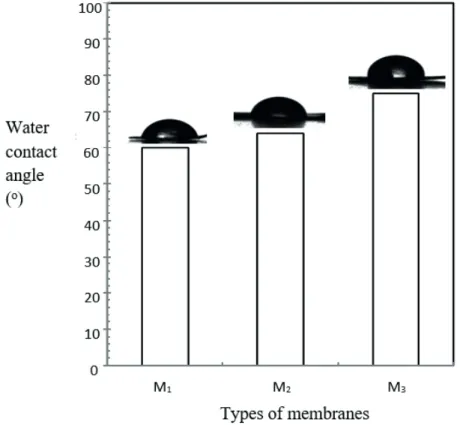
Fig. 7 shows the variation of water contact angle with
polymer (PSf) loading in the membranes. As shown in Fig.
7, the increased loading of polymer causes an increase in the contact angle (60 to 75°). This is due to increased PSf concentration in the membrane, resulting in a decrease in
hydrophilic additive (PVP) concentration in the membrane matrix. A distinct decrease in water contact angle (by 20
%) was observed for M1 (PSf: 10%) membrane over M3
(PSf: 15%) membrane. The reduction of water contact angle is a direct indication of improved hydrophilicity of the PSf-PVP membrane.
Figure 7. Variation in water contact angle of the diferent membranes M1 (PSf: 10%), M2 (PSf: 12%) and M3 (PSf: 15%).
Performance of membranes
Permeate lux
Variation of the permeate lux with pressure is shown in Figs. 8a-8c, using three diferent membranes (Table 3). It was found that the distilled water lux is higher than producing
water at a given trans-membrane pressure drop for all types of membranes. This is because in distilled water there are no dispersed particles (oil droplets) which may block the pores of the membranes. In a pressure-driven process there are various types of membrane resistances (for example, pore blocking, adsorption, membrane resistance, gel layer resistance, concentration polarization, etc). But in the case
of pure water lux, membrane resistance depends only on
the pore structures of the membrane. As the transmembrane
pressure (TMP) increased during iltration, the pore
structures of the membranes were compacted, which resulted in a decrease in the void fraction. As the decrease
in void fraction is non-linear with pressure, the resulting
pure water lux is also non-linear with TMP. The increase in the lux with an increase in TMP is due to the increase
in driving force (△p). Therefore, higher lux is obtained at
higher TMP for all the membranes. The permeate lux data
were taken under steady-state conditions under constant stirring. Constant stirring at 500 rpm will help to attain
constant lux with reduced gel polarization condition. From all three igures (Figs. 8a - 8c) it is seen that, of all the three membranes, the highest lux, 86 L.m-2.h-1, was obtained for
E1 feed through M1 membrane at a TMP of 400 kPa and
the lowest lux, 11 L.m-2.h-1, of E
4 was obtained through
M3 at a TMP of 100 kPa. For distilled water the permeate
lux gradually increased with TMP and at 100 kPa lux
was 79 L.m-2.h-1,whereas at 400 kPa the lux was 252 L.m -2.h-1. From these igures, it is seen that the permeate lux
of E1 through membrane M1 is more than that through the
M3 membrane, since the pore size and number of pores in
Oil concentration in the permeate
Variation of the oil concentration in the permeate
lux with TMP and initial oil concentration in the feed is
shown in Figs. 9a-9d. From Fig. 9a it may be seen that
the oil concentration in the permeate increased with an increase in TMP. This is due to the fact that, at higher TMP, some oil droplets penetrate the porous membranes. At a particular TMP the oil concentration in the permeate is higher for membranes with higher porosity. At 100 kPa also observed for SPW E200, E300 and E400. The pure water
lux, equilibrium water content and porosity are given in
Table 4. From Table 4, it is observed that, when the PSf composition increased from 10 % to 15 %, the pure water
lux (PWF) decreased from 90 L.m-2.h-1 to 72 L.m-2.h-1;
similarly, the equilibrium water content (EWC) decreased from 34.62% to 16% and porosity decreased from 0.37 to 0.20. These results indicate that the prepared membranes became less porous when the PSf composition increased.
Figure 8. Permeate lux of distilled water and synthetic produced water through membranes M1 (PSf: 10%), M2 (PSf: 12%) and M3 (PSf: 15%).
Table 4. Properties of the membranes used for the experiment
Membranes Pure water lux (PWF, L.m2.h-1) at 100 kPa, ± 5
Equilibrium water content
(EWC, %), ± 1 Porosity (φ), ± 0.1
M1 90 34 0.37
M2 79 18 0.27
the oil concentrations in the permeate were 21 mg.L-1, 18
mg.L-1 and 2 mg.L-1 through membranes M
1, M2 and M3, respectively, for a feed concentration of 100 mg.L-1. At the
same TMP but diferent feed concentration, i.e., 400 mg.L -1, the oil concentrations in the permeate were 36 mg.L-1, 28
mg.L-1 and 11 mg.L-1 through membrane M
1, M2 and M3, respectively. This is due to the higher oil concentration of
the feed; a number of small oil droplets pass more readily through the membrane. Similar behavior was also observed for other initial concentrations in the feed (Figs. 9b-9d).
From the igures it may also be seen that, with an increase in concentration of oil in the ield, the oil concentration in
the permeate also increases at a particular TMP.
Figure 9. Oil content in the permeate after UF through membranes M1, M2, and M3 of synthetic produced water (a) E100: 100 mg.L-1 (b) E200: 200 mg.L-1 (c) E
300: 300 mg.L -1 (d) E
400: 400 mg.L -1.
Percentage oil rejection
The rejection of oil from the SPW is calculated as
% R using Eq. (4) and is reported in Figs. 10a-d. From
these igures it is seen that % R decreased with increased
transmembrane pressure and % R increased with the
increase in feed concentration. At higher oil concentrations in the synthetic produced water, the average oil droplet size is bigger than at lower oil concentration synthetic
produced water; therefore, for the ultrailtration of higher
oil concentration synthetic produced water oil the rejection is greater than for low oil concentration synthetic produced water at higher trans-membrane pressure. This is due to the fact that, as the transmembrane pressure increases, the applied pressure overcomes the capillary pressure that prevents the oil from entering the membrane pores, leading to penetration of some oil droplets. At 100 kPa the percentage of oil rejection was found to be 79%, 82% and
Flux decline
The permeate lux of diferent membranes with respect to iltration time was calculated using Eq. 3. The lux after
a regular interval of 5 minutes was noted at 100 kPa
trans-membrane pressure and the details of lux variation with
time using M1, M2 and M3 membranes are shown in Fig.
11. It was observed from these igures that the permeate lux variation using produced water is similar to pure
water lux characteristics and it decreased rapidly during the irst 10 minutes due to oil droplet adsorption at the membrane surface and pores. The permeate lux patterns
exhibited by M3 membranes decreased more slowly than
those exhibited by M1 and M2 membranes; this is due to oil droplets blocking the pores more in membranes that have a large number of pores.
E100 = 100 mg. L-1, whereas at the same transmembrane
pressure the % R were 91 %, 93 % and 97.25 % through
membranes M1, M2 and M3, respectively, for E400 = 400
mg.L-1. Therefore, despite giving a high permeate lux, this is not recommended in order to avoid oil penetration through membrane pores. As the oil concentration in the feed increased, the concentration polarization of oil near
the membrane-water interface increased. As a result, oil will try to pass through the membrane pores at an increased rate, resulting in an increase in the oil concentration in the permeate. The maximum oil rejection is found to be 98%
with the membrane M3 for a feed concentration of 100
mg.L-1 at TMP 100kPa.
Figure 10. Percentage oil rejection through membranes M1, M2and M3 of synthetic produced water (a) E1: 100 mg.L-1 (b) E 2: 200 mg.L-1 (c) E
3: 300 mg.L
-1 and (d) E
CONCLUSIONS
In this work, the separation of oil from produced water with PSf membranes using a semi-batch cell has been
performed. The efect of increasing PSf composition of membranes on permeates lux and oil rejections has been investigated in detail. Also, the paper reported the efect of
TMP and feed concentration on membrane performance. The results of this study may be summarized as follows:
1 - For a particular TMP the permeate lux is found to
be greater with the more porous membrane. The TMP at
which the permeate lux and oil rejection are optimal is
found to be 100 kPa for all three types of membranes. 2 - The pores size as well as pore area per unit surface area (porosity) of the prepared membrane is found to decrease when the PSf composition increases.
3 - The maximum rejection was found to be 98% with
membrane M3 when the oil concentration in the emulsion
was 100 mg.L-1 at 100kpa.
4 - A signiicant increase in rejection and consequently a decrease in lux is observed in oil separation when the
polymer composition increases.
ACKNOWLEDGEMENTS
The authors gratefully acknowledge the inancial
assistance provided by the Indian Institute of Technology (ISM), Dhanbad, India (FRS (29)/2010-2011/PE), to the Department of Petroleum Engineering. Thanks are also extended to all individuals associated with the project.
NOMENCLATURE
A Membrane area (m2)
cf Oil concentration in feed (mgL-1)
cp Oil concentration in permeate (mgL-1)
Jp Permeate lux (Lm-2h-1)
L Membrane thickness (m)
P Trans-membrane pressure (Pa)
R Oil rejection (%)
t Time of iltration (h)
Vp Volume of permeate collected (L)
w0 Weight of wet membrane (kg)
w1 Weight of dry membrane (kg)
PSf Polysulfone
PVP poly(vinyl pyrrolidone)
SPW Synthetic produced water
EWC Equlibrium water content
FESEM Field Emission Scanning Electron Microscopy
AFM Atomic Force Microscopy
Greek symbols Δ Diference
φ Membrane porosity (%)
ρw Density of water (kg m-3)
REFERENCES
Bhattacharjee S., Bhattacharya P. K., Flux decline behavior
with low molecular weight solutes during ultrailtration
in an unstirred cell. Journal of Membrane Science, 72, p. 149 (1992).
Chakrabarty B., Ghoshal A. K.,Purkait M. K.,
Ultrailtration of oil-in-water emulsion: Analysis of
fouling mechanism. Membrane Water Treatment, 1, p. 297 (2010).
Chen G., He G., Separation of water and oil from water-in-oil emulsion by freeze/thaw method. Separation and
Puriication Technology, 31, p. 83 (2003).
Duong P. H. H., Chung T., Application of thin ilm
composite membranes withforward osmosis technology
for the separation of emulsiied oil-water. Journal of
Membrane Science, 452, p. 117 (2014).
Ghosh D., Medhi C. R., Purkait M. K., Treatment of Drinking Water Containing Iron Using Electrocoagulation. International Journal of Environmental Engineering, 2, p. 212 (2010).
Hlavacek M., Break-up of oil-in-water emulsions induced
by permeation through a microiltration membrane.
Journal of Membrane Science, 102, p. 1 (1995).
Karhu M., Leiviska T., TanskanenJ.,Enhanced DAF in breaking up oil-in-water emulsions. Separation and
Puriication Technology, 122, p. 231 (2014).
Kumar S., GuriaC. and Mandal A.,Synthesis, characterization and performance studies of polysulfone/bentonite nanoparticles mixed-matrix
ultra-iltration membranes using oil ield produced water. Separation and Puriication Technology, 150,
p.145 (2015).
Mahendran R., Malaisamy R., Mohan D. R., Cellulose
acetate and polyethersulfone blend ultrailtration
membrane part 1: preparation and characterizations. Polymer Advanced Technology, 15, p. 149 (2004). Mandal, A.,Ojha, K. and Ghosh, D. N.,Removal of
Color from Distillery Wastewater by Diferent
Processes,Indian Chemical Engineer, 45, p264 (2003). Mohammadi T., Kazemimoghadam M., Saadabadi, M.,
Modeling of membrane fouling and lux decline in
reverse osmosis during separation of oil in water emulsion. Desalination, 157, p. 369 (2003).
Mondal S., Wickramasinghe S.R.,Produced water treatment
by nanoiltration and reverse osmosis membranes.
Journal of Membrane Science, 322, p. 162 (2008). Nandi B. K., Das B., Uppaluri R., Purkait M. K., Studies on
submicron range microiltration inorganic membranes:
Preparation. Characterization. Membrane Water Treatment, 1, (2010).
Nandi B. K., Das B., Uppaluri R., Purkait M. K.,
Ultrailtration of Mosambi Juice using Low Cost
Ceramic Membrane. Journal of Food Engineering, 95, p. 597 (2009).
Nandi B. K., Uppaluri R., Purkait M.K.,Microiltration
of Stable Oil-in-water Emulsions using Kaolin based Ceramic Membrane and Evaluation of Fouling Mechanism. Desalination and Water Treatment, 22, p. 133 (2010).
Padaki, M., Surya Murali, R., Abdullah, M.S., Misdan, N., A. Moslehyani, M.A. Kassim, N. Hilal, A.F. Ismail
Membrane technology enhancement in oil–water
separation, Desalination, 357, p. 197 (2015).
Sahoo B. K., De S., Carsky M., Enhancement of Rheological
Behavior of Indian High Ash Coal−Water Suspension
by Using Microwave Pretreatment. Industrial Engineering Chemistry Research, 49, p. 3015 (2010). Samanta A., Ojha K., Sarkar A., Mandal A.,Mobility
Control and Enhanced Oil Recovery using Partially Hydrolyzed Polyacrylamide (PHPA).International Journal of Oil, Gas and Coal Technology, 6, (2013).
Sarkar B. and De S., Electric ield enhanced gel controlled cross-low ultrailtration under turbulent low conditions. Separation and Puriication Technology,74,
p. 73 (2010).
Sarkar B. and De S., Prediction of permeates lux for turbulent low in cross low electric ield assisted ultrailtration. Journal of Membrane Science, 369, p.
77 (2011).
Singh V., Purkait M. K., Das C., Cross low Ultrailtration
of Industrial Oily Wastewater: Experimental and
Theoretical Consideration.Separation and Puriication
Technology, 46, p. 1213 (2011).
Sinha M. K., Purkait M.K.,Increase in hydrophilicity of polysulfone membrane using polyethylene glycol methyl ether. Journal of Membrane Science, 437, p. 7 (2013).
Vatanpour V., Madaeni S. S., Moradian R., Zinadini S., Astinchap B., Fabrication and characterization of
novel antifouling nanoiltration membrane prepared
from oxidized multiwalled carbon nanotube/ polyethersulfonenanocomposite. Journal of Membrane Science, 375, p. 284 (2011).
Wei-Kang Qi, Zhong-Chen Yu, Yu-Yu Liu, Yu-You Li.,
Removal of emulsion oil from oilield ASP wastewater by internal circulation lotation and kinetic models.