Received: September 18, 2010 Accepted: November 14, 2010
Conflict of Interest Statement: The authors state that there are no financial and personal conflicts of interest that could have inappropriately influenced their work.
Copyright: © 2011 Allgayer et al.; licensee EDIPUCRS. This is an Open Access article distributed under the terms of the Creative Commons Attribution-Noncommercial-No Derivative Works 3.0 Unported License.
Influence of premolar extractions on the facial
profile evaluated by the Holdaway analysis
Influência de exodontias de pré-molares no perfil facial
avaliada pela análise de Holdaway
Susiane Allgayer a
Eduardo M. Santayana de Lima a
Maurício Barbieri Mezomo b
a Department of Orthodontics, Pontifícia Univer-
sidade Católica do Rio Grande do Sul, Porto Alegre, RS, Brazil
b Department of Orthodontics, UNIFRA, Santa
Maria, RS, Brazil
Correspondence:
Susiane Allgayer
Pontifícia Universidade Católica do Rio Grande do Sul Faculdade de Odontologia
Av. Ipiranga, 6681 – Prédio 06 – Sala 209 Porto Alegre, RS – Brazil
90619-900
E-mail: [email protected]
Abstract
Purpose: This retrospective study aimed at assessing patients treated with extraction of premolars through cephalometry in lateral teleradiography, comparing the effect of different tooth extraction protocols on the facial profile.
Methods: For this study, 87 patients (31 boys and 56 girls) were selected from the private practices of three dentists certified by the Brazilian Board of Orthodontics and Facial Orthopedics. These patients were treated with fixed edgewise appliance and divided into three groups, according to the sequence in which premolars were extracted “Group 40” comprised 22 patients treated with extractions of the first two superior premolars, adopted as the control group; “Group 44” comprised 43 patients treated with extractions of the four first premolars; and “Group 45” comprised 22 patients treated with extractions of first superior premolars and second inferior premolars. The Holdaway analysis was used to quantify and compare the group profiles before and after treatment.
Results: Student’s t-tests showed a profile improvement in all groups. When groups were compared, ANOVA showed that only the Inferior sulcus to the H line showed differences in incremental changes resulting from the treatment. Group 44 showed a significantly higher difference than Group 40.
Conclusion: We conclude that the protocols produce similar facial appearances.
Key words: Dental extraction; premolar tooth; corrective orthodontics
Resumo
Objetivo: Este trabalho retrospectivo tem como proposta avaliar pacientes tratados com exodontias de pré-molares através de cefalometria em telerradiografia de perfil, comparando o efeito de diferentes protocolos de exodontias no perfil.
Metodologia: Oitenta e setepacientes (31 meninos e 56 meninas) foram selecionados da clínica particular de três ortodontistas diplomados pelo Board Brasileiro de Ortodontia e Ortopedia Facial. Estes pacientes foram tratados com aparelho fixo Edgewise foram divididos em três grupos, compreendendo a sequência de exodontia de pré-molares empregada Grupo 40 compreendendo 22 pacientes tratados com exodontia de primeiros pré-molares superiores, Grupo 44 compreendendo 43 pacientes tratados com exodontia de quatro primeiros molares e Grupo 45 compreendendo 22 pacientes tratados com exodontia de primeiros pré-molares superiores e segundos inferiores. A Análise de Holdaway foi utilizada para quantificar e comparar os perfis antes e após o tratamento dos grupos.
Resultados: O teste t-Student mostrou melhora no perfil em todos os grupos. Quando comparados entre si, ANOVA revelou que apenas a medida sulco lábio inferior em relação à linha H apresentou diferenças nas mudanças incrementais proporcionadas pelo tratamento, em que o grupo 44 apresentou uma diferença significativamente superior ao grupo 40. Conclusão: A partir dos resultados concluiu-se que os protocolos produzem aparências faciais semelhantes.
Introduction
In recent years, there has been a noticeable increase in awareness and interest in facial aesthetics (1). The aesthetic beneits are among the main goals of orthodontic treatment, and clinicians are often asked about possible changes in the proile caused by certain treatment plan. The fact that dental extractions may cause a “lat face” (2) due to excessive retraction has discouraged this type of treatment protocol. However, extractions can beneit the proile when properly indicated (3). To protect the lip and the facial proile,
Nance(4,5)suggested the extraction of irst superior
premolars and second inferior premolars. The choice among the possible sequences of premolar extraction is based on clinical observations, with little scientiic support (6).
The study of beauty and harmony in the facial proile has long been a priority in orthodontic practice (7). Treatment mechanics have become more effective, thereby increasing the importance of soft tissues in both the diagnosis and treatment results. Holdaway (8) and Burstone (9,10) are among the many scholars who have emphasized the importance of soft tissues in diagnosis (7).
There is general agreement that orthodontic treatment can inluence the soft tissue proile of the face, but there is still disagreement on the magnitude of soft tissue response regarding changes in tooth position and alveolar process. Based on these points and using the Holdaway soft tissue analysis, this study was designed to evaluate the effects of three prescribed premolar extraction sequences (G 40, G 44 and G 45) on the lateral facial proile.
Methods
The sample was retrospectively selected from the private practice of three orthodontists certiied by the Brazilian Board of Orthodontics and Dentofacial Orthopedics. The initial (T1) and inal (T2) proile teleradiographies of 87 patients treated orthodontically with ixed edgewise appliances were divided into the following three groups according to the sequence in which premolars were extracted: 22 patients
treated with extractions of the irst two superior premolars, adopted as the control group (Group 40); 43 patients treated with extractions of the four irst premolars (Group 44) and 22 patients treated with extractions of irst superior premolars and second inferior premolars (Group 45). The mean age was 15 years (ranging from 11 to 18 years of age), with 31 boys and 56 girls. Treatment time was 3 years (ranging from 2 to 5 years).
The orthodontic mechanics included ixed edgewise appliance with 0.022”×0.028” slot brackets and a typical sequence of arches, starting with 0.0175” coaxial or 0.016” nickel titanium, followed by 0.016”, 0.018”, 0.020”, and 0.019”×0.025” steel arches (3M Unitek, Monrovia, CA). Next, sliding mechanics were used to close residual spaces.
The sample was selected based solely on the premolar extraction sequence, regardless of other dentoalveolar or skeletal characteristics. Additional inclusion criteria for this study were (1) all patients had their premolars extracted as part of their consented treatment plan; (2) all patients were Caucasian, without congenitally missing teeth or previous extractions; (3) all permanent teeth were present up to the second molars; (4) good quality of the pre- and post-treatment radiographs, taken with the lips relaxed, teeth in occlusion, and using the same cephalosta (5) no prior use of functional appliances or orthognathic surgery between the two radiographs; (6) fully closed gaps at the end of treatment; (7) gaps closed with 0.019”×0.025” steel arches; and (8) where possible, maintenance of the intercanine and intermolar distances.
The radiographs were taken in centric occlusion, according Broadbent’s technique (12), with lips at rest, as deined by Burstone (10). The cephalometric tracings in each proile teleradiography were performed manually by the same investigator and the cephalometric points were digitized into the Dentofacial Planner software (2.0 Toronto, Ontario, Canada) to obtain the cephalometric measurements. Nine linear and two angular measurements demarcated as per Holdaway (8) and deined by Basciftci et al. (13) were analyzed (Fig. 1 and 2).
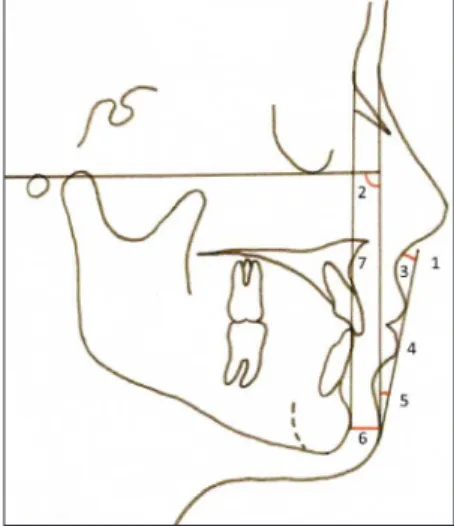
Fig. 1. Cephalometric measurements: 1, H line; 2, Soft tissue facial angle; 3, Measurement of soft tissue subnasale to H line; 4, Lower lip to H line; 5, H angle; 6, Soft-tissue chin thickness; 7, Skeletal profile convexity.
H line: tangent drawn from the tip of the chin to the upper •
lip;
Soft tissue facial angle: the downward and inner angle •
formed at a point where the sella-nasion line crosses the soft tissue and a line combining the suprapogonion with the Frankfort horizontal plane;
Measurement of soft tissue subnasale to H line: measu-•
rement from subnasale to the H line;
Lower lip to H line: the measurement of the lower lip to •
the H line;
H angle: the angle formed between the soft-tissue facial •
plane line and the H line;
Soft-tissue chin thickness: the distance between the •
hard and soft-tissue facial planes at the level of supra-pogonion;
Skeletal proile convexity: the dimension between point •
A and facial line;
Nose prominence: the dimension between the tip of the •
nose and a perpendicular line drawn to the Frankfort plane from the vermillion;
Upper lip sulcus depth: the measurement between the •
upper lip sulcus and a perpendicular line drawn from the vermillion to the Frankfort plane;
Inferior sulcus to the H line (lower lip sulcus depth): the •
measurement at the point of greatest convexity between the vermillion border of the lower lip and the H line; Basic upper lip thickness: the dimension measured •
approximately three mm below point A and the drape of the upper lip; and
Upper lip strain measurement: the dimension between the •
vermillion point and the labial surface of the upper incisor.
Error Assessment
To assess the intra-examiner error, 30 lateral tele-radiographies were randomly selected and traced again after a 3-week interval. To evaluate the agreement between the irst and second measurements, we used Student’s t test
for paired samples at a 5% signiicance level. None of the measurements presented signiicant differences, which conirmed the calibration of the examiner.
Comparative analysis among the groups in the sample
The changes from T1 to T2 were evaluated to determine statistically signiicant variations that occurred separately in each of the groups.
Statistical Analysis
Normal distribuition of the data was conirmed by the nonparametric Kolmogorov-Smirnov test, and parametric tests were therefore applied. Initial (T1) and follow-up (T2) measurements were compared by Student’s t-test for paired samples. Comparison among groups, was performed with analysis of variance (ANOVA). The results were considered statistically signiicant at a level of 5%. All statistical tests used to process and analyze the data were performed with SPSS software package (SPSS 10.0., Chicago, III).
Results
Intragroup analysis (Table 1)
In all groups there was an increase in Nose prominence (P<0.05) and a decrease in Upper lip sulcus depth, subnasale
to H line, Skeletal proile convexity, H angle, and (P<0.05).
Upper lip base thickness, Upper lip strain increased in groups 40 and 44 (P<0.05). Inferior sulcus to the H line increased
in groups 44 and 45 (P<0.05). Lower lip to H line decreased
in groups 44 and 45 (P<0.05).
Intergroup analysis (Table 2)
The results of the ANOVA test indicate that only the measurement Inferior sulcus to the H lineshowed a signiicant difference among the study groups (P<0.05). There was a
greater increase in Inferior sulcus to H line for Group 44.
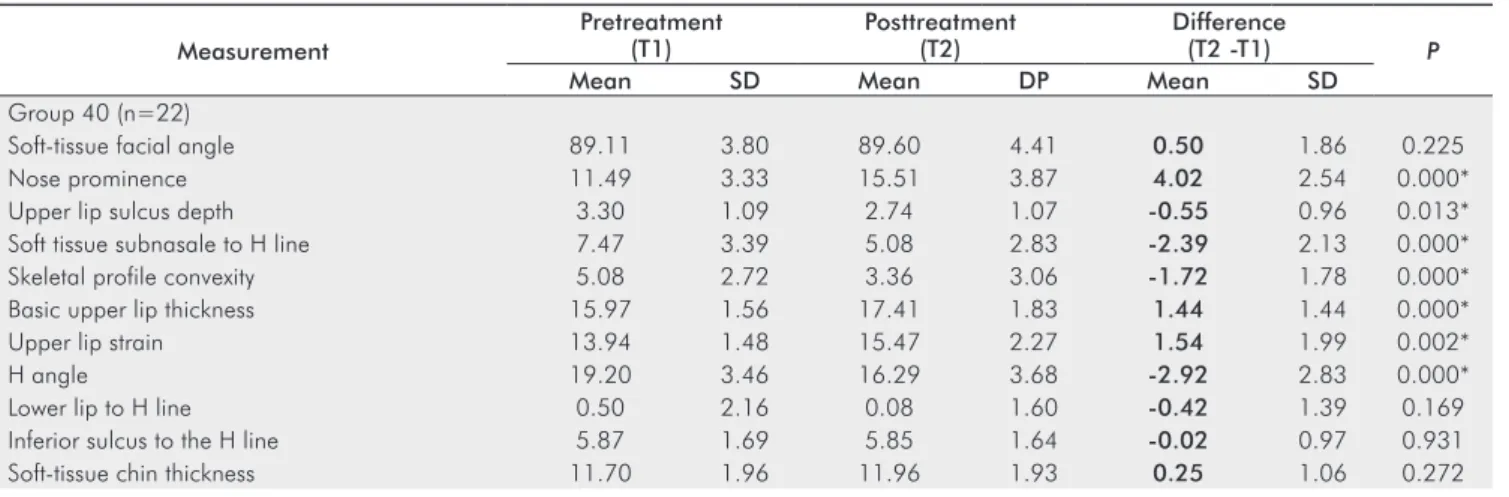
Table 1. Results of the comparison between the times T2 and T1.
Measurement
Pretreatment (T1)
Posttreatment (T2)
Difference
(T2 -T1) P
Mean SD Mean DP Mean SD
Group 40 (n=22)
Soft-tissue facial angle 89.11 3.80 89.60 4.41 0.50 1.86 0.225
Nose prominence 11.49 3.33 15.51 3.87 4.02 2.54 0.000*
Upper lip sulcus depth 3.30 1.09 2.74 1.07 -0.55 0.96 0.013*
Soft tissue subnasale to H line 7.47 3.39 5.08 2.83 -2.39 2.13 0.000*
Skeletal profile convexity 5.08 2.72 3.36 3.06 -1.72 1.78 0.000*
Basic upper lip thickness 15.97 1.56 17.41 1.83 1.44 1.44 0.000*
Upper lip strain 13.94 1.48 15.47 2.27 1.54 1.99 0.002*
H angle 19.20 3.46 16.29 3.68 -2.92 2.83 0.000*
Lower lip to H line 0.50 2.16 0.08 1.60 -0.42 1.39 0.169
Inferior sulcus to the H line 5.87 1.69 5.85 1.64 -0.02 0.97 0.931
Soft-tissue chin thickness 11.70 1.96 11.96 1.93 0.25 1.06 0.272
Group 44 (n=43)
Soft-tissue facial angle 89.03 3.49 88.73 3.70 -0.30 2.32 0.409
Nose prominence 11.10 3.12 15.73 3.42 4.62 2.53 0.000*
Upper lip sulcus depth 3.30 1.58 2.56 1.37 -0.73 1.24 0.000*
Soft tissue subnasale to H line 7.07 2.75 4.39 2.72 -2.68 2.20 0.000*
Skeletal profile convexity 3.44 2.52 1.94 2.65 -1.50 2.07 0.000*
Basic upper lip thickness 15.24 1.72 16.03 2.04 0.80 2.00 0.012*
Upper lip strain 12.72 1.70 14.07 2.21 1.35 1.87 0.000*
H angle 16.91 3.91 13.66 3.42 -3.26 3.15 0.000*
Lower lip to H line 2.55 2.00 1.22 1.68 -1.33 1.70 0.000*
Inferior sulcus to the H line 3.74 1.75 4.97 1.89 1.23 1.25 0.000*
Soft-tissue chin thickness 11.57 2.43 11.61 2.49 0.04 1.76 0.877
Group 45 (n=22)
Soft-tissue facial angle 90.59 3.29 90.98 3.78 0.39 2.96 0.548
Nose prominence 12.05 3.63 15.10 4.26 3.05 2.41 0.000*
Upper lip sulcus depth 3.34 1.34 2.66 1.64 -0.68 1.01 0.005*
Soft tissue subnasale to H line 6.20 1.83 3.78 2.32 -2.42 1.89 0.000*
Skeletal profile convexity 3.07 2.30 1.48 3.50 -1.59 1.74 0.000*
Basic upper lip thickness 14.98 1.45 15.43 1.84 0.45 1.36 0.136
Upper lip strain 12.58 1.91 13.16 2.68 0.59 1.85 0.152
H angle 15.88 3.60 13.24 4.29 -2.64 2.51 0.000*
Lower lip to H line 1.41 1.62 0.47 1.24 -0.94 1.67 0.016*
Inferior sulcus to the H line 4.23 1.63 4.85 1.53 0.62 1.25 0.030*
Soft-tissue chin thickness 11.74 2.09 11.27 2.33 -0.47 1.17 0.071
* Significant difference, P<0.05.
Measurement Group n Mean SD P
Soft-tissue facial angle Group 40 22 0.50 1.86 0.360
Group 44 43 -0.30 2.32
Group 45 22 0.39 2.96
Nose prominence Group 40 22 4.02 2.54 0.063
Group 44 43 4.62 2.53
Group 45 22 3.05 2.41
Upper lip sulcus depth Group 40 22 -0.55 0.96 0.828
Group 44 43 -0.73 1.24
Group 45 22 -0.68 1.01
Soft tissue subnasale to H line Group 40 22 -2.39 2.13 0.828
Group 44 43 -2.68 2.20
Group 45 22 -2.42 1.89
Skeletal profile convexity Group 40 22 -1.72 1.78 0.905
Group 44 43 -1.50 2.07
Group 45 22 -1.59 1.74
Basic upper lip thickness Group 40 22 1.44 1.44 0.157
Group 44 43 0.80 2.00
Group 45 22 0.45 1.36
Upper lip strain Group 40 22 1.54 1.99 0.200
Group 44 43 1.35 1.87
Group 45 22 0.59 1.85
H angle Group 40 22 -2.92 2.83 0.714
Group 44 43 -3.26 3.15
Group 45 22 -2.64 2.51
Lower lip to H line Group 40 22 -0.42 1.39 0.107
Group 44 43 -1.33 1.70
Group 45 22 -0.94 1.67
Inferior sulcus to the H line Group 40 22 -0.02A 0.97 0.001*
Group 44 43 1.23B 1.25
Group 45 22 0.62AB 1.25
Soft-tissue chin thickness Group 40 22 0.25 1.06 0.238
Group 44 43 0.04 1.76
Group 45 22 -0.47 1.17
* Significant difference, P<0.05. Means values followed by the same letter do not differ.
Table 2. Comparison of the T2-T1 differences among the study groups (incremental changes between groups).
Measurement Pretreatment (T1) Posttreatment (T2) Difference (T2-T1) P
Mean SD Mean DP Mean SD
Discussion
The growth process creates, by itself, facial changes. Therefore, the goal of many studies has been to establish a prognosis of the changes that will occur in the faces of patients under the cumulative effect of growth, development, and orthodontic treatment (14).This work was performed with patients in an active growth age group, which was part of the study inclusion criteria. Additionally, the study sample was compatible in terms of age at the beginning and end of treatment and in the duration of treatment (3,15). According to Talass (16), growth is associated with minimal changes in the soft tissues when the treatment period does not exceed 36 months.
Intragroup analysis (Tables 1 and 3)
The nose prominence increased signiicantly in all three groups. This increase was favorable because the values were all sub-standard at the beginning of treatment. Hoffelder
and Lima (17) highlighted the aesthetic implications of the size and shape of the nose, which changes up to 18 years of age. Subtenly (18) recommends that treatment during adolescence should be completed with more prominent lips due to the large expected increase in the nose and chin. Castro (5) comments that the nose “is individual”, i.e., it is
dificult to predict its growth because it varies signiicantly during the treatment period and from one patient to another. A number of studies have suggested evaluating the posture of the lips and the aesthetics (19,20) but most are inluenced by nose growth. Holdaway (8) removed nasal inluence from the labial posture assessment (7).
The Holdaway’s soft tissue analysis is the only one that determined values for the upper lip sulcus depth (2,8). There is a need to consider the upper lip curve during the treatment plan to reduce the potential for undesirable expressions in this region, apparently as a result of an excessive retraction of the upper and lower teeth during treatment.
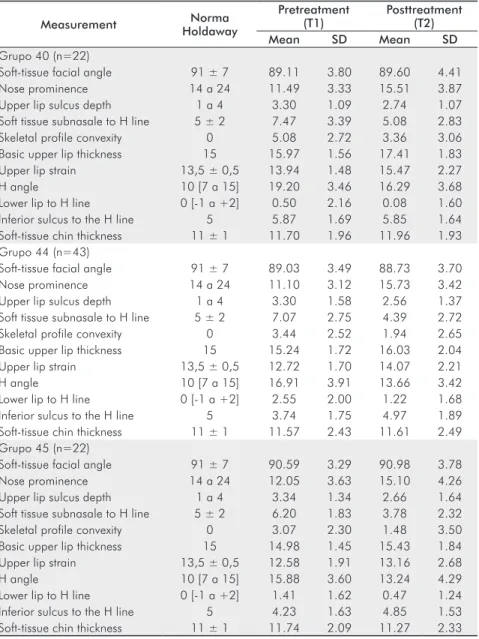
Measurement Norma
Holdaway
Pretreatment (T1)
Posttreatment (T2)
Mean SD Mean SD
Grupo 40 (n=22)
Soft-tissue facial angle 91 ± 7 89.11 3.80 89.60 4.41
Nose prominence 14 a 24 11.49 3.33 15.51 3.87
Upper lip sulcus depth 1 a 4 3.30 1.09 2.74 1.07
Soft tissue subnasale to H line 5 ± 2 7.47 3.39 5.08 2.83
Skeletal profile convexity 0 5.08 2.72 3.36 3.06
Basic upper lip thickness 15 15.97 1.56 17.41 1.83
Upper lip strain 13,5 ± 0,5 13.94 1.48 15.47 2.27
H angle 10 [7 a 15] 19.20 3.46 16.29 3.68
Lower lip to H line 0 [-1 a +2] 0.50 2.16 0.08 1.60
Inferior sulcus to the H line 5 5.87 1.69 5.85 1.64
Soft-tissue chin thickness 11 ± 1 11.70 1.96 11.96 1.93 Grupo 44 (n=43)
Soft-tissue facial angle 91 ± 7 89.03 3.49 88.73 3.70
Nose prominence 14 a 24 11.10 3.12 15.73 3.42
Upper lip sulcus depth 1 a 4 3.30 1.58 2.56 1.37
Soft tissue subnasale to H line 5 ± 2 7.07 2.75 4.39 2.72
Skeletal profile convexity 0 3.44 2.52 1.94 2.65
Basic upper lip thickness 15 15.24 1.72 16.03 2.04
Upper lip strain 13,5 ± 0,5 12.72 1.70 14.07 2.21
H angle 10 [7 a 15] 16.91 3.91 13.66 3.42
Lower lip to H line 0 [-1 a +2] 2.55 2.00 1.22 1.68
Inferior sulcus to the H line 5 3.74 1.75 4.97 1.89
Soft-tissue chin thickness 11 ± 1 11.57 2.43 11.61 2.49 Grupo 45 (n=22)
Soft-tissue facial angle 91 ± 7 90.59 3.29 90.98 3.78
Nose prominence 14 a 24 12.05 3.63 15.10 4.26
Upper lip sulcus depth 1 a 4 3.34 1.34 2.66 1.64
Soft tissue subnasale to H line 5 ± 2 6.20 1.83 3.78 2.32
Skeletal profile convexity 0 3.07 2.30 1.48 3.50
Basic upper lip thickness 15 14.98 1.45 15.43 1.84
Upper lip strain 13,5 ± 0,5 12.58 1.91 13.16 2.68
H angle 10 [7 a 15] 15.88 3.60 13.24 4.29
Lower lip to H line 0 [-1 a +2] 1.41 1.62 0.47 1.24
Inferior sulcus to the H line 5 4.23 1.63 4.85 1.53
Soft-tissue chin thickness 11 ± 1 11.74 2.09 11.27 2.33 Table 3. Descriptive comparison of
40 44 45
Premolar extraction sequences
-4 -2 0 2 4 6
Millimetres
40 44 45
Premolar extraction sequences
-4 -2 0 2 4 6
Millimetres
52
73
83
Fig. 3. Changes in the upper lip sulcus depth.
The upper lip sulcus depth and the extent of soft tissue subnasale to H were, on average, signiicantly reduced after treatment in all groups. Wholley and Woods (6) and Moseling and Woods (11) found large individual variation, with both increases and decreases in the two measures. In this study, only Group 40 showed both increases and
decreases in the upper lip sulcusdepth (Fig. 3). Holdaway (8)
indicated that skeletal proile convexity is not really a measure of soft tissue; instead, convexity is directly related to the harmonious position of the lips, being a reference of the dental relationship necessary to create balanced facial features. In this study, a signiicant reduction during the treatment period established favorable changes in the aesthetics of these patients in all groups, approximating to the ideal values.
Burstone (10) stated that one of the goals of orthodontic treatment is to minimize the stretching of the lips upon sealing in patients with dentofacial disharmonies. In the present study, the basic upper lip and upper lip strain increased in the three groups. The increase was statistically signiicant in Groups 40 and 44. When comparing Groups 44 and 45, there was a signiicant increase only in Group 44, probably where the maximum anchorage is required for greater retraction of the incisors. Other factors are associated with lip response in addition to the kind of extraction that the patient has undergone: the complex anatomy of the lip, which often has an intrinsic response property (7,14,15,21), and tension at the time of radiography (6,7,16). The lip tension varies among individuals and among time periods with the same person.
The H angle measures the prominence of the upper lip in relation to the overall soft-tissue proile. This measure was signiicantly reduced in all groups during the orthodontic treatment and approximated to the norm without matching it. This is in agreement with Cappeli (22), who reported similar indings, suggesting that the differences could be attributed to variability among the Caucasians evaluated in that study.
According to Burstone (9),support for the inferior incisors and extrusion of superior incisors project the lower lip the same way a laccid lower lip or an abnormal lip morphology affect the lower lip inclination. The lower lip was signiicantly reduced from T1 to T2 in Groups 44 and 45. Group 44 had more retraction of the lower lip (1.33) than Group 45 (0.94), which is consistent with some previous studies (4,23). In the lower arch, the extraction of second premolars is a strategy to camoulage Class II maxillary relationships. The mesial movement of inferior molars is stimulated, thereby closing the inferior gaps, correcting the molar Class II relationship. The degree of mesial movement of molars depends on the amount of space left after the alignment of lower incisors and canine retraction. Therefore, the extraction of irst superior premolars and second inferior premolars are indicated in cases with an absence of severe crowding or excessive protrusion of the lower incisors (so that the extraction spaces are available for anteroposterior tooth movement and not for the correct alignment of the
incisors). The molar moves more forward (5,23-25) when the second premolar is extracted and less retraction of the lower lip is expected when this tooth is extracted (4,23,24). However, the lower lip retraction was not statistically signiicant different between Groups 44 and 45. Hershey (14) and Wisth (21) emphasize that individual variations make lip retraction impossible to predict.
According to Holdaway (8),the contour of the inferior sulcus to the H line should be in harmony with the shape of the upper lip groove. This measure is an indicator to produce a good handling of the axial position of the lower incisors. Groups 44 and 45 had an increase in the sulcus of 1.23 and 0.62, respectively, with no statistical difference between them. This change approximated these values to the standard values. In Group 40, there were no changes (0.02). In contrast, Wholley and Woods (6) found a signiicant reduction of the sulcus in their group 45. Our lower lip groove observations also contrast with those of Wholley and Woods (6) and Moseling and Woods (11), who found large individual variation, with both increases and decreases in the measures. In the present study, only Group 40 showed both increases and decreases in the sulcus (Fig. 4). Holdaway (8)and Hershey (14) suggest that there is more variation in the lower lip area compared to the upper lip area; yet Moseling and Woods (11) found more correlation and more predictability in the inferior sulcus
than the superior.
Intergroup analysis of incremental changes (Table 2)
In this study, the inferior sulcus to the H line was the only variable that showed a signiicant difference among groups. This suggested that, when extracting the irst inferior premolars in Group 44, it was desirable a greater retraction of the lip than in Group 45, where second premolars were extracted and there was a greater mesial movement of the molars. Group 40 did not exhibit changes in the measurements
of the inferiorsulcus, which was expected as no extraction
was performed in the lower arch. The measure was in accordance with the recommended 5 mm, and changes were not desired (Table 3). As the changes caused by treatment to all other variables were similar between groups, it may be suggested that treatment protocols produce equivalent results in patients.
Conclusions
The facial proile results after treatment with various extraction protocols were similar using the Holdaway soft tissue analysis.
Acknowledgments
Conley RS, Jernigan C. Soft tissue changes after upper premolar extraction in Class II 1.
camouflage therapy. Angle Orthod 2006;76:59-65.
James RD. A comparative study of facial profiles in extraction and nonextraction treatment. 2.
Am J Orthod Dentofacial Orthop 1998;114:265-76.
Janson G, Fuziy A, Freitas MR, Henriques JFC, Almeida RR. Soft-tissue treatment changes 3.
in Class II Division 1 malocclusion with and without extractions of maxillary premolars. Am J Orthod Dentofacial Orthop 2007;132:729.e1-729.e8.
Nance HN. The removal of second premolars in orthodontic treatment. Am J Orthod 4.
1949;35:685-96.
Castro N. Second premolar extraction in clinical procedures. Am J Orthod 1974;65: 5.
115-37.
Wholley CJ, Woods MG. The effects of commonly prescribed premolar extraction sequences 6.
on the curvature of the upper and lower lips. Angle Orthod 2003;73:386-95.
Basciftci FA, Uysal T, Buyukerkmen A, Demir A. The influence of extraction treatment on 7.
Holdaway soft-tissue measurements. Angle Orthod 2004;74:167-73.
Holdaway RA. A soft -tissue cephalometric analysis and its use in orthodontic treatment 8.
planning. Part I. Am J Orthod Dentofacial Orthop 1983;84:1-28.
Leagan HL, Burstone CJ, Conn F. Soft tissue cephalometric analysis for orthognatic surgery. 9.
J Oral Surg 1980;38:744-51.
Burstone CJ. Lip posture and its significance in treatment planning. Am J Orthod 10.
1967;53:262-84.
Moseling KP, Woods MG. Lip curve changes in females with premolar extraction or 11.
nonextraction treatment. Angle Orthod 2004;74:51-62.
Broadbent BH. A new x-ray technique and its application to orthodontia. Angle Orthod 12.
1931;1:45-66.
Basciftci FA, Uysal T, Buyukerkmen A. Determination of Holdaway soft tissue norms in 13.
Anatolian Turkish adults. Am J Orthod Dentofacial Orthop 2003;123:395-400. Hershey HG. Incisor tooth retraction and subsequent profile change in postadolescent 14.
female patients Am J Orthod 1972;61:45-54.
Oliver BM. The infuence of lip thickness and strain on upper lip response to incisor 15.
retraction. Am J Orthod 1982;82:141-9.
Talass MF, Tollaae L, Baker RC. Soft-tissue profile changes resulting from retraction of 16.
maxillary incisors. Am J Orthod Dentofacial Orthop 1987;91:385-94.
Hoffelder LB, Lima EMS, Lima FMS, Bolognese AM. Soft-tissue changes during facial growth 17.
in skeletal Class II individuals. Am J Orthod Dentofacial Orthop 2007;131:490-5. Subtelny JD. The soft tissue profile, growth and treatment changes. Angle Orthod 18.
1961;31:105-22.
Ricketts RM. Esthetics environment and the law of tip relation. Am J Orthod 1968;54: 19.
272-89.
Steiner CC. Cephalometrics as a clinical tool. In: Kraus BS, Riedel R. Vistas in Orthodontics. 20.
Philadelphia:Lea&Febiger;1962.
Wisth PJ. Soft tissue response to upper incisor retraction in boys. Br J Orthod 1974;1: 21.
199-204.
Capelli JJ, Tibana RHW. Alterações no perfil facial em indivíduos submetidos a tratamento 22.
ortodôntico com extrações de quatro pré-molares. Ortodontia Gaúcha 2002;6:35-45. Logan LR. Second premolar extraction in class I and class II. Am J Orthod 1973;63: 23.
115-47.
Schwab DT. The borderline patient and tooth removal. Am J Orthod 1971; 59:126-45. 24.
Lee JS, Kim JK, Park YC, Vanardall RL. Aplicações dos miniimpantes ortodônticos. São 25.