Wilson Guilherme Nunes ROSA(a)
Ricardo de Lima NAVARRO(b)
Ana Cláudia de Castro Ferreira CONTI(a)
Marcio Rodrigues de ALMEIDA(a)
Paula Vanessa Pedron OLTRAMARI-NAVARRO(a)
(a)Universidade Norte do Paraná – UNOPAR, School of Dentistry, Department of Orthodontics, Londrina, PR, Brazil.
(b)Universidade Estadual de Maringá – UEM, School of Dentistry, Department of Dentistry, Maringá, PR, Brazil.
Assessment of cephalometric
characteristics in the elderly
Abstract: This cross-sectional study aimed at assessing the cephalometric characteristics in the elderly, taking into account differences between genders, age ranges, ethnic groups and dental aspects. The sample consisted of 250 elderly subjects of both genders (163 female, mean age: 68 yr.; 87 male: 70.4 yr.). Conventional lateral cephalograms for cephalometric analysis were scanned and analyzed by Dolphin Imaging software 11.5.
The statistical treatment of the data evaluated the inluence of gender and
age range variables (independent t test), as well as ethnic group, facial
proile, and dental characteristics (one‑way ANOVA), on cephalometric measurements. A conidence interval of 95% and level of signiicance of 5% were considered for all the tests performed. The results revealed: 1) The cephalometric measurements evaluated showed signiicantly lower values for the female gender; 2) a signiicant decrease in the cephalometric values
was observed in relation to the growth pattern, with the advancement of age;
3) signiicant cephalometric differences were observed between the ethnic groups and the facial proiles; 3) dentulous patients had greater absolute
values for all the components evaluated, followed by the individuals with partial dental losses and by those who were edentulous. It may be concluded that the cephalometric alterations observed in this study are
inherent to facial maturity, and that they represent speciic characteristics regarding each of the variables evaluated. These modiications must be
taken into account when planning the treatment for younger patients, to
minimize the modiications arising from the natural aging process.
Keywords: Orthodontics; Aged; Cephalometry.
Introduction
Although aging is a natural process, it causes several modiications
in the body. Knowing what changes individuals will experience with the advancement of age is an avenue of investigation that has taken on a relevant role in caring for the elderly, whether these changes are systemic, physiological or anatomical, or of health-related factors arising from lifestyle.1,2
Dentistry is concerned about promoting a better quality of life for the elderly, and pursues aesthetical and functional results to reestablish dental occlusion, and favor social interaction. Dental services for these patients aim at restoring oral health, according to characteristics particular to this age group, such as absence of teeth, periodontal problems, and malocclusions.3,4,5,6 Viewed within this perspective, the number of elderly
Declaration of Interests: The authors certify that they have no commercial or associative interest that represents a conflict of interest in connection with the manuscript.
Corresponding Author:
Paula Vanessa Pedron Oltramari-Navarro E-mail: [email protected]
DOI: 10.1590/1807-3107BOR-2015.vol29.0040
Submitted: May 26, 2014
people who need dental treatment has been growing, and requires that professionals undergo adequate training, so that they can assist these individuals.
A relevant aspect of orthodontics is the study of
facial aging. This analysis is an important diagnostic resource for establishing references of normality and guiding professionals during orthodontic treatment. However, studies regarding growth have historically
been centered on the irst two decades of life,7,8 since it
was believed that growth ceased right after puberty.9 Few studies9,10,11,12,13,14,15,16 have sought to understand and quantify the craniofacial alterations that occur as a consequence of aging.
Because of the scarce research with patients > 60 yr. of age, this study investigated the cephalometric characteristics in elderly individuals, taking into account differences between genders, age ranges, ethnic groups, and occlusion characteristics.
Methodology
This cross-sectional study was approved by the Human Ethics Committee of the Universidade Norte
do Paraná - UNOPAR (PP0070/09). The volunteers
were informed about the procedures by means of a
Written Free and Clariied Consent (WFCC) statement,
duly explained by the researchers and signed by the elderly individuals.
The ta rget populat ion was comprised of independent elderly people, with no physical or mental disabilities, aged ≥ 60 yr., of both genders, recruited from 38 primary healthcare centers in the
urban region of Londrina,PR, Brazil. Several health
indicators were analyzed in the elderly population of this age from the city, as part of a broader investigation
by a group conducting an Interdisciplinary Aging and Longevity Study. Note that 85% of the elderly
population commonly uses the Brazilian public health system in this city.
The representative sample size was deined as
343 of those selected from a total of 43,610 elderly individuals from Londrina.
The inclusion criteria of the study was elderly subjects who had natural teeth, or teeth rehabilitated by prostheses. Edentulous individuals who were not rehabilitated by prostheses and those with clinically
detectable facial asymmetry were excluded. The inal
study sample was reduced to 250 elderly subjects of both genders, in that 163 were women (mean age: 68 yr.) and 87 men (mean age: 70.4 yr.).
The lateral cephalograms were obtained from the same
machine (Orthopantomograph OP 100 Instrumentarium Corp., Tuusula, Finland) (17.6 s, 77 KVP, and 12 to 14 mA), with a 10% rate of magnification and with patients
placed at 1.52 m from the cephalostat. The cephalograms
were digitalized on a scanner (HP G4050, Palo Alto, USA) (600 dpi) proper for radiographs, using the ruler
for 100 mm calibrations, as recommended by the manufacturer of the Dolphin Imaging 11.5TM program
(Dolphin Imaging, Chatsworth, USA). Prior to performing
the measurements, the examiner was allowed to treat the images to improve brightness and contrast, and thus
allow better identiication of the structures. Once the images were treated, the measurements were made. One
previously calibrated examiner analyzed all the images to assess the cephalometric variables related to skeletal and soft tissue facial characteristics (Table 1, Figure 1).
Study error
Measurements of 40 randomly selected patients were repeated after a 30-day interval to evaluate the examiner’s calibration. This afforded the assessment of systematic (paired t test) and casual (error calculation as proposed by Dahlberg) errors. Just one angular
variable (SN.GoGn) of the 22 measurements assessed had a statistically signiicant systematic error. The
random errors ranged from 0.2 mm (Upper Lip-E) to
1.8 mm (Co‑Gn), and from 0.4o (SNB) to 2.8o (Gl’.Pr.Pog’).
This level of error is acceptable, and certiied the
calibration of the examiner for the study.
Statistical analysis
The data were tested regarding normal distribution,
applying the Shapiro‑Wilk test. Considering the normal
distribution of main variables, the data were described by parameters of mean and standard deviation, and parametric tests were used (independent t test and
ANOVA). Several parameters, such as gender, age, race
and occlusion characteristics, were statistically tested
to determine their inluences on the cephalometric
according to the variable to be tested. The number of subjects included in each variable comparison was stated in Table 2. The independent t test was used to
compare the inluence of gender (male or female) and
age range (60-70 yr. and > 70 yr.) on the cephalometric
measurements. In addition, one way ANOVA (Post test: Bonferroni) was used to assess the inluence of race
(white, black and Japanese) and occlusion characteristics (dentulous, edentulous and partial dental losses) on the cephalometric variables. These tests made it possible to determine which of these variables (gender, age, race
or occlusion characteristics) statistically inluenced
the cephalometric measurements made on the elderly.
All statistical tests were carried out with the Statistical Package for Social Sciences (SPSS) software (SPSS Inc., Chicago, USA), version 15.0.
Results
The characterization of the population under study is shown in Table 2.
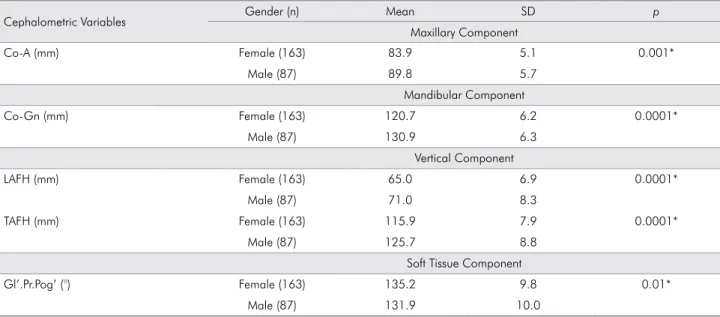
The comparisons between genders indicate statistically significant differences in the following
measurements: Co‑A, Co‑Gn, LAFH, TAFH, Gl’.Pr.Pog’ (Table 3).
W he n t he ceph a lome t r ic va r i able s were evaluated regarding age ranges, statistically significant differences were found for the following
measurements: SNB, ANB, NAP, FMA, SN.GoGn, LAFH, Gl’.Sn.Pog’, N‑B.Upper Lip‑Pog’, Upper
Lip-E, Lower Lip-E (Table 4).
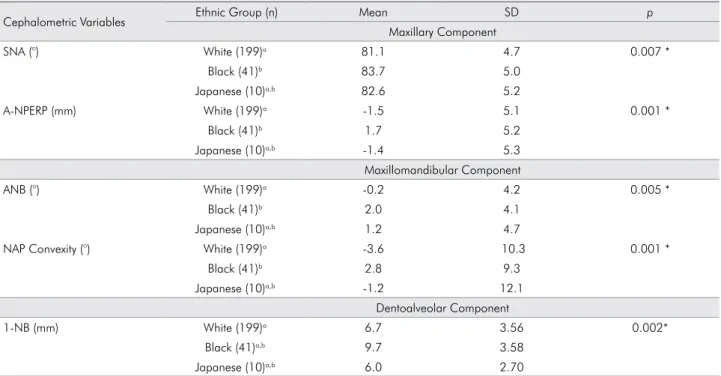
In verifying the cephalometric variables between
ethnic groups, statistically signiicant differences were found for the following measurements: SNA, A‑Nperp,
Table 1. Cephalometric variables assessed.
Maxillary Component SNA (°) Angle formed by line S-N and line N-A
A-Nperp (mm) Linear distance from point A to the line perpendicular to the Frankfort plane passing through point N Co-A (mm) Linear distance between condylion and A points
Mandibular Component SNB (°) Angle formed by line S-N and line N-B
P-Nperp (mm) Linear distance from point P to the line perpendicular to the Frankfort plane passing through point N Co-Gn (mm) Linear distance between condylion and gonion points
Maxillomandibular Relationship ANB (°) Angle formed by line N-A and line N-B
NAP Convexity (°) Angle formed by line N-A and line A-P
Vertical Component FMA (°) Angle formed by the Frankfort plane and the mandibular plane (GoMe) SN.GoGn (°) Angle formed by line S-N and line Go-Gn
LAFH(ANS-Me) (mm) Lower anterior face height TAFH (N-Me) (mm) Total anterior face height
Dentoalveolar Component
1-NA (mm) Linear distance from the most anterior point of the crown of the maxillary incisor to line N-A 1-NA (°) Angle formed by the maxillary incisor long axis and line N-A
1-NB (mm) Linear distance from the most anterior point of the crown of the mandibular incisor to line N-B 1-NB (°) Angle formed by the mandibular incisor long axis and line N-B
Soft Tissue Component
Gl’.Pr.Pog’ (°) Angle of total facial convexity including the nose formed by soft tissue glabella (Gl’) to pronasale (Pr) and pogonion (Pog’) points
Gl’.Sn.Pog’ (°) Angle of facial convexity excluding the nose formed between the lines from soft tissue glabella to subnasale (Sn) and pogonion (Pog’)
N-B.Upper Lip-Pog’ (°) Holdaway’s soft tissue angle
Upper Lip-E (mm) Linear distance between the upper lip anterior point and line E (Pr-Pog’: esthetic plane by Ricketts) Lower Lip-E (mm) Linear distance between the lower lip anterior point and line E (Pr-Pog’: esthetic plane by Ricketts)
ANB, NAP Convexity, N‑ N‑B.Upper Lip‑Pog’, Upper Lip‑E, Lower Lip‑E, 1‑NB (Table 5).
When the cephalometric variables were compared
regarding dental characteristics, statistically signiicant
alterations were found for the following measurements:
SNA, A‑Nperp, Co‑A, SNB, P‑Nperp, Co‑Gn, ANB, NAP Convexity, FMA, SN.GoGn, LAFH, TAFH, Gl’.Sn.Pog’, N‑B.Upper Lip‑Pog’, Upper Lip‑E, Lower Lip‑E (Table 6).
Discussion
This cross-sectional study investigated the facial
proile characteristics of elderly subjects, taking into
account differences between genders (male and female), age ranges (60-70 and > 70 yr.), ethnic groups (white, black and Japanese) and dental characteristics.
The comparisons regarding gender indicated
statistically signiicant differences in measurements
of the maxillary and mandibular components, and of the growth pattern (Table 3). In this study, lower values were found for the female gender in linear measurements, following the trend described in the literature9,10,11,12,14. Thilander et al.17 observed linear
measurements with absolute values that were higher in the male gender as compared with the female gender; however, their study was carried out with
a younger sample (5 to 31 yr.). Studies by Behrents10
and by Pecora et al.,9 conducted with samples of
older individuals, observed significantly higher
mean values for Co‑A and Co‑Gn measurements for men in relation to women. Likewise, the LAFH and TAFH measurements were also observed with
this same relationship between genders in studies by Behrents10 and Formby et al.14 On the other hand,
in this study, the measurement of the angle of the
facial proile including the nose (Gl’.Pr.Pog’) showed
a higher value for the female gender, in disagreement with the results by Formby et al.14 and Bishara et al.11
These results may be explained by the inluence of
the size of the nose, which tends to be larger for men as compared with women,18 leading to an angle of
the facial proile including the nose that is smaller
for males in relation to females.
When the cephalometric variables were compared regarding age ranges, statistically significant differences were found for various measurements (Table 4). Most of the cephalometric measurements Figure 1. Less usual cephalometric variables: Gl’.Pr.Pog’ (°):
Angle of total facial convexity including the nose, Gl’.Sn.Pog’ (°): Angle of facial convexity excluding the nose; N-B.Upper Lip-Pog’ (°): Holdaway’s soft tissue angle; Upper Lip-E(mm): Linear distance between the upper lip anterior point and line E (esthetic plane by Ricketts); Lower Lip-E (mm): Linear distance between the lower lip anterior point and line E.
Table 2. Characterization of the study population.
Variable Frequency
Absolute (n) Relative (%) Gender
Male 87 34.8%
Female 163 65.2%
Age
60-70 yr. 168 67.2%
> 70 yr. 82 32.8%
Ethnic groups
White 199 79.6%
Black 41 16.4%
Japanese 10 4.0%
Dental characteristics
Dentulous 49 19.6%
Edentulous 97 38.8%
Partial dental losses* 104 41.6%
Table 3. Variables that showed significant differences in the comparison between different genders (female and male): Mean, Standard Deviation (SD), independent t test (p).
Cephalometric Variables Gender (n) Mean SD p
Maxillary Component
Co-A (mm) Female (163) 83.9 5.1 0.001*
Male (87) 89.8 5.7
Mandibular Component
Co-Gn (mm) Female (163) 120.7 6.2 0.0001*
Male (87) 130.9 6.3
Vertical Component
LAFH (mm) Female (163) 65.0 6.9 0.0001*
Male (87) 71.0 8.3
TAFH (mm) Female (163) 115.9 7.9 0.0001*
Male (87) 125.7 8.8
Soft Tissue Component
Gl’.Pr.Pog’ (°) Female (163) 135.2 9.8 0.01*
Male (87) 131.9 10.0
*Statistically significant difference.
Table 4. Variables that showed significant differences as to age range: Mean, Standard Deviation (SD), independent t test (p).
Cephalometric Variables Age (n) Mean SD p
Maxillary Component
SNB (°) 60-70 yr. (168) 80.9 4.7 0.007 *
> 70 yr. (82) 82.6 4.5
Maxillomandibular Relationship
ANB (°) 60-70 yr. (168) 0.6 4.5 0.01 *
> 70 yr. (82) -0.8 3.8
NAP Convexity (°) 60-70 yr. (168) -1.0 10.6 0.003 *
> 70 yr. (82) -5.2 9.6
Vertical Component
FMA (°) 60-70 yr. (168) 26.8 6.8 0.000 *
> 70 yr. (82) 23.5 6.2
Sn.GoGn (°) 60-70 yr. (168) 31.7 7.8 0.000 *
> 70 yr. (82) 26.9 6.8
LAFH (mm) 60-70 yr. (168) 68.0 8.0 0.008 *
> 70 yr. (82) 65.2 7.6
Soft Tissue Component
Gl’.Sn.Pog’ (°) 60-70 yr. (168) 171.21 5.18 0.007 *
> 70 yr. (82) 173.03 4.54
N-B.Upper Lip-Pog’ (°) 60-70 yr. (168) 5.17 8.10 0.000 *
> 70 yr. (82) 1.26 7.23
Upper Lip-E (°) 60-70 yr. (168) -5.98 4.04 0.000 *
> 70 yr. (82) -8.07 3.89
Lower Lip-E (°) 60-70 yr. (168) -3.24 4.06 0.005 *
> 70 yr. (82) -4.80 4.17
Table 5. Comparison between the ethnic groups and the variables of maxillary component maxillomandibular relationship, and dentoalveolar component: Mean, Standard Deviation (SD), ANOVA (p).
Cephalometric Variables Ethnic Group (n) Mean SD p
Maxillary Component
SNA (°) White (199)a 81.1 4.7 0.007 *
Black (41)b 83.7 5.0
Japanese (10)a,b 82.6 5.2
A-NPERP (mm) White (199)a -1.5 5.1 0.001 *
Black (41)b 1.7 5.2
Japanese (10)a,b -1.4 5.3
Maxillomandibular Component
ANB (°) White (199)a -0.2 4.2 0.005 *
Black (41)b 2.0 4.1
Japanese (10)a,b 1.2 4.7
NAP Convexity (°) White (199)a -3.6 10.3 0.001 *
Black (41)b 2.8 9.3
Japanese (10)a,b -1.2 12.1
Dentoalveolar Component
1-NB (mm) White (199)a 6.7 3.56 0.002*
Black (41)a,b 9.7 3.58
Japanese (10)a,b 6.0 2.70
*Statistically significant difference.
Different letters indicate the differences between the groups (one-way ANOVA, posttest: Bonferroni).
Table 6. Comparison between the occlusion pattern and the variables of maxillary component, mandibular component, and maxillomandibular relationship: Mean, Standard Deviation (SD), ANOVA (p).
Cephalometric Variables Occlusal Characteristics (n) Mean SD p
Maxillary Component
SNA (°) Dentulous (49)a 83.5 3.7 0.006*
Edentulous (97)b 80.9 5.3
Partial dental losses (104)b 81.3 4.7
A-NPERP (mm) Dentulous (49)a 2.5 4.4 0.000*
Edentulous (97)b -2.4 5.1
Partial dental losses (104)b -1.2 5.1
Co-A (mm) Dentulous (49)a 89.6 6.4 0.000*
Edentulous (97)b 84.7 5.6
Partial dental losses (104)b 85.4 5.5
Mandibular Component
SNB (°) Dentulous (49)a 80.1 3.4 0.000*
Edentulous (97)b 83.3 5.3
Partial dental losses (104)a,b 80.3 4.0
P-NPERP (mm) Dentulous (49)a -0.9 7.8 0.000*
Edentulous (97)b 3.0 8.6
Partial dental losses (104)a -2.6 8.7
Co-GN (mm) Dentulous (49)a 128.1 8.0 0.000*
Edentulous (97)b 122.8 7.5
Partial dental losses (104)b 123.8 7.7
Continuation
Maxillomandibular Relationship
ANB (°) Dentulous (49)a 3.4 2.8 0.000*
Edentulous (97)b -2.4 3.6
Partial dental losses (104)b 1.0 4.1
NAP Convexity (°) Dentulous (49)a 5.9 5.9 0.000*
Edentulous (97)b -9.2 8.9
Partial dental losses (104)c -0.1 9.5
Vertical Component
FMA (°) Dentulous (49)a,c 28.0 6.1 0.000*
Edentulous (97)b 22.8 5.8
Partial dental losses (104)c 27.3 7.0
Sn.GoGn (°) Dentulous (49)a,c 33.8 6.4 0.000*
Edentulous (97)b 26.4 7.5
Partial dental losses (104)c 31.8 7.3
LAFH (mm) Dentulous (49)a 72.7 6.9 0.000*
Edentulous (97)b 62.7 7.4
Partial dental losses (104)c 68.4 6.7
TAFH (mm) Dentulous (49)a 126.0 7.9 0.000*
Edentulous (97)b 114.8 8.8
Partial dental losses (104)c 120.3 8.5
* Statistically significant differences (p<0.05).
Different letters indicate the differences between the groups (one-way ANOVA, post test: Bonferroni).
related to growth pattern (FMA, SN.GoGn, LAFH) had signiicantly lower mean values according to
advancing age (> 70 yr.), thereby showing a vertical
loss from aging. Moreover, a signiicant increase in the average value of the SNB measurement and a signiicant decrease in the ANB and NAP convexity
measurements were observed in the > 70-yr. age range. This indicates a mandibular displacement in the anti-clockwise direction. This same tendency of increased facial concavity was observed for soft tissues
(Gl’.Sn.Pog’, N‑B.Upper Lip‑Pog’, Upper Lip‑E, Lower
Lip-E). These results can be explained by the decrease in the vertical dimension due to progressive bone loss common to the elderly19,20,21,22, especially taking into account that most of the individuals analyzed in this sample had multiple dental losses. Bone reduction is a physiological process that generally starts in the third and fourth decades of life, that is more expressive in women than men22,23 and that is
greatly inluenced by the presence of teeth. Dental
losses cause an irreversible vertical resorption of the alveolar bone.19,20 These changes regarding dental
losses are more readily and signiicantly observed
in the maxilla, in relation to the mandible.24 In this
study, the probable bone loss in the maxilla and mandible due to aging and to the high degree of edentulism in this sample were determining factors for the reduction in the vertical dimension, and for the increase in facial concavity, in accordance with the measurements studied.
Considering the ethnic groups in the sample,
some statistically signiicant differences were found.
Freitas et al.25 showed that the various cephalometric
measurements evaluated had higher values for
blacks, followed by Japanese and whites. Although
the present study comprised a sample with a higher age range (> 60 yr.), the values found followed the same trend for young patients (Table 5).
Comparing the cephalometric variables regarding
dental characteristics, statistically signiicant alterations
Individuals with partial dental losses had intermediate cephalometric values, whereas edentulous individuals had lower values. This is most likely explained by alveolar bone loss resulting from the dental loss.19,20,21,22
In this study, edentulism was detected in 38.8% of the sample, a datum similar to that of the study by Salonen
et al.,26 in which edentulism was observed in 35% of the
individuals 60‑69 yrs. old, 70% in the 70‑79‑year range, and 80% in elderly subjects > 80. This high dental loss
was also observed in other studies with the elderly population,26,27 including developed countries such as
Japan, where 50% of elderly individuals 65 yr. old make
use of total prostheses; moreover, this percentage is even greater in elderly subjects >80 yr. of age.28
Taking into account the cephalometric aspects observed in this study regarding elderly subjects, it
is worth emphasizing that professionals should avoid orthodontic treatments that promote excessive retraction
of the facial proile, especially in cases of individuals with a straight proile who require dental extractions. A better understanding of the alterations inherent to
the aging process will contribute to establishing more conservative treatment protocols that will minimize the effects of aging on facial characteristics.
Conclusion
The cephalometric alterations shown in this study
are inherent to facial maturity, and present speciic
characteristics for each of the variables assessed.
These modiications must be taken into account when
planning treatments for young patients, to minimize the
modiications arising from the natural aging process.
1. Watt RG. Strategies and approaches in oral disease prevention and health promotion. Bull World Health Organ. 2005 Sep;83(9):711‑8.
2. Padilha DM, Hilgert JB, Hugo FN, Bos AJ, Ferrucci L. Number of teeth and mortality risk in the Baltimore Longitudinal Study of Aging. J Gerontol A Biol Sci Med Sci. 2008 Jul;63(7):739‑44.
3. Kokich VG. Esthetics: the orthodontic‑periodontic restorative connection. Semin Orthod. 1996 Mar;2(1):21‑30.
4. Melsen B. Preprosthetic movement of anterior teeth. Rev Belge Med Dent. 1982 May;37(3):111‑4.
5. Melsen B, Agerbaek N, Markenstam G. Intrusion of incisors in adult patients with marginal bone loss. Am J Orthod Dentofacial Orthop. 1989 Sep;96(3):232‑41.
6. Ogihara S, Marks MH. Alveolar bone upper growth in furcation area using a combined orthodontic-regenerative therapy: a case report. J Periodontol. 2002 Dec;73(12):1522‑7. 7. Meng HP, Goorhuis J, Kapila S, Nanda RS. Growth changes
in the nasal profile from 7 to 18 years of age. Am J Orthod Dentofacial Orthop. 1988 Oct;94(4):317‑26.
8. Snodell SF, Nanda RS, Currier GF. A longitudinal ceph a lome t r ic st udy of t ra n sver s e a nd ver t ica l craniofacial growth. Am J Orthod Dentofacial Orthop. 1993 Nov;104(5):471‑83.
9. Pecora NG, Baccetti T, McNamara JA Jr. The aging craniofacial complex: a longitudinal cephalometric study from late adolescence to late adulthood. Am J Orthod Dentofacial Orthop. 2008 Oct;134(4):496‑505.
10. Behrents RG. The biological basis for understanding craniofacial growth during adulthood. Prog Clin Biol Res. 1985;187:307‑19.
11. Bishara SE, Jakobsen JR, Hession TJ, Treder JE. Soft tissue profile changes from 5 to 45 years of age. Am J Orthod Dentofacial Orthop. 1998 Dec;114(6):698‑706.
12. Bishara SE, Treder JE, Jakobsen JR. Facial and dental changes in adulthood. Am J Orthod Dentofacial Orthop. 1994 Aug;106(2):175‑86.
13. Bjork A. Variations in the growth pattern of the human mandible: longitudinal radiographic study by the implant method. J Dent Res. 1963 Jan‑Feb;42(1)Pt 2:400‑11.
14. Formby WA, Nanda RS, Currier GF. Longitudinal changes in the adult facial profile. Am J Orthod Dentofacial Orthop. 1994 May;105(5):464‑76.
15. Israel H. Recent knowledge concerning craniofacial aging. Angle Orthod. 1973 Apr;43(2):176‑84.
16. West KS, McNamara JA Jr. Changes in the craniofacial complex from adolescence to midadulthood: a cephalometric study. Am J Orthod Dentofacial Orthop. 1999 May;115(5):521‑32. 17. Thilander B, Persson M, Adolfsson U. Roentgen‑
cephalometric standards for a Swedish population. A longitudinal study between the ages of 5 and 31 years. Eur J Orthod. 2005 Aug;27(4):370‑89.
18. Genecov JS, Sinclair PM, Dechow PC. Development of the nose and soft tissue profile. Angle Orthod. 1990 Fall;60(3):191‑8. 19. Ulm CW, Solar P, Ulm MR, Matejka M. Sex‑related changes
in the bone mineral content of atrophic mandibles. Calcif Tissue Int. 1994 Mar;54(3):203‑7.
20. 20. Ulm C, Kneissel M, Schedle A, Solar P, Matejka M, Schneider B, et al. Characteristic features of trabecular bone in edentulous maxillae. Clin Oral Implants Res. 1999 Dec;10(6):459‑67.
21. Kim ST, Won SY, Kim SH, Paik DJ, Song WC, Koh KS, et al. Variations in the trabecular bone ratio of the maxilla according to sex, age, and region using micro-computed tomography in Koreans. J Craniofac Surg. 2011 Mar;22(2):654‑8.
22. von Wowern N, Stoltze K. Sex and age differences in bone morphology of mandibles. Scand J Dent Res. 1978 Dec;86(6):478‑85.
23. Gulsahi A, Yuzugullu B, Imirzalioglu P, Genc Y. Assessment of panoramic radiomorphometric indices in Turkish patients of different age groups, gender and dental status. Dentomaxillofac Radiol. 2008 Jul;37(5):288‑92.
24. Glowacki J. Impact of postmenopausal osteoporosis on the oral and maxillofacial surgery patient. Oral Maxillofac Surg Clin North Am. 2007 May;19(2):187‑98, vi.
25. Freitas LM, Freitas KM, Pinzan A, Janson G, Freitas MR. A comparison of skeletal, dentoalveolar and soft tissue characteristics in white and black Brazilian subjects. J Appl Oral Sci. 2010 Mar‑Apr;18(2):135‑42.
26. Salonen L, Hellden L, Carlsson GE. Prevalence of signs and symptoms of dysfunction in the masticatory system: an epidemiologic study in an adult Swedish population. J Craniomandib Disord. 1990 Fall;4(4):241‑50.
27. Schmitter M, Rammelsberg P, Hassel A. The prevalence of signs and symptoms of temporomandibular disorders in very old subjects. J Oral Rehabil. 2005 Jul;32(7):467‑73. 28. Okubo M, Fujinami Y, Minakuchi S. Effect of complete