Wilson Maia de Oliveira Junior*
Assessment of soft profile
characteristics in Amazonian youngsters
with normal occlusion
Objective: The present study aimed to determine from a sample of Amazonian young-sters, with normal occlusion, the mean values for soft profile characteristics using cepha-lometric radiographs obtained in lateral norm. Methods: The cephacepha-lometric radiographs of the 30 youngsters, being 15 males and 15 females, with mean age of 21.6 years old, were assessed. For statistical analysis, central tendencies and dispersion measurements (mean and standard deviation) were used and, for both the comparison of the mean values of males and females and the correlations between the measurements of the soft profile and bony profile, the unpaired Student’s t-test was applied. Results and Conclu-sion: After obtaining statistical data, parameters were set based on the cephalometric norms regarding the specialized literature, revealing that all variables presented a nor-mal distribution pattern. There was sexual dimorphism for the following measurements: ANB, NAP, ANS-Me, N-ANS, Sn’-Me’, and N’-SN’. Norms were determined for all the assessed measurements. Statistical differences were observed between the norm found in the present study and those found in the specialized literature.
Abstract
Keywords: Soft proile. Normal occlusion. Amazonians.
* MSc in Orthodontics, University of São Paulo (USP). Assistant Professor, School of Dentistry, Federal University of Amazonas State (UFAM). Science Advisor, Amazonas Orthodontics Society (SOAM).
INTRODUCTION
Using information extracted from anamnesis, facial analysis, clinical examination of the oral cavity, dental casts and radiographic exams, most importantly the cephalometric radiograph, diag-nostic and treatment plan accuracy is enhanced, allowing professionals to set the ideal goals for a given orthodontic condition.
Facial morphology could be evaluated using subjective facial analysis, which might prove suf-ficient to determine parameters without the need for numerical values.4 However, not always a good
facial balance means excellent occlusion following some numerical parameters of normality.
Major contributions have been proposed over the years in the field of cephalometric analysis
How to cite this article: Oliveira Junior WM. Assessment of soft proile
characteristics in Amazonian youngsters with normal occlusion. Dental Press J Orthod. 2012 Jan-Feb;17(1):55-65.
assisting on the diagnosing and setting numeri-cal values aimed at achieving pleasant aesthetic results.12,15,17,21,24,25,29
Most authors understand and respect the rel-evance of cephalometric analysis in the literature, however they question the use of a set of values disregarding facial variations, ethnic background, cultural aspects, and especially the individual preferences of patients.9,10,16,18,31
Facial pattern outcome may fall short of what is desirable if the approach is based only on mean dental and skeletal values obtained from cepha-lometric analyses without performing a compre-hensive facial examination, in which dental and skeletal measurements do not always match the soft tissue parameters.3
Given the growing importance of orthodontic diagnosis and the need to set unique standards of normality for each population, the present research aimed to study the characteristics of a sample of Brazil’s Amazonas State youths23 from
a lateral cephalometric standpoint by evaluating the values found in this investigation and correlat-ing them with the sagittal occlusal relationship as traditionally defined in mainstream literature.2
ObjeCTIve
Based on the cephalometric assessment of the craniofacial patterns of Brazilians adoles-cent, from the Amazon State, with normal oc-clusion, the study sought to examine the fol-lowing variables:
1. The soft tissue characteristics regarding the standards recommended in the literature. 2. Whether there are correlations regarding
some soft tissue measures.
3. Whether there is sexual dimorphism.
MATeRIAl AND MeThODs sample
The sample comprised 30 subjects: 15 males and 15 females, all Caucasian, from the Bra-zilian State of Amazonas, whose parents and
grandparents hailed from the same Brazilian state. They were all students enrolled at UFAM (Federal University of Amazonas) with perma-nent dentition, normal occlusion2 and no history
of orthodontic treatment. The mean age was 21 years and 6 months, ranging from 17 years and 2 months to 26 years. The sample was selected from young people living in the Amazonas’ cap-ital city, Manaus.
Methods
Lateral radiographs were obtained of each pa-tient as well as a panoramic radiograph, intra- and extraoral photographs and a pair of dental casts.
Radiographic method
Lateral radiographs were obtained at the Cen-ter for Dental Radiology Ltda (RADIOCENTER), Manaus (AM) using an Orthotalix X-ray equip-ment, model 9200, manufactured by Dentsply, attached to a cephalostat, set at 70 kVp, 10 mA and time exposure of 1.2 seconds. The lateral ra-diographs with true vertical plane were obtained according to the following protocol:
1. Each patient was placed in the cephalostat in a standing position, their body relaxed, looking at the image of their own eyes re-flected in a 29 x 34 cm mirror fixed in front of them at a distance of 1.55 m. This mirror was previously set according to their height as they stood with their feet parallel to each other and slightly apart, and teeth in maxi-mum intercuspation (MI).
2. Then the ear-rods were smoothly inserted and positioned at the entrance to the ex-ternal auditory canals, taking care not to change the head position set in step 1. 3. A thin metal chain with a pendulum
4. The chassis position was adjusted in both the vertical and horizontal planes. The chas-sis cartridge was moved so that it lightly touched the patient’s right shoulder with-out changing his posture.
5. The radiograph was then obtained.
Obtaining the cephalogram
The cephalograms were obtained using tracing paper placed on top of the radiographs. The trac-ings were performed using 0.5 mm black lead.
Anatomical drawing
The following anatomical cranial structures32
were traced. The point where the ear-rods were positioned was replaced by the porion anatomical landmark when the shadows of the right and left points did not match.
» Glabella and nasal bones profile; » Soft tissue profile;
» Sella turcica; » Maxilla;
» Mandible, including the condyle;
» Maxillary and mandibular central incisors; » Maxillary and mandibular first molars.
Cephalometric measures Angular hard tissue measures
» ANB –Angle formed by the intersection of NA (Nasion–point A) and NB (Nasion–point B) lines.26
» NAP – Depicts the bony profile through the use of the points nasion, A and pogonion (N-A and Pg).11
» 1.NA – Describes upper incisor inclination in relation to the maxilla.30
» 1.NB – Describes lower incisor inclination in relation to the mandible.30
Linear hard tissue measures
» 1-NA – Describes the protrusion or retrusion of maxillary incisors.30
» 1-NB – Describes the protrusion or retrusion of mandibular incisors.30
» ANS-Me (ALFH) – Describes the anterior lower facial height through the distance between the anterior nasal spine (ANS) and the menton (Me).20
» N-ANS – Distance between the nasion and anterior nasal spine skeletal points; depicts the length of the midface.
» Overjet – Greater dental overlap in the hori-zontal direction, measured from the most anterior point of the labial surface of lower incisors, paral-lel to the occlusal plane.
» Overbite – Greater dental distance in the verti-cal plane between the incisal edge of the upper inci-sors and the incisal edge of the lower inciinci-sors.
Angular soft tissue measures
» ANB angle in soft tissue = a’n’/ n’b’ – Char-acterizes the facial discrepancy between maxilla and mandible, as measured through upper and lower lip inclination.
» Angle of the chin/neck line = sn’/gn’-gn’/c’ – Characterizes the angle of the lower face.
» Angle of facial convexity = g’/sn’/pg’ – Charac-terizes the kind of soft tissue profile.
» Labionasal angle = cm’/sn’/Ls’ – Charac-terized by upper lip inclination and/or size of nasal prominence.
» Labiomental angle = Li’/Lm’/pg’ – Charac-terized by lower lip inclination and/or mandibular prognathism or retrognathism.
Soft tissue linear measures
» n-subnasale – Linear length from the soft tissue nasion point to the subnasale angle.
» Subnasale-me’(ALFH’) – Soft tissue anterior lower facial height.
sTATIsTICAl MeThOD
It was also checked whether or not the sample measurements corroborated the values reported in the literature. In cases of sexual dimorphism verification was performed separately in male and female subjects. However, where dimorphism was not present the comparison was performed using the entire sample, with no gender differentiation.
Subsequently, the correlation between the hard tissue measures was assessed using Pearson’s6
correlation and other tests to verify if this correla-tion was different from zero.
ResUlTs
After the cephalometric tracings were performed
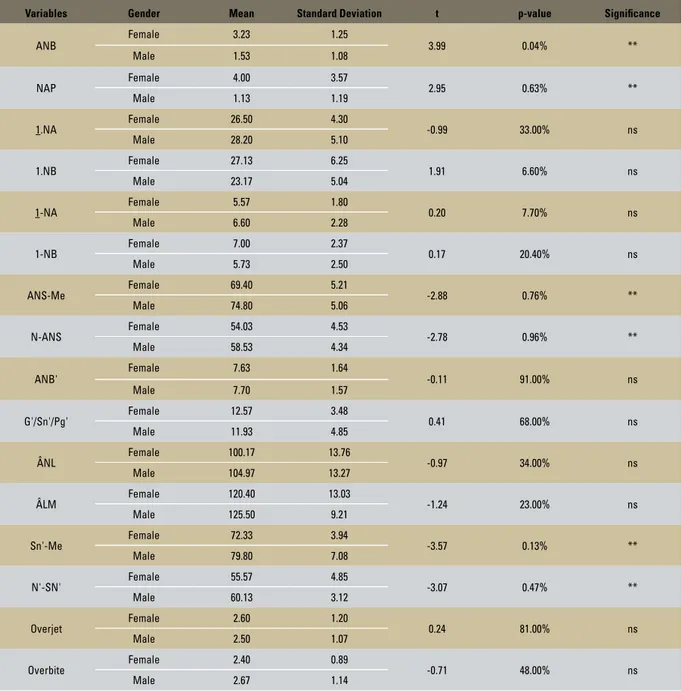
TABLE 1 - Central tendency and dispersion measures. t-test and significance. Variables compared between males and females.
ns= nonsignificant; * = significant at p≥ 1%; ** significant at p< 1%.
Variables Gender Mean Standard Deviation t p-value Signiicance
ANB Female 3.23 1.25 3.99 0.04% **
Male 1.53 1.08
NAP Female 4.00 3.57 2.95 0.63% **
Male 1.13 1.19
1.NA Female 26.50 4.30 -0.99 33.00% ns
Male 28.20 5.10
1.NB Female 27.13 6.25 1.91 6.60% ns
Male 23.17 5.04
1-NA Female 5.57 1.80 0.20 7.70% ns
Male 6.60 2.28
1-NB Female 7.00 2.37 0.17 20.40% ns
Male 5.73 2.50
ANS-Me Female 69.40 5.21 -2.88 0.76% **
Male 74.80 5.06
N-ANS Female 54.03 4.53 -2.78 0.96% **
Male 58.53 4.34
ANB' Female 7.63 1.64 -0.11 91.00% ns
Male 7.70 1.57
G'/Sn'/Pg' Female 12.57 3.48 0.41 68.00% ns
Male 11.93 4.85
ÂNL Female 100.17 13.76 -0.97 34.00% ns
Male 104.97 13.27
ÂLM Female 120.40 13.03 -1.24 23.00% ns
Male 125.50 9.21
Sn'-Me Female 72.33 3.94 -3.57 0.13% **
Male 79.80 7.08
N'-SN' Female 55.57 4.85 -3.07 0.47% **
Male 60.13 3.12
Overjet Female 2.60 1.20 0.24 81.00% ns
Male 2.50 1.07
Overbite Female 2.40 0.89 -0.71 48.00% ns
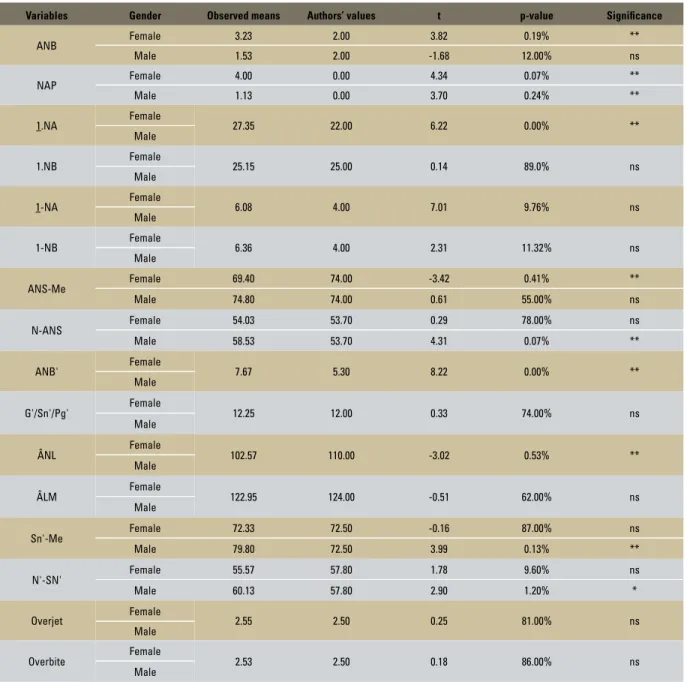
and the measurements obtained, Table 1 was formu-lated to depict the means,standard deviations and Stu-dent’s t-test with their respective significance, aiming to verify similarities of means between genders. Table 2 presents the means, standard deviations, and t-test results with their respective significance used to assess the similarities of means between the values found by
the present study, for males and females, and those found in the literature after comparing the means between the two groups (male and female). Correla-tions between cephalometric and soft tissue exami-nations are shown in Table 3. Figures 1 to 12 present the measures for which correlations were assessed, showing significance in Figs 6, 8, 9, 11 and 12.
TABLE 2 - Central tendency and dispersion measures. t-test and significance. Variables compared between male and female with the means reported in the literature.
Variables Gender Observed means Authors’ values t p-value Signiicance
ANB Female 3.23 2.00 3.82 0.19% **
Male 1.53 2.00 -1.68 12.00% ns
NAP Female 4.00 0.00 4.34 0.07% **
Male 1.13 0.00 3.70 0.24% **
1.NA Female 27.35 22.00 6.22 0.00% **
Male
1.NB Female 25.15 25.00 0.14 89.0% ns
Male
1-NA Female 6.08 4.00 7.01 9.76% ns
Male
1-NB Female 6.36 4.00 2.31 11.32% ns
Male
ANS-Me Female 69.40 74.00 -3.42 0.41% **
Male 74.80 74.00 0.61 55.00% ns
N-ANS Female 54.03 53.70 0.29 78.00% ns
Male 58.53 53.70 4.31 0.07% **
ANB' Female 7.67 5.30 8.22 0.00% **
Male
G'/Sn'/Pg' Female 12.25 12.00 0.33 74.00% ns
Male
ÂNL Female 102.57 110.00 -3.02 0.53% **
Male
ÂLM Female 122.95 124.00 -0.51 62.00% ns
Male
Sn'-Me Female 72.33 72.50 -0.16 87.00% ns
Male 79.80 72.50 3.99 0.13% **
N'-SN' Female 55.57 57.80 1.78 9.60% ns
Male 60.13 57.80 2.90 1.20% *
Overjet Female 2.55 2.50 0.25 81.00% ns
Male
Overbite Female 2.53 2.50 0.18 86.00% ns
Male
12 10 8
6
0 4 2
70 80 90 100 110 120 130 140
90 80 100 110 120 130 140 150
10
15 15
20 20
25 25
30 30
35 35
40 40
5
5 4
3 2 1
0 6 12
14
10 8 6
0 4 2
80
80 70 60
90
90
100
100
110
110
120
20 25 30 35 40
120
130
130
140
140
150
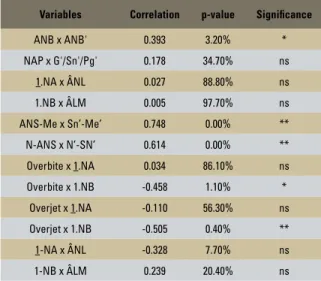
15 TABLE 3 - Correlations and significance between soft tissue and hard
tissue variables.
FIGURE 1 - Correlation between ÂNL and 1-NA (mm).
FIGURE 4 - Correlation between 1.NB and ÂLM. FIGURE 5 - Correlation between overjet and 1.NA. Variables Correlation p-value Signiicance
ANB x ANB' 0.393 3.20% *
NAP x G'/Sn'/Pg' 0.178 34.70% ns
1.NA x ÂNL 0.027 88.80% ns
1.NB x ÂLM 0.005 97.70% ns
ANS-Me x Sn’-Me’ 0.748 0.00% ** N-ANS x N’-SN’ 0.614 0.00% ** Overbite x 1.NA 0.034 86.10% ns Overbite x 1.NB -0.458 1.10% * Overjet x 1.NA -0.110 56.30% ns Overjet x 1.NB -0.505 0.40% **
1-NA x ÂNL -0.328 7.70% ns
1-NB x ÂLM 0.239 20.40% ns
1-NA (mm)
Hard tissue
1.NB_ÂLM Overjet_1.NA
1.NA ÂNL
Soft tissue
Overjet
1-NA_ÂNL
FIGURE 2 - Correlation between ÂLM and 1-NB (mm). FIGURE 3 - Correlation between 1.NA and ÂNL.
1-NB (mm) Soft tissue
Hard tissue 1.NA_ÂNL
ÂLM 1-NB_ÂLM
5 4 3 2
1 0 6
10 15 20 25 30 35 40
5
5 4 3 2
1
0 6
15 20 25 30 35 40
5 4 3
2 1 0
0
0 6
10
10
-4 4 6 8 10 12
95
85 90
75 70 65 60 55 50
50 55 60 65 70 75 80 85 90
-2 2
15
15
20
20
25
25
30 35 40
5
5
12 10 8 6
5 6
0 0 4 2
2 3 4
1
70
70 65
65 60
60 55
55 50
50 45
45 40
40 35 30
Overjet
Overbite
Overbite
1.NB 1.NA
FIGURE 6 - Correlation between overjet and 1.NB.
FIGURE 8 - Correlation between overbite and 1.NB.
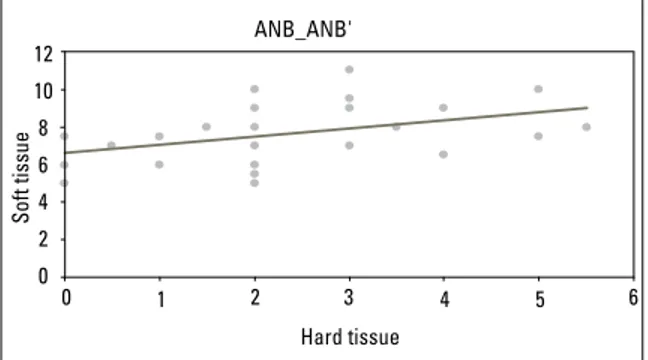
FIGURE 10 - Correlation between NAP and G’/Sn’/Pg’. FIGURE 11 - Correlation between ANS-Me and SN'-Me'. FIGURE 9 - Correlation between ANB and ANB’. FIGURE 7 - Correlation between overbite and 1.NA.
1.NB
ANB_ANB' Overbite_1.NB
NAP_G’/Sn’/Pg’ ANS-Me_SN'-Me'
Soft tissue
Soft tissue Soft tissue
Hard tissue
Hard tissue Hard tissue
FIGURE 12 - Correlation between N-ANS and N’-SN’. N-ANS_N’-SN’
Soft tissue
Hard tissue
DIsCUssION
ANB
The mean and standard deviation of an-gle ANB were 3.23±1.25º for females and 1.53±1.08º for males (Table 1), with significant differences between the genders. Significant statistical differences were also found when comparing the male and female groups using the values reported in the literature (Table 2),
which was indicative of greater convexity in young Amazonian youths.1,7,14,19,22,30
Sexual dimorphism was found in the female group, who exhibited a mean value of 3.23.23
NAP
The mean and standard deviation of NAP angle were 4±3.5º for females and 1.13±1.8º for males (Table 2), which showed statistically significant differences, indicating sexual dimor-phism with greater convexity in females. On the other hand, the mean value of 2.57º found for the whole sample showed no significant dif-ference when compared with literature values. However, the values detected in Caucasians, i.e., 1.6º (adults) and 4.2º (children), point to lower convexity than in Amazonians, while regional studies have found 9.8º, suggesting greater con-vexity in this ethnic group.11,22,23,26
It is known that the NAP angle varies in the different ethnic groups and this fact should be con-sidered when diagnosing and planning treatment.23
1.NA
The mean and standard deviation for 1.NA angle were 27.35±4.7º (Table 2). Statistically sig-nificant differences were found in the dentofacial pattern between the axial inclination in the up-per central incisors and the NA line, indicating a more anterior dental inclination in Amazonian patients when compared with the values found in the literature.22
1.NB
A value of 25.25º (Table 2) was found in the Amazonian sample, indicating more proclined lower incisors.1,7,19,23,30
1-NA
The mean and standard deviation for the max-illary central incisor distance were 6.08±2.04 mm (Table 2). No statistically significant differences were found, however a tendency of greater
pro-clination was observed in Amazonians’ maxillary central incisors when compared to the values re-ported in the literature.30
1-NB
The mean found for the Amazonians was 6.36mm. This finding indicates that this group’s protrusion is higher than the values reported in the literature.1,7,19,23
ANS-Me
It seems reasonable to accept as desirable the mean value obtained for this measure (72.8mm) when comparing the two groups (male and fe-male). However, in separating the groups there were no statistically significant differences in males, but there were statistical differences in the female group.20
Nasolabial angle
The mean and standard deviation of the naso-labial angle were 102.57±13.5º (Table 2), showing significant difference for this variable in compari-son to mean values found in the literature.3,13,28
There was no significant difference between genders for this variable (Table 1).
Labiomental angle
The mean and standard deviations found for this angle were 122.95±11.12º (Table 2), ranging between 110º and 152º. The mean values and stan-dard deviations observed for males and females were respectively 120.4±13.03º and 125.5º±9.21º (Table 1) and when these values were statistically compared to the values described in the literature, no difference was found.27,33
Facial convexity angle
Based on what has hitherto been described, it can be seen that there is reasonable consis-tency between exams. This was predictable and supports the key objective of this investigation, which is precisely to determine how and when these measures correlate.7,17
The results showed no significance for the fol-lowing measures: 1-NA X ÂNL; 1-NB X ÂLM; 1.NA X ÂNL; 1.NB X ALM; Overjet X 1.NA; Overbite X 1.NA; NAP X G’/Sn’/ Pg’.
Moderate correlation was found for angles ANB X ANB’ (r=0.39), significant at 3.20%, in a direct relationship, i.e., the greater the hard tissue ANB angle, the greater the soft tissue ANB’ angle, showing that skeletal discrepancy strongly reflects facial morphology.
Moderate correlation was also found for mea-sures Overbite X 1.NB (r=-0.45), significant at 1.1%, in an inverse relationship, i.e., the greater the overbite, the smaller the 1.NB angle.
High correlations were found for the following measures:
» ANS-Me X Sn’-Me’ (r=0.74), significant at 0%, in a direct relationship, i.e., the greater the anterior lower facial height measured in the hard tissue, the greater the soft tissue measure of the anterior lower facial height.
» N-ANS X N’-SN’ (r=0.61), significant at 0%, in a direct relationship, i.e., the greater the ante-rior midfacial height measured in the hard tissue, the greater the anterior midfacial height measured in the soft tissue of the radiographic image.
» Overjet X 1.NB (r=0.5), significant at 0.4%, in a direct relationship, i.e., the greater the overjet, the greater the 1.NB angle measured in the teeth and hard tissue respectively.
In checking the correlation between skeletal and soft tissue values for the measures described in Table 3, it was observed that skeletal and facial convexity NAP X G’/Sn’/Pg’ (r=0.17) showed no correlation, probably because the NAP angle is measured by its supplement, i.e., measured using the AP line’s superior elongation, which helps to
define the degree of convexity, and/or due to the facial convexity angle reading, which is measured inferiorly, justifying the lack of correlation owing to the tendency toward mandibular retrusion that characterizes the Amazonian sample.
At first it was expected that a correlation be-tween the values for inclination and protrusion of upper incisors and the nasolabial angle 1.NA X ANL (r=0.02) and 1-NA X ÂNL (r= –0.32) would be found, which did not occur. This was probably caused by the fact that the composition of the ÂNL angle is dependent on the shape of the nose, which, in fact, means that one may on occasion find significant incisor inclination, and given the nose shape, the measurements of the nasolabial angle may vary, i.e., even in the pres-ence of different tooth inclinations one can still find the same nasolabial angle, since the latter holds no significant correlation with the upper incisors and, by inference, must exhibit high de-pendence on the position and shape of the base of the nose (columella).
The linear distances from the skeletal nasion to the anterior nasal spine and from the soft tissue nasion to the subnasale (middle third), as well as from the skeletal anterior nasal spine to the ton and from the subnasale to the soft tissue men-ton (lower third), all measured with cephalom-etry, showed statistically significant correlations of 0.01% N-ANS X N’-SN’ (r=0.6) and ANS-Me X Sn’-Me’ (r=0.74), precisely because the two mea-surement methods have similar designs.
field, that requires further study methods in order to establish an evidence-based orthodontics.
FINAl CONsIDeRATIONs
Several studies have demonstrated the clini-cal importance of individualizing cephalometric analyses in terms of dental and skeletal patterns of Brazilians and their influence on soft tissue profile. From a genetic standpoint, the mixing of races in Brazil accentuates the difficulty in finding cepha-lometric measurements capable of epitomizing a “Brazilian pattern.” Faced with these efforts to standardize measures, orthodontists should treat each case by taking into account the patient’s in-dividual characteristics as well as their own clini-cal experience in correctly interpreting the data.
Although Brazilians born in the Amazon State, southern Brazil, São Paulo State and São Paulo City share the same nationality, it is understandable that values change from region to region since Brazil is a country with continental dimensions inhabited by a diverse ethnic, cultural and religious population, in contrast to other nations. Therefore, it affords fertile ground for investigations of this nature.
CONClUsIONs
In determining the mean values of normality for skeletal, dental and soft tissue cephalometric measures for young Amazonians with normal oc-clusion and a mean age of 21 years and 5 months, it was concluded that:
1. The facial soft tissue characteristics rela-tive to the values advocated by other authors showed statistical differences in the following cephalometric measures: Angular measures ANB’, G’/Sn’/Pg’, nasolabial angle, and men-tolabial angle; and linear measures Sn’-Me and N’-SN’, indicating a more convex profile in young Amazonians.
2. Significant results were observed in the following correlations: ANB X ANB’, ANS-Me X Sn’-Me’, N-ANS X N’-SN’, and Overjet X 1.NB. No statistically significant values were found for other correlations.
Contact address
Wilson Maia de Oliveira Junior
Rua 6, 192 – Conj. Castelo Branco, Parque Dez Zip code: 69.055-240 – Manaus / AM, Brazil E-mail: [email protected]
1. Almeida PDE, Vigorito JW. Estudo comparativo entre os padrões cefalométricos-radiográicos de Steiner e de brasileiros, leucodermas, portadores de oclusão normal. Ortodontia. 1988;21(1):73-84.
2. Angle EH. Classiication of malocclusion. Dent Cosmos. 1899; 41(2):248-64.
3. Arnett GW, Bergman RT. Facial keys to orthodontic diagnosis and treatment planning – part II. Am J Orthod Dentofacial Orthop. 1993;103(5):395-411.
4. Bittner C, Panchez H. Facial morphology and malocclusions. Am J Orthod Dentofacial Orthop. 1990;97(4):308-15.
5. Burstone CJ. The integumental proile. Am J Orthod. 1958;44(1):1-25.
6. Bussab WO, Morettin PA. Estatística básica. 4ª ed. São Paulo: Atual; 1987.
7. Cerci V. Estudo comparativo de leucodermas brasileiros em relação aos padrões das análises de Steiner e Downs [dissertação]. Rio de Janeiro (RJ): Universidade Federal do Rio de Janeiro; 1979. 8. Cotton WN, Takano WS, Wong WM. The Downs analysis applied to
three other ethnic groups. Angle Orthod. 1951;21(4):213-20. 9. Czarnecki ST, Nanda RS, Currier GF. Perceptions of balanced facial
proile. Am J Orthod Dentofacial Orthop. 1993;104(2):180-7. 10. De Smit A, Dermaut L. Soft-tissue proile preference. Am J Orthod.
1984;86(1):67-73.
11. Downs WB. Variations in facial relationships: their signiicance in treatment and prognosis. Am J Orthod. 1948;34(10):812-40. 12. El-Mangoury NH, Mostafa YA, Rasmy EM, Salah A. Faciometrics:
a new syntax for facial feature analysis. Int J Adult Orthodon Orthognath Surg. 1996;11(1):71-82.
13. Epker BN, Fish L. Evaluation and treatment planning. Dentofacial Deformities. 1986;1:9.
14. Fêo PS. Estudo cefalométrico de algumas relações entre a estrutura dento-esquelética e o peril mole da face inferior [tese]. Bauru (SP): Universidade de São Paulo;1971.
15. Holdaway RA. A soft-tissue cephalometric analysis and its use in orthodontic treatment planning. Part I. Am J Orthod. 1983;84(1):1-28.
16. Jacobson A. Planning for orthognathic surgery – art or science? Int J Adult Orthodon Orthognath Surg. 1990;5(4):217-24.
17. Legan HL, Burstone CJ. Soft tissue cephalometric analysis for orthognathic surgery. J Oral Surg. 1980;38(10):744-51. 18. Lehman JA Jr. Soft-tissue manifestations of aesthetic defects
of the jaws: Diagnosis and treatment. Clin Plast Surg. 1987 Oct;14(4):767-83.
ReFeReNCes
19. Martins DR. Estudo comparativo dos valores cefalométricos das análises de Downs, Tweed, Steiner e Alabama, com os adolescentes brasileiros, leucodermas, de origem mediterrânea [tese]. Bauru (SP): Universidade de São Paulo; 1979.
20. McNamara JA Jr. A method of cephalometric evaluation. Am J Orthod. 1984;86(6):449-69.
21. Merriield LL. The proile line as an aid critically evaluating facial esthetics. Am J Orthod. 1966;52(11):804-22.
22. Moraes C, Freitas MR, Henriques JFC. Cefalometria: determinação do padrão esquelético das adolescentes melanodermas brasileiras com “oclusão normal”. Ortodontia. 1988;22(2):4-14.
23. Oliveira Jr, WM, Vigorito JW. Estudo comparativo cefalométrico radiográico das características dento-esqueléticas e dos tecidos moles da face em jovens amazonenses com oclusão dentária normal [dissertação]. São Paulo (SP): Universidade de São Paulo; 2003. 24. Ricketts RM. Esthetics, environment, and the law of lip relation. Am
J Orthod. 1968;54(4):272-89.
25. Riedel RA. Esthetics and its relation to orthodontic therapy. Angle Orthod. 1950;20(3):168-78.
26. Riedel RA. The relation of maxillary structures to cranium in malocclusion and normal occlusion. Angle Orthod. 1952; 22(3):142-5.
27. Scheideman GB, Bell WH, Legan L, Finn, RA, Reisch JS. Cephalometric analysis of dentofacial normals. Am J Orthod. 1980;78(4):404-20.
28. Silva Filho OG, Freitas SF, Cavassan AO. Prevalência de oclusal normal e má oclusão em escolares da cidade de Bauru (São Paulo). Parte I: relação sagital. Rev Odont USP. 1990;4(2):130-7;1990. 29. Skinazi GLS, Lindauer SJ, Isaacson RJ. Chin, nose, and lips, normal
ratios in young men and women. Am J Orthod Dentofacial Orthop. 1994;106(5):518-23.
30. Steiner CC. Cephalometrics for you and me. Am J Orthod. 1953;39:729-55.
31. Suguino R, Ramos AL, Terada HH, Furquim LZ, Maeda L, Silva Filho OG. Análise facial. Rev Dental Press Ortod Ortop Facial. 1996;1(1):86-107.
32. Vigorito JW. Ortodontia clínica preventiva. 2nd ed. São Paulo: Artes
Médicas; 1986.
33. Wolford LM, Hilliard FW. The surgical-orthodontic correction of vertical dentofacial deformities. J Oral Surg. 1981 Nov;39(11):883-97.
Submitted: January 21,2008