Infrared and Raman spectroscopic characterization of the carbonate mineral
weloganite – Sr
3
Na
2
Zr(CO
3
)
6
3H
2
O and in comparison with selected carbonates
Ray L. Frost
a,⇑, Yunfei Xi
a, Ricardo Scholz
b, Fernanda Maria Belotti
c, Mauro Cândido Filho
daSchool of Chemistry, Physics and Mechanical Engineering, Science and Engineering Faculty, Queensland University of Technology, GPO Box 2434, Brisbane Queensland 4001, Australia bGeology Department, School of Mines, Federal University of Ouro Preto, Campus Morro do Cruzeiro, Ouro Preto, MG 35,400-00, Brazil
cFederal University of Itajubá, Campus Itabira, Itabira, MG 35,903-087, Brazil
dMining Engineer Department, School of Mines, Federal University of Ouro Preto, Campus Morro do Cruzeiro, Ouro Preto, MG 35,400-00, Brazil
h i g h l i g h t s
"We have studied the mineral weloganite Na2Sr3Zr(CO3)63H2O using vibrational spectroscopy.
"Weloganite is member of the mckelveyite group, that includes donnayite-(Y) and mckelveyite-(Y).
"A comparison is made with the spectra of weloganite with other carbonate minerals.
a r t i c l e
i n f o
Article history:
Received 13 December 2012
Received in revised form 5 February 2013 Accepted 5 February 2013
Available online 12 February 2013
Keywords:
Raman spectroscopy Weloganite Carbonate
Infrared spectroscopy Zirconium
a b s t r a c t
The mineral weloganite Na2Sr3Zr(CO3)63H2O has been studied by using vibrational spectroscopy and a
comparison is made with the spectra of weloganite with other carbonate minerals. Weloganite is mem-ber of the mckelveyite group that includes donnayite-(Y) and mckelveyite-(Y).
The Raman spectrum of weloganite is characterized by an intense band at 1082 cm 1with shoulder
bands at 1061 and 1073 cm 1, attributed to the CO2
3 symmetric stretching vibration. The observation
of three symmetric stretching vibrations is very unusual. The position of CO2
3 symmetric stretching
vibration varies with mineral composition. The Raman bands at 1350, 1371, 1385, 1417, 1526, 1546, and 1563 cm1are assigned to them
3(CO3)2 antisymmetric stretching mode. The observation of
addi-tional Raman bands for them3modes for weloganite is significant in that it shows distortion of the car-bonate anion in the mineral structure. The Raman band observed at 870 cm 1is assigned to the (CO
3)2
m2bending mode. Raman bands observed for weloganite at 679, 682, 696, 728, 736, 749, and 762 cm 1 are assigned to the (CO3)2 m4bending modes. A comparison of the vibrational spectra is made with that of the rare earth carbonates decrespignyite, bastnasite, hydroxybastnasite, parisite, and northupite.
Ó2013 Elsevier B.V. All rights reserved.
1. Introduction
The carbonates are a group of over 130 naturally occurring min-erals containing the essential structural building block (CO3)2 [1]. Most of these minerals are relatively rare and quite often in asso-ciation with other building blocks such as hydroxyls, halogens, sul-fate, silicate, and phosphate.
Weloganite is a hydrated carbonate of Na, Sr and Zr. It is ideal chemical formula is given by Na2Sr3Zr(CO3)63H2O and belongs to triclinic system, P1 or P 1 space group, with cell parameters a= 8.988, b= 8988, c= 6.730 Å,
a
= 102.84, b= 116.42, andc
= 59.99°[2]. The six carbonate groups and three water molecules in weloganite are linked together by six cations with the coordina-tions 10 (for the three Sr2+), 9 (for the Zr4+) and 6 (for the two Na+).Each water molecule is hydrogen-bonded to two oxygens with average bond lengths of 2.794 Å [3]. The mineral was described from St-Michel, Montreal Island, Quebec, Canada. It occurs in an alkalic sill, 5–10 feet thick, which has intruded Trenton (Ordovi-cian) limestone [4,5]. Weloganite is member of the mckelveyite group, that includes donnayite-(Y) and mckelveyite-(Y)[6].
The Francon quarry consists of sequence of Ordovician-age limestone belonging to the Montréal Formation of the Trenton Group, and interbedded sills of alkaline sienite, monzonite, alkali olivine basalt and lamprophyre [8]. Weloganite crystals up to 5.0 cm occur in miarolitic cavities. Other minerals in association are strontianite – SrCO3, hydrodresserite – BaAl2(CO3)2(OH)43H2O, cryolite Na3AlF6, calcite – CaCO3, viitaniemiite – Na(Ca,Mn) Al(PO4)(F,OH)2(OH), siderite – FeCO3, pyrrhotite – Fe1 xS, molybde-nite – MoS2, mordenite – (Na2,Ca,K2)4[Al8Si40O96]28H2O, barite – BaSO4, celestine – SrSO4, and dolomite – CaMg(CO3)2 among others.
0022-2860/$ - see front matterÓ2013 Elsevier B.V. All rights reserved. http://dx.doi.org/10.1016/j.molstruc.2013.02.005
⇑ Corresponding author. Tel.: +61 7 3138 2407; fax: +61 7 3138 1804.
E-mail address:[email protected](R.L. Frost).
Contents lists available atSciVerse ScienceDirect
Journal of Molecular Structure
Weloganite is named in honor ofSir William E. Logan, first director of the Geological Survey of Canada, 1842–1869, who laid the foundation of Canadian knowledge in the geology of the area
[4,5].
Studies concerning the mineralogy of weloganite mineral are rare in the literature and to the best knowledge of the authors, data about vibrational spectroscopic characterization are restricted to the database of the University of Arizona (rruff.info), however no interpretation is given. No Raman spectroscopic investigation of these carbonate phases related to the mckelveyite group has been published. However, in recent years, the application of spectro-scopic techniques to understand the structure of secondary miner-als has been increasing.
The objective of this paper is to report the vibrational spectro-scopic study of a weloganite mineral and relate the spectra to the molecular chemistry and the crystal chemistry of this carbon-ate mineral. We have characterized weloganite using Raman and infrared spectroscopy, with support of scanning electron micros-copy in the mineral characterization.
2. Experimental
2.1. Samples description and preparation
The weloganite sample studied in this work was obtained from the collection of the Geology Department of the Federal University of Ouro Preto, Minas Gerais, Brazil, with sample code SAA-135. The sample is from the type locality for the mineral, the Francon quar-ry, located in the midst of Montréal, Québec province, Canada[7]. The sample was gently crushed and the associated minerals were removed under a stereomicroscope Leica MZ4. Scanning elec-tron microscopy (SEM) was applied to support the mineralogical characterization.
2.2. Scanning electron microscopy (SEM)
Experiments and analyses involving electron microscopy were performed in the Center of Microscopy of the Universidade Federal de Minas Gerais, Belo Horizonte, Minas Gerais, Brazil (http:// www.microscopia.ufmg.br).
Weloganite single crystal up to 2 mm was coated with a 5 nm Au. Secondary Electron and Backscattering Electron images were obtained using a JEOL JSM-6360LV equipment. A qualitative and semi-quantitative chemical analysis in the EDS mode was per-formed with a ThermoNORAN spectrometer model Quest and was applied to support the mineral characterization.
2.3. Raman microprobe spectroscopy
Crystals of weloganite were placed on a polished metal surface on the stage of an Olympus BHSM microscope, which is equipped with 10, 20, and 50 objectives. The microscope is part of a Renishaw 1000 Raman microscope system, which also includes a monochromator, a filter system and a CCD detector (1024 pixels). The Raman spectra were excited by a Spectra-Physics model 127 He–Ne laser producing highly polarized light at 633 nm and collected at a nominal resolution of 2 cm 1 and a precision of ±1 cm 1in the range between 200 and 4000 cm 1. Repeated acqui-sitions on the crystals using the highest magnification (50) were accumulated to improve the signal to noise ratio of the spectra. Ra-man Spectra were calibrated using the 520.5 cm 1line of a silicon wafer. The Raman spectrum of at least 10 crystals was collected to ensure the consistency of the spectra.
2.4. Infrared spectroscopy
Infrared spectra were obtained using a Nicolet Nexus 870 FTIR spectrometer with a smart endurance single bounce diamond ATR cell. Spectra over the 4000–525 cm 1 range were obtained by the co-addition of 128 scans with a resolution of 4 cm 1and a mirror velocity of 0.6329 cm/s. Spectra were co-added to improve the signal to noise ratio. The infrared spectra are given in the Sup-plementary information.
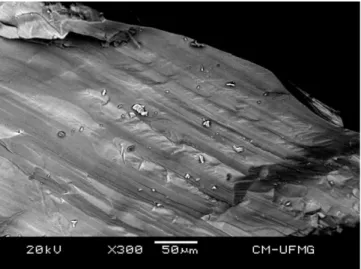
Fig. 1.Backscattered electron image (BSI) of a weloganite crystal up to 0.5 mm in length.
Fig. 2.(a) Raman spectrum of weloganite (upper spectrum) and (b) infrared spectrum of weloganite (lower spectrum).
Spectral manipulation such as baseline correction/adjustment and smoothing were performed using the Spectracalc software package GRAMS (Galactic Industries Corporation, NH, USA). Band component analysis was undertaken using the Jandel ‘Peakfit’ soft-ware package that enabled the type of fitting function to be se-lected and allows specific parameters to be fixed or varied accordingly. Band fitting was done using a Lorentzian–Gaussian cross-product function with the minimum number of component bands used for the fitting process. The Gaussian–Lorentzian ratio was maintained at values greater than 0.7 and fitting was under-taken until reproducible results were obtained with squared corre-lations ofr2greater than 0.995.
3. Results and discussion
3.1. Chemical composition of weloganite
The SEM image of weloganite sample studied in this work is shown inFig. 1. Weloganite single crystal shows a perfect cleavage along the {0 0 01} plane. Qualitative chemical analysis shows a Sr, Zr and Na carbonate with minor amounts of Ca. The observed ele-ments via SEM/EDS are in agreement with the chemical composi-tion of weloganite.
4. Spectroscopy of the carbonate anion
Nakamoto[9]first published and tabulated the selection rules for unidenate and bidentate anions including the carbonate anion.
The free ion, CO2
3 with D3hsymmetry exhibits four normal vibra-tional modes; a symmetric stretching vibration (
m
1), anout-of-plane bend (
m
2), a doubly degenerate asymmetric stretch (m
3)and another doubly degenerate bending mode (
m
4). Thesymme-tries of these modes are A0
1(R) + A001(IR) + E0(R, IR) + E00(R, IR) and occur at 1063, 879, 1415 and 680 cm 1 respectively. Generally, strong Raman modes appear around 1100 cm 1due to the sym-metric stretching vibration (
m
1), of the carbonate groups, whilein-tense IR and weak Raman peaks near 1400 cm 1are due to the antisymmetric stretch (
m
3). Infrared modes near 800 cm 1arede-rived from the out-of-plane bend (
m
2). Infrared and Raman modesaround 700 cm 1region are due to the in-plane bending mode (
m
4). This mode is doubly degenerate for undistorted CO23 groups. As the carbonate groups become distorted from regular planar sym-metry, this mode splits into two components. Infrared and Raman spectroscopy provide sensitive test for structural distortion of CO2
3 .
5. Spectroscopy
The Raman spectrum of weloganite in the 100–4000 cm 1 spec-tral range is displayed inFig. 2a. This figure shows the position and relative intensities of the Raman bands. There are large parts of the spectrum where no intensity is observed and thus, the spectrum is divided into sections depending upon the type of vibration being studied. The infrared spectrum of weloganite over the 500– 4000 cm 1 spectral range is shown in Fig. 2b. Again, there are large parts of the spectrum where no intensity is observed, and
the spectrum may be subdivided into sections according to the type of vibration being examined.
The Raman spectrum of weloganite in the 800–1400 cm 1 spec-tral range is displayed inFig. 3a. The spectrum is dominated by a very intense sharp band at 1082 cm 1assigned to the CO2
3
m
1sym-metric stretching mode. The main band has shoulders at 1073 and 1061 cm 1. Low intensity Raman bands are found at 1350, 1371 and 1385 cm 1. These bands are attributed to the CO2
3
m
3 antisym-metric stretching modes. In the infrared spectrum shown inFig. 3b, the CO23
m
1symmetric stretching mode is observed as a number of bands at 1057 and 1065 cm 1with shoulder bands at 1048, 1072 and 1080 cm 1.A comparison may be made with other carbonate minerals. The symmetric stretching bands of carbonate for azurite and malachite were observed at 1090 and 1095 cm 1. Goldsmith and Ross report the infrared bending modes of carbonate at 837 and 817 cm 1for azurite and at 820 and 803 cm 1for malachite[10]. Two
m
3modes were observed at 1490 and 1415 cm 1for azurite and at 1500 and 1400 cm 1 for malachite. The observation of these two bands shows a loss of degeneracy. Such a conclusion is also supported by the observation of two
m
4modes at 769 and 747 cm 1forazur-ite and 710 and 748 cm 1for malachite. The vibrational spectros-copy of these two minerals is complicated by this loss of degeneracy. Schmidt and Lutz report some vibrational spectro-scopic data[11].
A further comparison may be made with some heavy metal car-bonates. The Raman spectra of bastnasite are characterized by a single intense band at 1096 cm 1 for the Pakistan mineral and 1085 cm 1for the mineral from Canada. The position of the band for the bastnasite from Norway is 1097 cm 1. The variation of the band position is a function of the chemical composition of the mineral. Farmer clearly shows the variation of the symmetric stretching mode as a function of the cation ionic radius[12]. Fun-damentally the higher the ionic radius the lower the wavenumber of the symmetric stretching mode. It is proposed that the three symmetric stretching modes of the carbonate anion in the decre-spignyite structure are due to the presence of different adjacent cations. The Raman spectrum of parisite[13]shows two intense bands centered at 1088 cm 1. Evidence of splitting of this band is observed. Two bands are observed at 1086.5 and 1090.5 cm 1; a result which is in agreement with the results for the infrared spec-tra of parisite where two bands at 1088 and 1078 cm 1were ob-served[14].
In the Raman spectrum a low intensity band at 870 cm 1 is noted. This band is assigned to the CO2
3
m
4out-of-plane bending mode. This band shows much greater complexity in the infrared spectrum. Two distinct bands are observed at 849 and 868 cm 1 with a shoulder band at 838 cm 1. A comparison of band positions may be compared with other heavy metal carbonates. The com-plexity of the carbonate symmetric stretching region of decre-spignyite-(Y) is reflected in the carbonate bending region. Four bands are observed at 791, 815, 837 and 849 cm 1. These bands are assigned to the (CO3)2m
2bending modes. In the infraredspec-trum, bands are observed at 776, 787 and 800 cm 1. Wallwork et al.[15]also observed complexity in this spectral region; how-ever no bands were defined or assigned. In contrast the Raman band for bastnasite is asymmetric and two bands may be resolved at 865 and 845 cm 1. For the mineral hydroxybastnasite, the sym-metry is reduced and two low intensity bands are observed at 798 and 779 cm 1. The
m
2 bending mode is readily observed at 873 cm 1for the parisite mineral sample. In contrast, parisite min-eral samples two distinct bands are observed at around 866 and 844 cm 1. For the mineral northupite a single very intense Raman band at 879 cm 1is observed. This band position is in excellent agreement with that reported by Adler and Kerr[14]. One conclu-sion that can be made is that the observation of one or more
bend-ing modes depends on the chemical composition of the halogenated carbonate.
The Raman spectrum in the 300–800 cm 1spectral range is dis-played inFig. 4a. A series of Raman bands are observed between 650 and 780 cm 1. Raman bands are observed at 679, 682, 696, 728, 736, 749, and 762 cm 1. These bands are all attributed to the CO2
3
m
2 in-plane bending mode. In the infrared spectrum (Fig. 4b), an equivalent series of bands at 655, 668, 679, 699, 706, 718, 748, and 761 cm 1are assigned to the CO23
m
2in-planebend-ing modes.
Raman bands are observed for decrespignyite at 694, 718 and 746 cm 1and are assigned to the (CO
3)2
m
4bending modes.Infra-red bands are observed at 645, 678, 692, 724, and 745 cm 1and are attributed to this vibrational mode. The Raman band observed at 729 cm 1for the bastnasite is assigned to the
m
4bending mode. Farmer in his treatise shows that there is a relationship between the position of the
m
4mode and the ionic radius of the cation inthe carbonate structure[12]. The variation in the position of the
m
4band reflects the composition of the bastnasite. Two bands areobserved for hydroxybastnasite at 602 and 569 cm 1. Whether these bands are ascribable to the
m
4mode is uncertain. For theparisite mineral multiple bands are observed in the
m
4 region.Bands are observed at 789, 736, 739 and 712 cm 1. In the Raman spectrum of bastnasite a very low intensity band is observed at 735 (Pakistan) and 719 cm 1(Canada). Two Raman bands are ob-served for the parisite mineral sample at 682 and 742 cm 1. In the infrared spectrum of northupite a low intensity band at 714 cm 1is observed. Adler and Kerr also determined a band at 711 cm 1for northupite[14]. This band is assigned to the
m
4 bend-ing mode. A comparison of this spectral region may be made with other carbonate minerals. For rosasite a number of infrared bands
Fig. 4.(a) Raman spectrum of weloganite (upper spectrum) in the 300–800 cm1 spectral range and (b) Raman spectrum of weloganite (lower spectrum) in the 100– 300 cm1spectral range.
are observed at 776, 748 and 710 cm 1. These bands are assigned to the
m
4(CO3)2 bending modes. In the Raman spectrum, bandsare observed at 751 and 719 cm 1. For malachite two infrared bands are observed at 748 and 710 cm 1which are assigned to this
m
4(CO3)2 bending vibration[16,17].The broad Raman band at 550 cm 1may be ascribed to a water librational mode. The very intense broadish Raman band at 354 cm 1 with shoulders at 326 and 372 cm 1 are assigned to Zr–O stretching vibrations. The far low wavenumber region is dis-played inFig. 4b. Strong Raman bands are found at 142, 149, 156, 228, and 280 cm 1. These bands are ascribed to external vibrations. The Raman spectrum of weloganite in the 2600–3800 cm 1is shown in Fig. 5a. Raman bands found at 3329, 3376 and 3403 cm 1are attributed to the water stretching bands. The infra-red spectrum of weloganite in the 2600–3800 cm 1spectral range is reported inFig. 5b. Infrared bands are observed at 2914, 3295 and 3377 cm 1. Again, these bands are attributed to water stretch-ing vibrations. The observation of multiple bands in the Raman and infrared spectrum provides support for the concept that the water molecules in the weloganite structure are not equivalent.
The Raman spectrum of bastnasite displays bands in similar positions at 3651, 3620, 3526, 3355, 3276, 3169, and 3203 cm 1. The three higher wavenumber bands (3651, 3620, and 3526 cm 1) are most likely assignable to OH stretching vibrations. Raman spectra of a Chinese bastnasite have been published but no spectral information is available for comparison in this spectral re-gion[18]. Another study reported some Raman data for rare earth carbonates [19]. However no spectral information in the OH stretching region was reported. The Raman spectrum of the hydroxybastnasite shows several bands at 3741, 3535, 3430, 3352, and 3317 cm 1. For this mineral OH units replace F in a
com-plex structure. It is possible that all of this set of bands is attribut-able to OH stretching vibrations. Aleksandrov described two types of bastnasites namely fluorobastnasite and hydroxybastnasite[20]. Another paper described the IR spectra in this spectral region with no detail except to state bands were observed[21]. For the mineral parisite broad bands in the OH stretching region are observed. Four Raman bands are observed at 3661, 3517, 3316 and 3180 cm 1.
The Raman spectrum of weloganite in the 1400–1800 cm 1 spectral range is illustrated inFig. 6a. The two Raman bands at 1622 and 1681 cm 1are attributed to water bending modes. The observation of two bending modes supports the concept of non-equivalent water molecules. The infrared spectrum in the 1300–1800 cm 1spectral range is reported inFig. 6b. The series of infrared bands at 1322, 1354, 1376, 1413, 1502, 1524, 1552, and 1569 cm 1 are all attributed to the CO2
3
m
3 antisymmetric stretching modes. The Raman band at 1417 cm 1 together with the low intensity Raman bands at 1526, 1548 and 1563 cm 1are assigned to the CO23
m
3 antisymmetric stretching modes. Thetwo infrared bands at 1611 and 1680 cm 1are attributed to water bending modes.
6. Conclusions
We have used vibrational spectroscopy to study aspects of the molecular structure of weloganite Na2Sr3Zr(CO3)63H2O. Weloga-nite is member of the mckelveyite group that includes donnay-ite-(Y) and mckelveydonnay-ite-(Y). Multiple bands are observed in both the Raman and infrared spectra of weloganite providing evidence for the distortion of the carbonate anion in the weloganite struc-ture, resulting in a loss of symmetry. This distortion is further
Fig. 5.(a) Raman spectrum of weloganite (upper spectrum) in the 2600–4000 cm1 spectral range and (b) infrared spectrum of weloganite (lower spectrum) in the
2600–4000 cm 1spectral range. Fig. 6.(a) Raman spectrum of weloganite (upper spectrum) in the 1400–2000 cm
evidenced by the number of bands in the in-plane and out-of-plane bending regions. Multiple bands are observed in both the Raman and infrared spectra in the OH stretching region, proving that the water molecules are not equivalent in the weloganite structure.
Acknowledgements
The financial and infra-structure support of the Discipline of Nanotechnology and Molecular Science, Science and Engineering Faculty of the Queensland University of Technology, is gratefully acknowledged. The Australian Research Council (ARC) is thanked for funding the instrumentation. The authors would like to acknowledge the Center of Microscopy at the Universidade Federal de Minas Gerais (http://www.microscopia.ufmg.br) for providing the equipment and technical support for experiments involving electron microscopy. R. Scholz thanks to FAPEMIG – Fundação de Amparo à Pesquisa do Estado de Minas Gerais (Grant No. CRA – APQ-03998-10).
Appendix A. Supplementary material
Supplementary data associated with this article can be found, in the online version, at http://dx.doi.org/10.1016/j.molstruc.2013. 02.005.
References
[1] P.A. Williams, Oxide Zone Geochemistry, Ellis Horwood Ltd., Chichester, West Sussex, England, 1990.
[2] T.T. Chen, G.Y. Chao, Canadian Mineralogist 13 (Pt. 1) (1975) 22. [3] J.D. Grice, G. Perrault, Canadian Mineralogist 13 (Pt. 3) (1975) 209. [4] A.P. Sabina, Paper – Geological Survey of Canada 79-1A (1979) 115. [5] A.P. Sabina, J.L. Jambor, A.G. Plant, Canadian Mineralogist 9 (1968) 468. [6] M.E. Back, J.A. Mandarino, Mineralogical Record (2008).
[7] P. Tarassoff, L. Horvath, E. Pfenninger-Horvath, Mineralogical Record 37 (2006) 5.
[8] G.N. Eby, 22 (1985) 1103.
[9] K. Nakamoto, Infrared Spectra of Inorganic and Coordination Compounds, 1963.
[10] J.A. Goldsmith, S.D. Ross, Spectrochimica Acta, Part A: Molecular and Biomolecular Spectroscopy 24 (1968) 2131.
[11] M. Schmidt, H.D. Lutz, Physics and Chemistry of Minerals 20 (1993) 27. [12] V.C. Farmer, Mineralogical Society Monograph 4: The Infrared Spectra of
Minerals. 1974.
[13] R.L. Frost, M.J. Dickfos, Journal of Raman Spectroscopy 38 (2007) 1516. [14] H.H. Adler, P.F. Kerr, American Mineralogist 48 (1963) 839.
[15] K. Wallwork, U. Kolitsch, A. Pring, L. Nasdala, Mineralogical Magazine 66 (2002) 181.
[16] R.L. Frost, W.N. Martens, L. Rintoul, E. Mahmutagic, J.T. Kloprogge, Journal of Raman Spectroscopy 33 (2002) 252.
[17] R.L. Frost, Z. Ding, J.T. Kloprogge, W.N. Martens, Thermochimica Acta 390 (2002) 133.
[18] H. Fan, K. Tao, Y. Xie, K. Wang, Yanshi Xuebao 19 (2003) 169.
[19] W. Hong, S. He, S. Huang, Y. Wang, H. Hou, X. Zhu, Guangpuxue Yu Guangpu Fenxi 19 (1999) 546.
[20] I.V. Aleksandrov, V.I. Ivanov, L.A. Sin’kova, Zapiski Vserossiiskogo Mineralogicheskogo Obshchestva 94 (1965) 323.