Shivpoojan Kathait Int. Journal of Engineering Research and Applications
www.ijera.com
ISSN : 2248-9622, Vol. 4, Issue 1( Version 3), January 2014, pp.111-114
www.ijera.com 111 | P a g e
GENSET Diesel Engine Design Optimization for CPCB- II
Emission Norms Using Cost Effective Techniques
Shivpoojan Kathait
ABSTRACT
The major challenge that is faced by most of the engine manufacturers nowadays is to meet the stringent emission norms with least modification in the engine design. In achieving the emission norms simplicity of the design has to be maintained as far as possible by optimizing the available emission control techniques. This paper deals with such optimal technique with reduced cost and up gradation of the engine from CPCB I (Current Emission Norms for Genset/Stationery Engines in India) to CPCB II (Future Emission Norms applicable w.e.f
Jan’14 for Genset/Stationery Engines in India) in minimum time with minimum design changes. This difficult task is achieved by adopting direct continuous EGR and intercooler with appropriate injection timing and optimizing the fuel injection pump in a cost effective manner. The experiment is carried out on 3.62 litre turbocharged engine giving power output 52.5 kW @1500 rpm. In order to achieve the NOx emission norms LLR FIP is used, to retard the injection timing at part loads to reduce the in-cylinder temperature. Direct continuous EGR (Exhaust Gas Re-circulation) is used to further reduce the NOx Emission and Intercooler is used to reduce the BSFC.
I.
INTRODUCTION
The direct injection diesel engine is one of those efficient thermal engines known to man. The use of diesel engines for road applications has been widely extended during the last decade due to their relatively lower fuel consumption when compared to spark ignition engines. For this reason DI diesel engines are widely used for heavy-duty applications and especially for the propulsion of Generators & Tractor. Even though the efficiency of these engines is currently at a high level there still exist possibilities for further improvement. On the other hand there are problems associated with its use that result from the relatively high values of particulate emissions and
NOx values. Furthermore it is found that NOx also contributes to the green house effect. Environmental concerns have led to progressively more stringent emission regulation for diesel engine. Keeping this in view, the government of India keeps regulations on the exhaust emission level of engines from time to time. Currently applicable emission norms for GENSET in India are Central Pollution Control Board (CPCB)- 1 and proposed CPCB - 2 emission norms will be applicable from 2014, for Generator up to 19kw and >19kw to 75kw. The current and future emission norms applicable for GENSET Engines are shown in Table-1.
Table-1
The purpose of the present work is to present a theoretical and experimental investigation aiming towards a possible solution to this problem in cost effective way so that the minimum design modification is required in the existing engine and to reduce the lead time. Tests were conducted under various operating conditions like Full / part throttle performance test, 5 mode cycle Emission test (as per
ISO 8178 Type D2). The Central Pollution Control Board (CPCB)-2 configuration results reveal that the reduction in exhaust emission (NOx+HC, CO and PM) levels was achieved without sacrificing in brake specific fuel consumption at full load.
POWER RANGE
HC+ NOX
CO PM SMOKE
g/kWh m-1
Up to 19 kW 7.5 3.5 0.3 0.7
>19 kW Up to 75 kW
4.7 3.5 0.3 0.7
>75 kW Up to 800 kW
4.0 3.5 0.2 0.7
Shivpoojan Kathait Int. Journal of Engineering Research and Applications
www.ijera.com
ISSN : 2248-9622, Vol. 4, Issue 1( Version 3), January 2014, pp.111-114
www.ijera.com 112 | P a g e
II.
STRATEGY to MEET CPCB II
EMISSION LIMIT
BASE ENGINE: For optimization, turbocharged engine for genset application was considered. The engine specification is mentioned in the Table 2. The base engine was already optimized
for CPCB-I and is to be upgraded to CPCB-II norms. The challenges occurred
i) Improvement in NOx + HC ii) Similar fuel consumption
iii) Minimal modification and cost impact. DEVELOPMENT WORK:
Engine Specification: Table-2
Configuration Base Engine Upgraded Engine
Power 52.5KW 52.5KW
Type of Aspiration Turbocharged without EGR Turbo Intercooled and With EGR
No. of Cylinder 4 4
Swept Volume 3.62 Ltr 3.62 Ltr
Bore/Stroke 100/115 100/115
To get minimum cost effect and less lead time EGR, Intercooler and FIP are carefully selected and optimization of Injection timing, EGR rate, EGR pipe diameter has done to meet stringent emission norms.
III.
FUEL INJECTION EQUIPMENT
The fuel injection equipment must be able to achieve precise control of fuel metering, fuel injection equipment used is of LLR characteristic which retard the injection timing at light loads. In this fuel injection equipment stepped sector are machined on the top of the plunger to vary the prestroke, this variation of prestroke changes the injection timing against load and the desired extent of retard can be obtained by carefully designing the dimension of machined sector and with this normal delivery remain unchanged irrespective of the load. By means of this LLR feature, the process of combustion can be retarded at intermediate load also. GENSET operates mainly at full load or at intermediate load. This LLR feature decrease the Nox level by reducing the in cylinder temperature. Nox can also be decreased by changing other parameter like after treatment devices but these devices increases the cost and lead time of the system.
IV.
DIRECT CONTINOUS EGR
EGR reduces the Nox emission by four ways :
A) Dilution Effect: The dilution of the intake charge with EGR reduces the mass fraction with oxygen. This reduction in oxygen mass fraction is the dilution effect. Adding EGR to the intake air flow also affects average properties of the intake charge such as the specific heat capacity and molecular mass introducing other effects. B) Thermal Effect: -EGR contains water and CO2,
both of which have higher specific heat capacities than fresh air. The effect of increased heat capacity is the thermal effect. The nitrogen in the air is replaced with inert gas
helium to study the effect in isolation. Intake air dilution with EGR simultaneously introduces the dilution and thermal effect. The oxygen mass fraction in the intake air needs to be held constant to avoid interference from dilution effect.
C) Chemical Effect: - Some of the diluents gases may dissociate or actively participate in chemical reactions during the combustion process, this is the chemical effect. One way to isolate the chemical effects is to replace nitrogen in the air with argon while the diluents is present this maintains a constant average charge heat capacity and oxygen concentration in the intake charge relative to the undiluted. This avoids interference from the thermal and dilution effect. However it is not used in this project.
D) Add mass effect: - If adding diluents to the intake charge results in an increased mass flow rate, an additional effect is introduced. This added flow has an additional heat capacity due to its mass.
The EGR used is 12 mm diameter EGR tube in which the exhaust gases flows from the exhaust to intake due to pressure difference between Exhaust and Inlet. This EGR has a drawback that at full load EGR is not required but due to pressure difference the exhaust gases flows to the inlet and reduces the power at full load.
V.
INTERCOOLER
Shivpoojan Kathait Int. Journal of Engineering Research and Applications
www.ijera.com
ISSN : 2248-9622, Vol. 4, Issue 1( Version 3), January 2014, pp.111-114
www.ijera.com 113 | P a g e is at about a temperature of 1400c because of this
high temperature volumetric efficiency is decreased drastically but with the use of intercooler the
temperature puts down to 60 0c which increase the volumetric efficiency which intern increases the air density and fuel consumption decreases.
VI.
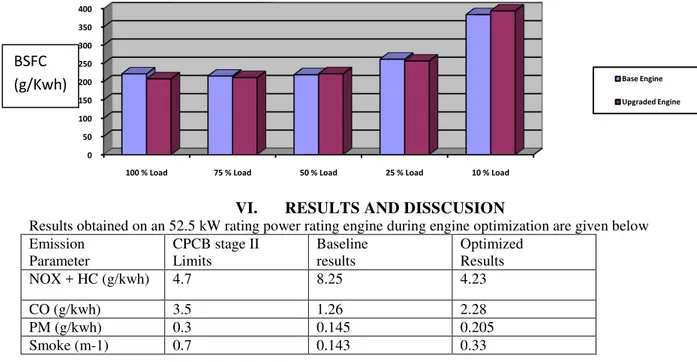
RESULTS AND DISSCUSION
Results obtained on an 52.5 kW rating power rating engine during engine optimization are given below Emission
Parameter
CPCB stage II Limits
Baseline results
Optimized Results NOX + HC (g/kwh) 4.7 8.25 4.23
CO (g/kwh) 3.5 1.26 2.28
PM (g/kwh) 0.3 0.145 0.205
Smoke (m-1) 0.7 0.143 0.33
From the figure it can be seen clearly that NOX + HC limits are far below the CPCB Stage II Emission norms. Emission limits for NOX + HC are decreased by 48.73 % as compared to baseline limits. The reason to decrease of NOX is due to combined effect of LLR feature pump and EGR, LLR feature retards the injection timing which results in reduced in cylinder temperature and EGR decreases availability of oxygen in the cylinder.
Fig. Emission Limits for NOx + HC.
From the figure it can be concluded that the CO Emission are well within the limits of CPCB II Emission norms but as compared to baseline results CO Emission is increased due to the use EGR which
decreases the availability of oxygen as a result of this fuel is not oxidized properly.
Fig. Emission Limit for CO
From the figure it can be concluded that the PM and Smoke emission are well in the emission limits of CPCB II Emission norms but as compared to baseline results Smoke and PM emission are increased due to the EGR which decreases the oxygen availability into the cylinder as a result of this fuel is not completely burned and ends into smoke and PM emission due to retarded injection timing some of the Particulate matter is oxidized during exhaust stroke but the amount of oxidation of fuel is very less.
0 50 100 150 200 250 300 350 400
100 % Load 75 % Load 50 % Load 25 % Load 10 % Load
Base Engine Upgraded Engine
0 1 2 3 4 5 6 7 8 9
NOX +HC (g/kwh)
CPCB II Limits
Baseline Results
Optimized Results
0 0.5 1 1.5 2 2.5 3 3.5
CO (g/kwh)
CPCB II Limits
Baseline Results
Optimized Results
BSFC
Shivpoojan Kathait Int. Journal of Engineering Research and Applications
www.ijera.com
ISSN : 2248-9622, Vol. 4, Issue 1( Version 3), January 2014, pp.111-114
www.ijera.com 114 | P a g e
Fig. PM Emission Limits Fig. Smoke Emission Limits
References
[1]
Ganeshan.V “I. C. Engine ,” Mc Graw Hill Book Co. NY[2] Pulrabek williams. “Fundamental of I.C
Engine,” Mc Graw Hill Book Co. NY
[3] Pundir B.P “I. C. Engine Emission and
their control,” NPTEL Education.
[4] Heywood J. B. “I. C. Engine
Fundamentals,” Mc Graw Hill Book Co.
NY
[5] MuraliManmohan,Kiran M Karanjikar, Vikas V Patil and Ravindra M Koli,
“Development of Common Rail Engine for LCV BSIII and a Step Towards BS IV
Emission Compliance”, SAE Paper No.
2011-26-0032, 2011 doi:10.4271/2011-26-0032.
[6] K Nandkumar, R kirankumar, DaithankarParag and R
Velusamy,“Innovative Method of
Calibration to Meet BS4 Emission with Optimized Fuel Economy and Noise in MPV with 2.5Lit Common Rail Diesel
Engine”,SAE Paper No. 2011-26-0028, 2011, doi:10.4271/2011-26- 0028
[7] http://www.dieselnet.com/tech/engine_egr .html.
[8] P. A. Laxminarayanan, “A Cost –Efficient EGR Technology for off-road diesel engines with mechanical fuel injection equipment to satisfy advanced emission
standard”, Ashok Leyland, SAE Paper No:
2010-01- 1958, 2010 doi:10.4271/2010-01-1958.
[9] K. S. Kalsi and N. Collings, “Study of Steady State and Transient EGR Behavior
of a Medium Duty Diesel Engine”,
University of Cambridge, M. Heaton and S. A.Faulkner Caterpillar UK, SAE Paper No: 2008-01-2438, 2008, doi:10.4271/2008-01-2438.
0 0.05 0.1 0.15 0.2 0.25 0.3
PM(g/kWh)
CPCB II Limits
Baseline Results
Optimized Results
0 0.1 0.2 0.3 0.4 0.5 0.6 0.7
Smoke (m-1)
CPCB II Limits
Baseline Results