Effectiveness of a Worksite Social &
Physical Environment Intervention on
Need for Recovery, Physical Activity and
Relaxation; Results of a Randomized
Controlled Trial
Jennifer K. Coffeng1,2*, Ce´cile R. L. Boot1,2, Saskia F. A. Duijts1, Jos W. R. Twisk3,4, Willem van Mechelen1,2, Ingrid J. M. Hendriksen2,5
1.Department of Public and Occupational Health, EMGO+Institute for Health and Care Research, VU University Medical Center, Amsterdam, The Netherlands,2.Body@Work TNO- VU University Medical Center, Research Center Physical Activity, Work and Health, Amsterdam, The Netherlands,3.Department of Epidemiology and Biostatistics, VU University Medical Center, Amsterdam, The Netherlands,4.Department of Health Sciences, VU University, Amsterdam, The Netherlands,5.TNO (Expert Center Life Style), Leiden, The Netherlands
Abstract
Objective:To investigate the effectiveness of a worksite social and physical environment intervention on need for recovery (i.e., early symptoms of work-related mental and physical fatigue), physical activity and relaxation. Also, the
effectiveness of the separate interventions was investigated.
Methods:In this 262 factorial design study, 412 office employees from a financial service provider participated. Participants were allocated to the combined social and physical intervention, to the social intervention only, to the physical intervention only or to the control group. The primary outcome measure was need for recovery. Secondary outcomes were work-related stress (i.e., exhaustion, detachment and relaxation), small breaks, physical activity (i.e., stair climbing, active commuting, sport activities, light/moderate/vigorous physical activity) and sedentary behavior. Outcomes were measured by questionnaires at baseline, 6 and 12 months follow-up. Multilevel analyses were performed to investigate the effects of the three interventions.
Results: In all intervention groups, a non-significant reduction was found in need for recovery. In the combined intervention (n592), exhaustion and vigorous physical activities decreased significantly, and small breaks at work and active commuting increased significantly compared to the control group. The social intervention (n5118) showed a significant reduction in exhaustion, sedentary
OPEN ACCESS
Citation:Coffeng JK, Boot CRL, Duijts SFA, Twisk JWR, van Mechelen W, et al. (2014) Effectiveness of a Worksite Social & Physical Environment Intervention on Need for Recovery, Physical Activity and Relaxation; Results of a Randomized Controlled Trial. PLoS ONE 9(12): e114860. doi:10. 1371/journal.pone.0114860
Editor:Ruth Jepson, Scottish Collaboration for Public Health Research and Policy (SCPHRP), United Kingdom
Received:April 30, 2014
Accepted:October 22, 2014
Published:December 26, 2014
Copyright:ß2014 Coffeng et al. This is an
open-access article distributed under the terms of the
Creative Commons Attribution License, which permits unrestricted use, distribution, and repro-duction in any medium, provided the original author and source are credited.
Data Availability:The authors confirm that all data underlying the findings are fully available without restriction. The data used in this study is part of the Vitality in Practice (VIP) project and is owned by the VU University Medical Center. Requests for the data can be sent to Dr. Ce´cile Boot ( [email protected]).
Funding:The project was funded by Ohra Nuts fonds. The funders had no role in study design, data collection and analysis, decision to publish or preparation of the manuscript.
behavior at work and a significant increase in small breaks at work and leisure activities. In the physical intervention (n596), stair climbing at work and active commuting significantly increased, and sedentary behavior at work decreased significantly compared to the control group.
Conclusion:None of the interventions was effective in improving the need for recovery. It is recommended to implement the social and physical intervention among a population with higher baseline values of need for recovery. Furthermore, the intervention itself could be improved by increasing the intensity of the
intervention (for example weekly GMI-sessions), providing physical activity opportunities and exercise schemes, and by more drastic environment interventions (restructuring entire department floor).
Trial Registration: Nederlands Trial RegisterNTR2553
Background
Over 22% of European Union employees suffer from stress at work on a daily basis and the annual economic costs of work-related stress in Europe was estimated at 20 billion Euro [1]. The degree to which employees are able to recover from fatigues and stress at work effects their physical and mental health [2].
Results of the Netherlands working condition survey [3], based on a
representative sample of the Dutch workforce, revealed that there has been a slight increase in the need for recovery over the years. Recovery after work is a natural consequence of expended effort. However, it becomes problematic when there is not enough recovery offered between two periods of work effort. The effort recovery model developed by Meijman & Mulder (1998) describes the role of recovery [4]. This model depicts job demands and the associated effort
predicts future sickness absence lasting fourteen or more working days, which may result in a financial burden for companies due to increased absenteeism [11].
In an effort to reduce the need for recovery, evidence has been found that physical activity is valuable in unwinding from work [12–15]. In particular, engaging in physical activity results in lower work stress [16]. When more time is spent on physical activity after work, the feeling of being recovered is heightened [12]. Relaxation is another strategy that seems to be important for recovery. It has been shown that relaxation activities are related to increasing one’s feeling of recovery [13,17–20]. A way to achieve relaxation is to disengage from work, which reverses the negative consequences of straining job demands and returns the employee to pre-stressor levels. It was shown that low levels of relaxation are associated with weaker health, emotional exhaustion, a high need for recovery and sleeping problems [17]. In view of this, it is important that interventions will be developed that involve physical activity and relaxation to improve the need for recovery among office employees.
To date, few studies investigated the effectiveness of a WHP program on improving the need for recovery. A study on the effectiveness of a worksite vitality program, consisting of visits of a personal vitality coach and weekly yoga sessions, showed that the intervention group lowered their need for recovery compared to the control group [21] at 6 months follow-up, but this was not sustained in the long-term.
Previous research has shown that, besides changing individual health behavior, both the social and physical environment are important in improving health and well-being [22–28], so WHP programs should adopt a socio-ecological model when developing and evaluating interventions. Socio-ecological models focus on making changes to the individual (intrapersonal), social (interpersonal), physical and/or organizational environment. A combined intervention is likely to
demonstrate effects over extended periods of time [29]. In the current study, a socio-ecological framed WHP program focussing on a combined social and physical environment intervention was applied, aiming at physical activity and relaxation to improve the need for recovery in office employees. Based on elements of the Intervention Mapping protocol, the intervention program was developed in close cooperation with the employees of a financial service provider with mainly desk jobs. Resulting from a needs assessment (i.e., questionnaire on physical activity, relaxation and need for recovery, individual interviews and focus group interviews with the target population), key determinants of physical activity and relaxation were chosen and, methods and strategies were selected to affect these determinants. This resulted in a social environment intervention consisting of Group Motivational Interviewing (GMI), conducted by teamleaders, and a physical environment intervention consisting of environment modifications (e.g., table tennis and sitting balls).
on need for recovery (i.e., early symptoms of work-related mental and physical fatigue), work-related stress (i.e., exhaustion, detachment and relaxation), small breaks at work, physical activity (i.e., stair climbing, active commuting, leisure activities, sport activities, light/moderate/vigorous physical activity) and sedentary behavior at work. It was hypothesized that the combined intervention would be more effective than the separate interventions compared to the control group.
Methods
Study population and study design
The protocol for this trial and supporting CONSORT checklist are available asS1 ChecklistandS1 Protocol. Data were used from the Be Active & Relax ‘‘Vitality in Practice’’ (VIP) project (30) conducted at a financial service provider. In
September 2011, 1.182 office employees of a financial service provider received an invitation for the Be Active & Relax ‘‘Vitality in Practice’’ (VIP) project. A total of 412 office employees (35% response rate) from 19 departments provided the informed consent, completed the baseline questionnaire and were included in the Be Active & Relax project. All respondents met the inclusion criterion of not being on sick leave for more than four weeks. The participants received follow-up questionnaires at 6 months and 12 months.
The effectiveness of the interventions was investigated in a trial using a 262
factorial design. The two factors were the social environment intervention and the physical environment intervention, of which the social environment intervention was randomized at department level and the physical environment intervention was stratified on department level, i.e., one stratum with environment
modifications and the other stratum without environment modifications. This resulted in four research groups: (1) combined social and physical environment intervention group; (2) social environment intervention group only; (3) physical environment intervention group only; (4) no intervention (control group). Blinding of the participants and intervention providers for the social environment intervention was impossible, although none of them had received information about our design involving three intervention groups. This study was approved by the Medical Ethics Committee of the VU University Medical Center, Amsterdam, the Netherlands. More details on the study design, methods including all outcome measures and interventions of the Be Active & Relax project have been published elsewhere [30].
Social and physical environment interventions
Social environment intervention
The social environment intervention consisted of Group Motivational
individual MI to group MI, defined as Group Motivational Interviewing (GMI) [32–37]. A group setting has several benefits, e.g., sharing experiences, providing feedback and giving support. GMI helps to create an autonomous supportive environment, in which engaging in daily physical activity and relaxation can be encouraged. This feeling of social support is important to improve one’s need for recovery. Previous study by Sluiter 2001 showed that participants with less favorable social relationships at work reported more need for recovery [38].
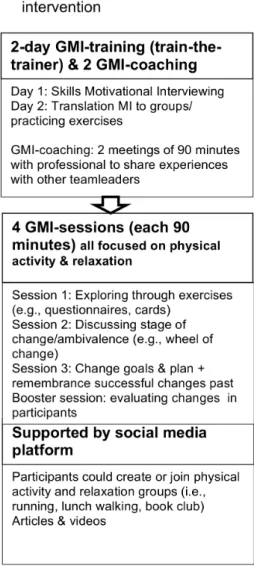
GMI was delivered by the teamleaders after receiving a two-day training, which was given by a professional. The trained teamleaders conducted four GMI-sessions of 90 minutes each with employees from their own team, within a period of 3.5 months (i.e., the first 3 sessions were conducted once every three weeks, the last session was after 2 months). The main aim of the sessions was to stimulate physical activity and relaxation, for example during GMI-session two, employees were asked to fill in a worksheet stating their goals and subsequent rewards for improving physical activity and relaxation. The GMI-sessions were supported by a web-based social media platform.
Physical environment intervention
Vitality in Practice (VIP) zones were created: (1) the VIP Coffee Corner Zone – the coffee corner was modified by adding a bar with bar chairs, a large plant and a giant wall poster (a poster visualizing a relaxing environment, e.g., wood, water and mountains); (2) the VIP Open Office Zone – the office was modified by introducing exercise balls and curtains to divide desks in order to reduce background noise; (3) the VIP Meeting Zone – conference rooms were modified by placing a standing table (a table that allows you to stand while working) and a giant wall poster (as before); and (4) the VIP Hall Zone - table tennis tables were placed and lounge chairs were introduced in the hall for informal meetings. In addition, footsteps were placed on the floor in the entrance hall to promote stair walking. The physical environment intervention was left in place for the whole 12 months.
Fig. 1 depicts in more detail the social and physical interventions.
Outcome measures
Sample size
The sample size was calculated based on the number of cases needed to indentify an effect on need for recovery, measured by the Need for Recovery after Work scale of the Dutch VBBA questionnaire [39]. Previous studies of de Croon et al., [40] and Kuijer et al., [41] showed an effect size of 12 (i.e., within a range from 0– 100). Average norm score for need for recovery is 38.1 (the anticipated variability; SD529.9) on a scale from 0–100 [2]. This anticipated variability indicates that the data are spread out over a quite large range of values. Because of randomisation at department level, a certain loss of efficiency relative to individual randomisation must be considered. For this an intraclass correlation coefficient (ICC) of 0.025 Fig. 1. Details intervention.*(A) & (B)5combined intervention.
was assumed, based on previous studies showing that worksite level ICC’s for health-related outcomes are generally small [42–44]. The effect size of 12 can be detected by four groups of 101 participants, taking into account a loss to follow-up of 25%, a power of 80% and a two-tailed significance level of 5%.
Work-related stress
Exhaustionwas measured by the OLdenburg Burnout Inventory (OLBI) consisting of eight items (e.g., ‘‘I can usually handle the amount of work well’’) on a 4-point scale ranging from ‘‘totally agree’’ to ‘‘don’t agree’’ [45]. The OLBI has shown good internal consistency (a50.85) and reasonable validity in different
occupational groups (i.e., health care workers experienced higher levels of exhaustion than white collar workers) [46].
Detachment and relaxation after work were assessed with the Recovery Experience Questionnaire, which was developed by Sonnentag et al. [17]. The validation study of the Recovery Experience Questionnaire [17] resulted in four items measuring detachment (e.g., ‘‘I don’t think about work at all’’) and four items measuring relaxation (e.g., ‘‘I use the time to relax’’). In the present study, we were also interested in measuring detachment and relaxation during work. For this purpose, the scale was adapted to a within workday context, starting each item with ‘‘During a break at work…’’, instead of ‘‘During time after work…’’ as written in the original questionnaire of Sonnentag et al. [17]. Each item was assessed on a 7-point scale, ranging from ‘‘never’’ to ‘‘always’’. The internal consistency and construct validity of these subscales were investigated in a validation study, which was performed alongside the present trial [47]. Internal consistency of the ‘at work’ and ‘after work’ detachment and relaxation scales were considered to be good (Cronbach’s alpha ranged from 0.87–0.94). Construct validity was assessed by analysing the associations with need for recovery, exhaustion and work engagement, and was considered to be moderate.
Small breaks at work were measured with a newly developed question. Participants were asked how often they engaged in small breaks during a usual workday, using the following question: ‘‘Besides your lunch break, how many small breaks (minimum 5 minutes) do you have during an usual workday?’’.
Physical activity
Stair climbing at work was also assessed by a newly developed question. Participants were asked how many times they took the stairs during an usual workday, using the question: ‘‘How often do you take the stairs at work during an usual workday?’’
in the past months in physical activity domains; active commuting (walking and cycling to and from work), physical activity at work, and leisure activities (walking, cycling, gardening, chores and sports). For each domain, employees were asked to report the frequency (times per week), duration of activities (in minutes), and self-reported intensity (light, moderate or vigorous). The leisure domain included information on sports, of which employees could report upon a maximum of four. Physical activity was expressed in minutes per week and total activity scores were calculated by multiplying the minutes per week by the actual MET score (metabolic equivalent, which is the ratio of work metabolic rate to a standard resting metabolic rate of 1.0) of the specific activity (MET/min/week). Information was obtained on light (range ,4 MET), moderate (range 4–6.5 MET), and vigorous (.6.5 MET) intensity activities [50].
Sedentary behavior at workrefers to those activities at work that require a very low energy expenditure (#1.5 MET) while sitting or reclining [51]. To assess sedentary time at work, participants were asked to estimate the total amount of minutes spend at work on computer use, meetings and other sedentary activities (i.e., making phone calls, reading) during an usual working day. This
questionnaire has not been tested for validity yet.
Potential confounders
Age, gender, marital status (relationship or single), level of education (low, middle, high education), ethnicity (native or non-native Dutch), and work hours per week were investigated as covariates and potential confounders. Additionally, job demands and supervisor support were assessed on a 4-point scale from ‘‘totally agree’’ to ‘‘don’t agree’’ and were derived from the validated Dutch version of the Job Content Questionnaire (JCQ) [52]. General health was measured by one item: ‘‘In general, how would you rate your health?’’ on a 5-point scale, (15poor to 55excellent) from the Dutch validated version of the Rand-36 [53]. The total scale has shown reasonable validity and satisfactory reliability (a50.83).
Statistical analysis
Multilevel regression analyses
In the linear mixed models, we compared the four intervention conditions with each other by adding three dummy variables to the model. The control condition was used as the reference group, so that the regression coefficients for the three dummy variables represent the differences between the combined intervention and the control group, between the social intervention and the control group and between the physical intervention and the control group. As such, the regression coefficient of the combined intervention reflects the interaction between the social and the physical intervention directly. For all outcome variables, the following analyses were performed: a crude analysis in which an adjustment was made only for the baseline value of the particular outcome and an adjusted analysis in which an additional adjustment was made for age, gender, education, marital status, general health, job demands and supervisor support. The potential confounders were chosen based on the literature and the expected association with the outcome. In the first set of analyses, overall intervention effects were estimated, while in the second set of analyses, the effects of the interventions at the different time-points were estimated. This was done by adding time (a dichotomous variable differentiating between 6 and 12 months) and the interaction between time and the three dummy variables (representing the three intervention
conditions) to the models. Data were analyzed according to the intention-to-treat principle; all participants were analyzed according to the condition, despite the fact whether, and to what extent, they were compliant to the particular
intervention and the follow-up measurements. P-values of,0.05 were considered to be significant. The measure of the intervention effect was expressed by betas (B) with 95% confidence intervals.
Results
Participants
Fig. 2 presents the flow diagram of the study in which 19 departments of the
financial service provider participated. Enrolment of the 412 participants took place between September and December 2011. The randomisation procedure allocated 92 employees (from three departments) to the combined intervention, 118 employees (from seven departments) to the social intervention, 96 employees (from three departments) to the physical intervention and 106 employees (from six departments) to the control group. Since randomisation was at department level, the groups were not equal in size. Complete follow-up data was obtained for the primary outcome measure (need for recovery), from 329 participants (80%). For 25 participants, of whom the functions were highly variable, the reasons for loss-to-follow up were unknown. The largest known reason for loss-to-follow up was changing to a different employer (n524).
Fig. 2. Flow diagram enrolment of participants.*All percentages are count within each group based on the baseline number of employees in that group.
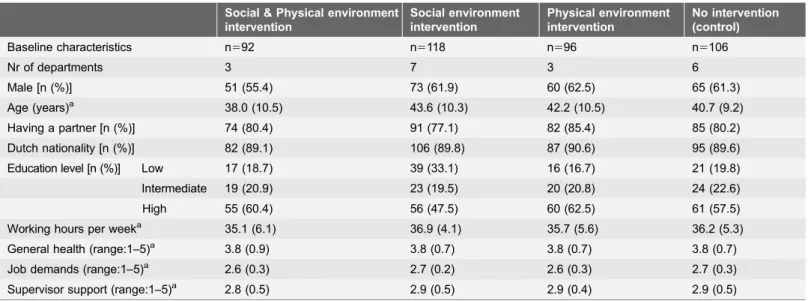
group. However, among the participants, males were slightly overrepresented (60%) and the majority was highly educated (57%). The top 3 functions were; insurance acceptants (13.3%), team leaders (11.4%) and administrative employees (9.4%). Further, 75% of the participants stated to have high job demands and 75.7% reported to have social support at work.
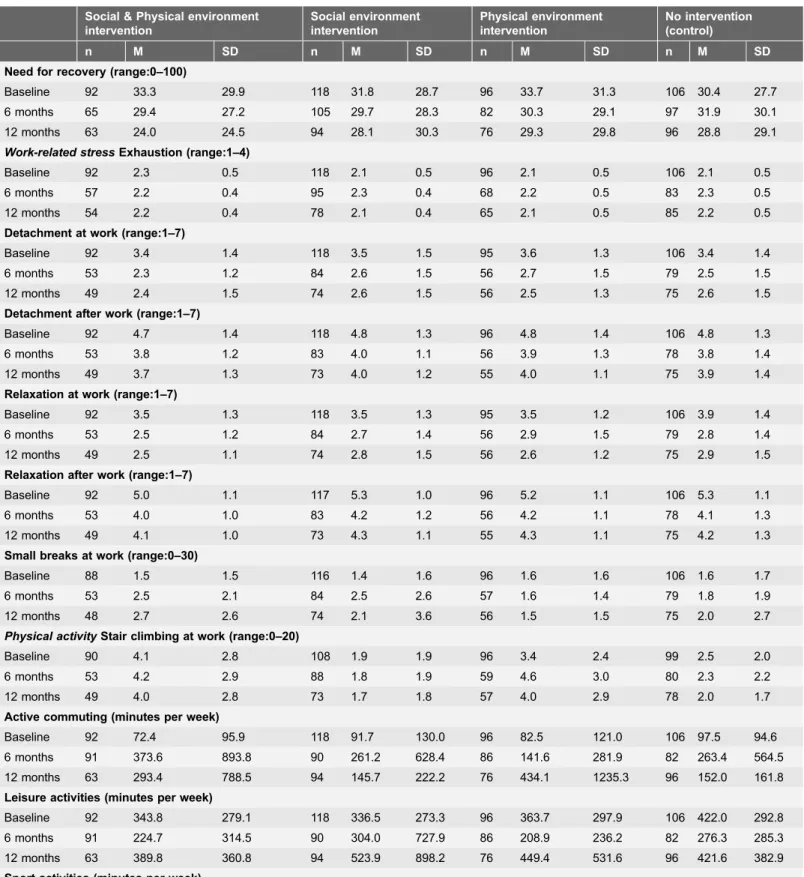
The means of need for recovery, exhaustion, detachment, relaxation, small breaks, stair climbing, physical activity and sedentary behavior for work at baseline and follow-up measurements are presented in Table 2.
Intervention effects on need for recovery
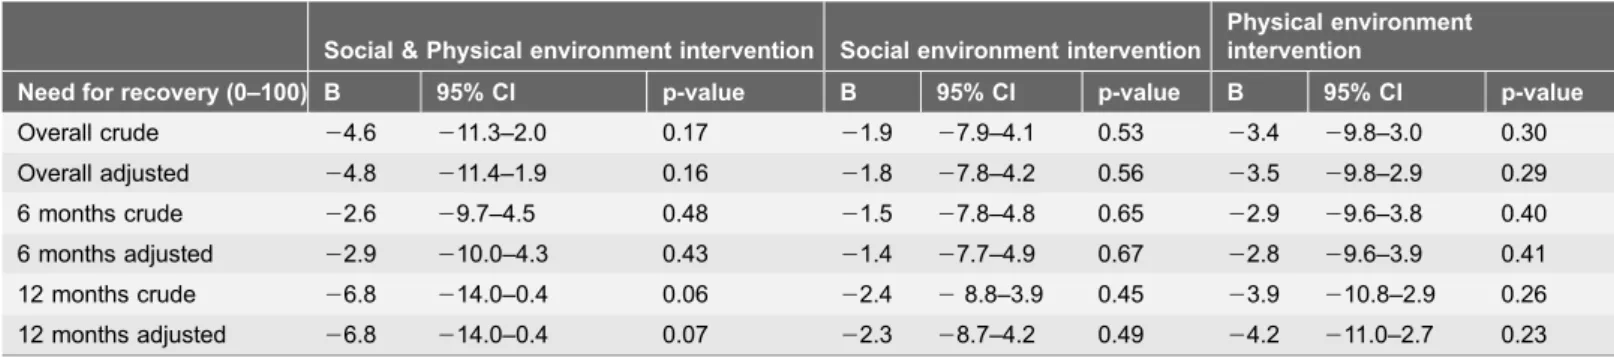
The results on the primary outcome measure of the study, need for recovery, are presented in Table 3. All the interventions showed a reduction in need for recovery (b: range22.4 to26.8 at 12 months on a scale of 0–100). The largest reduction was found in the combined intervention at 12 months (b:26.8, 95%CI:
214.0;20.4). However, neither the overall intervention effects nor the effects at any time point were significant for need for recovery.
For the other outcomes, the overall effects of the interventions are shown in Table 4. When found significant at the separate time points (i.e., 6 and 12 months), these effects are presented in Table 5.
Work-related stress outcomes
The interventions did neither result in any significant effects for detachment, nor for relaxation at work and after work. The combined intervention was associated Table 1.Baseline characteristics of the study population.
Social & Physical environment intervention
Social environment intervention
Physical environment intervention
No intervention (control)
Baseline characteristics n592 n5118 n596 n5106
Nr of departments 3 7 3 6
Male [n (%)] 51 (55.4) 73 (61.9) 60 (62.5) 65 (61.3)
Age (years)a 38.0 (10.5) 43.6 (10.3) 42.2 (10.5) 40.7 (9.2)
Having a partner [n (%)] 74 (80.4) 91 (77.1) 82 (85.4) 85 (80.2)
Dutch nationality [n (%)] 82 (89.1) 106 (89.8) 87 (90.6) 95 (89.6)
Education level [n (%)] Low 17 (18.7) 39 (33.1) 16 (16.7) 21 (19.8)
Intermediate 19 (20.9) 23 (19.5) 20 (20.8) 24 (22.6)
High 55 (60.4) 56 (47.5) 60 (62.5) 61 (57.5)
Working hours per weeka 35.1 (6.1) 36.9 (4.1) 35.7 (5.6) 36.2 (5.3) General health (range:1–5)a 3.8 (0.9) 3.8 (0.7) 3.8 (0.7) 3.8 (0.7)
Job demands (range:1–5)a 2.6 (0.3) 2.7 (0.2) 2.6 (0.3) 2.7 (0.3)
Supervisor support (range:1–5)a 2.8 (0.5) 2.9 (0.5) 2.9 (0.4) 2.9 (0.5)
a
Mean (Standard Deviation); n5number of employees.
Table 2.Means and standard deviations of all outcome measures for the intervention groups versus the control group at baseline, 6 months and 12 months.
Social & Physical environment intervention
Social environment intervention
Physical environment intervention
No intervention (control)
n M SD n M SD n M SD n M SD
Need for recovery (range:0–100)
Baseline 92 33.3 29.9 118 31.8 28.7 96 33.7 31.3 106 30.4 27.7
6 months 65 29.4 27.2 105 29.7 28.3 82 30.3 29.1 97 31.9 30.1
12 months 63 24.0 24.5 94 28.1 30.3 76 29.3 29.8 96 28.8 29.1
Work-related stressExhaustion (range:1–4)
Baseline 92 2.3 0.5 118 2.1 0.5 96 2.1 0.5 106 2.1 0.5
6 months 57 2.2 0.4 95 2.3 0.4 68 2.2 0.5 83 2.3 0.5
12 months 54 2.2 0.4 78 2.1 0.4 65 2.1 0.5 85 2.2 0.5
Detachment at work (range:1–7)
Baseline 92 3.4 1.4 118 3.5 1.5 95 3.6 1.3 106 3.4 1.4
6 months 53 2.3 1.2 84 2.6 1.5 56 2.7 1.5 79 2.5 1.5
12 months 49 2.4 1.5 74 2.6 1.5 56 2.5 1.3 75 2.6 1.5
Detachment after work (range:1–7)
Baseline 92 4.7 1.4 118 4.8 1.3 96 4.8 1.4 106 4.8 1.3
6 months 53 3.8 1.2 83 4.0 1.1 56 3.9 1.3 78 3.8 1.4
12 months 49 3.7 1.3 73 4.0 1.2 55 4.0 1.1 75 3.9 1.4
Relaxation at work (range:1–7)
Baseline 92 3.5 1.3 118 3.5 1.3 95 3.5 1.2 106 3.9 1.4
6 months 53 2.5 1.2 84 2.7 1.4 56 2.9 1.5 79 2.8 1.4
12 months 49 2.5 1.1 74 2.8 1.5 56 2.6 1.2 75 2.9 1.5
Relaxation after work (range:1–7)
Baseline 92 5.0 1.1 117 5.3 1.0 96 5.2 1.1 106 5.3 1.1
6 months 53 4.0 1.0 83 4.2 1.2 56 4.2 1.1 78 4.1 1.3
12 months 49 4.1 1.0 73 4.3 1.1 55 4.3 1.1 75 4.2 1.3
Small breaks at work (range:0–30)
Baseline 88 1.5 1.5 116 1.4 1.6 96 1.6 1.6 106 1.6 1.7
6 months 53 2.5 2.1 84 2.5 2.6 57 1.6 1.4 79 1.8 1.9
12 months 48 2.7 2.6 74 2.1 3.6 56 1.5 1.5 75 2.0 2.7
Physical activityStair climbing at work (range:0–20)
Baseline 90 4.1 2.8 108 1.9 1.9 96 3.4 2.4 99 2.5 2.0
6 months 53 4.2 2.9 88 1.8 1.9 59 4.6 3.0 80 2.3 2.2
12 months 49 4.0 2.8 73 1.7 1.8 57 4.0 2.9 78 2.0 1.7
Active commuting (minutes per week)
Baseline 92 72.4 95.9 118 91.7 130.0 96 82.5 121.0 106 97.5 94.6
6 months 91 373.6 893.8 90 261.2 628.4 86 141.6 281.9 82 263.4 564.5
12 months 63 293.4 788.5 94 145.7 222.2 76 434.1 1235.3 96 152.0 161.8
Leisure activities (minutes per week)
Baseline 92 343.8 279.1 118 336.5 273.3 96 363.7 297.9 106 422.0 292.8
6 months 91 224.7 314.5 90 304.0 727.9 86 208.9 236.2 82 276.3 285.3
12 months 63 389.8 360.8 94 523.9 898.2 76 449.4 531.6 96 421.6 382.9
Table 2.Cont.
Social & Physical environment intervention
Social environment intervention
Physical environment intervention
No intervention (control)
n M SD n M SD n M SD n M SD
Baseline 92 173.5 221.8 118 149.8 193.9 96 167.8 180.9 106 188.8 190.4
6 months 65 144.5 230.3 105 147.4 211.6 82 145.5 215.1 97 142.3 220.2
12 months 63 122.6 146.7 94 203.9 501.0 76 145.6 202.7 96 167.5 244.5
Light physical activity (minutes per week)
Baseline 92 1774.7 1229.0 118 1760.5 1497.4 96 1683.1 1403.4 106 2011.1 1276.8 6 months 91 1788.9 1697.4 90 1448.2 1549.6 86 1481.3 1320.3 82 1539.0 1399.2 12 months 63 1672.8 1551.7 94 1447.0 1575.2 76 1409.4 1659.7 96 1864.0 1657.6
Moderate physical activity (minutes per week)
Baseline 92 239.5 186.2 118 252.5 243.3 96 263.0 251.4 106 368.2 298.8
6 months 91 263.7 502.0 90 327.5 536.6 86 180.8 208.8 82 240.7 269.4
12 months 63 371.2 687.3 94 357.6 740.9 76 349.8 697.3 96 332.0 397.0
Vigorous physical activity (minutes per week)
Baseline 92 84.9 205.5 118 87.5 172.6 96 75.2 124.3 106 85.5 128.5
6 months 91 7.3 42.4 90 28.7 97.5 86 48.1 285.8 82 52.3 189.4
12 months 63 75.1 122.5 94 121.6 432.0 76 100.3 174.9 96 94.2 198.9
Sedentary behavior at work (minutes per day)
Baseline 92 477.3 166.4 118 472.2 148.8 96 500.8 170.4 106 471.3 149.3
6 months 63 380.6 221.6 100 428.5 215.9 76 359.7 262.1 93 414.6 209.2
12 months 63 378.6 221.8 94 365.8 239.2 76 367.2 249.6 96 403.8 245.2
n5number of employees; M5Mean; SD5Standard Deviation.
doi:10.1371/journal.pone.0114860.t002
Table 3.Crude and adjusted overall effects, at 6 months and at 12 months, of need for recovery between the intervention groups and the control group.
Social & Physical environment intervention Social environment intervention
Physical environment intervention
Need for recovery (0–100) B 95% CI p-value B 95% CI p-value B 95% CI p-value
Overall crude 24.6 211.3–2.0 0.17 21.9 27.9–4.1 0.53 23.4 29.8–3.0 0.30 Overall adjusted 24.8 211.4–1.9 0.16 21.8 27.8–4.2 0.56 23.5 29.8–2.9 0.29 6 months crude 22.6 29.7–4.5 0.48 21.5 27.8–4.8 0.65 22.9 29.6–3.8 0.40 6 months adjusted 22.9 210.0–4.3 0.43 21.4 27.7–4.9 0.67 22.8 29.6–3.9 0.41 12 months crude 26.8 214.0–0.4 0.06 22.4 28.8–3.9 0.45 23.9 210.8–2.9 0.26 12 months adjusted 26.8 214.0–0.4 0.07 22.3 28.7–4.2 0.49 24.2 211.0–2.7 0.23
Adjusted for confounders age, gender, education, marital status, general health, job demands, supervisor support, and corresponding baseline measure of the outcome variable. Significant effects are in bold. A negative Be`ta (B) means a lower need for recovery in the intervention group compared to the control group. [B5Be`ta, CI5Confidence Interval, p-value is significant,0.05].
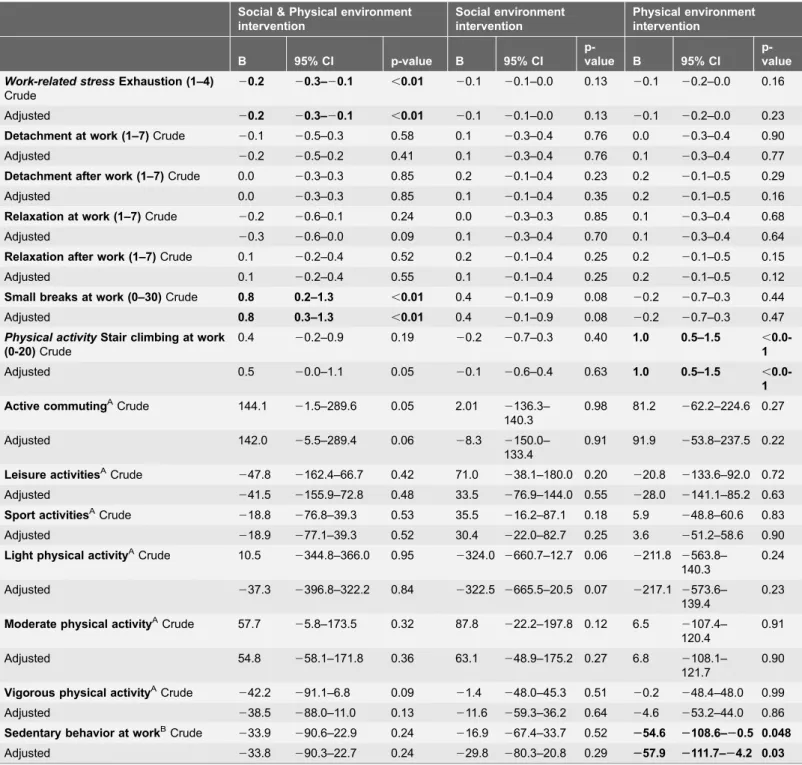
Table 4.Crude and adjusted overall effects in all secondary outcome measures between the intervention groups and the control group over a 12 months follow-up period.
Social & Physical environment intervention
Social environment intervention
Physical environment intervention
B 95% CI p-value B 95% CI
p-value B 95% CI
p-value
Work-related stressExhaustion (1–4)
Crude
20.2 20.3–20.1 ,0.01 20.1 20.1–0.0 0.13 20.1 20.2–0.0 0.16
Adjusted 20.2 20.3–20.1 ,0.01 20.1 20.1–0.0 0.13 20.1 20.2–0.0 0.23
Detachment at work (1–7)Crude 20.1 20.5–0.3 0.58 0.1 20.3–0.4 0.76 0.0 20.3–0.4 0.90
Adjusted 20.2 20.5–0.2 0.41 0.1 20.3–0.4 0.76 0.1 20.3–0.4 0.77
Detachment after work (1–7)Crude 0.0 20.3–0.3 0.85 0.2 20.1–0.4 0.23 0.2 20.1–0.5 0.29
Adjusted 0.0 20.3–0.3 0.85 0.1 20.1–0.4 0.35 0.2 20.1–0.5 0.16
Relaxation at work (1–7)Crude 20.2 20.6–0.1 0.24 0.0 20.3–0.3 0.85 0.1 20.3–0.4 0.68
Adjusted 20.3 20.6–0.0 0.09 0.1 20.3–0.4 0.70 0.1 20.3–0.4 0.64
Relaxation after work (1–7)Crude 0.1 20.2–0.4 0.52 0.2 20.1–0.4 0.25 0.2 20.1–0.5 0.15
Adjusted 0.1 20.2–0.4 0.55 0.1 20.1–0.4 0.25 0.2 20.1–0.5 0.12
Small breaks at work (0–30)Crude 0.8 0.2–1.3 ,0.01 0.4 20.1–0.9 0.08 20.2 20.7–0.3 0.44
Adjusted 0.8 0.3–1.3 ,0.01 0.4 20.1–0.9 0.08 20.2 20.7–0.3 0.47
Physical activityStair climbing at work (0-20)Crude
0.4 20.2–0.9 0.19 20.2 20.7–0.3 0.40 1.0 0.5–1.5 , 0.0-1
Adjusted 0.5 20.0–1.1 0.05 20.1 20.6–0.4 0.63 1.0 0.5–1.5 ,
0.0-1
Active commutingACrude 144.1 21.5–289.6 0.05 2.01 2136.3–
140.3
0.98 81.2 262.2–224.6 0.27
Adjusted 142.0 25.5–289.4 0.06 28.3 2150.0–
133.4
0.91 91.9 253.8–237.5 0.22
Leisure activitiesACrude
247.8 2162.4–66.7 0.42 71.0 238.1–180.0 0.20 220.8 2133.6–92.0 0.72 Adjusted 241.5 2155.9–72.8 0.48 33.5 276.9–144.0 0.55 228.0 2141.1–85.2 0.63
Sport activitiesACrude 218.8 276.8–39.3 0.53 35.5 216.2–87.1 0.18 5.9 248.8–60.6 0.83
Adjusted 218.9 277.1–39.3 0.52 30.4 222.0–82.7 0.25 3.6 251.2–58.6 0.90
Light physical activityACrude 10.5
2344.8–366.0 0.95 2324.0 2660.7–12.7 0.06 2211.8 2563.8– 140.3
0.24
Adjusted 237.3 2396.8–322.2 0.84 2322.5 2665.5–20.5 0.07 2217.1 2573.6– 139.4
0.23
Moderate physical activityACrude 57.7 25.8–173.5 0.32 87.8 222.2–197.8 0.12 6.5 2107.4–
120.4
0.91
Adjusted 54.8 258.1–171.8 0.36 63.1 248.9–175.2 0.27 6.8 2108.1– 121.7
0.90
Vigorous physical activityACrude 242.2 291.1–6.8 0.09 21.4 248.0–45.3 0.51 20.2 248.4–48.0 0.99
Adjusted 238.5 288.0–11.0 0.13 211.6 259.3–36.2 0.64 24.6 253.2–44.0 0.86
Sedentary behavior at workBCrude
233.9 290.6–22.9 0.24 216.9 267.4–33.7 0.52 254.6 2108.6–20.5 0.048
Adjusted 233.8 290.3–22.7 0.24 229.8 280.3–20.8 0.29 257.9 2111.7–24.2 0.03
Aminutes per week,Bminutes per day. Adjusted for confounders age, gender, education, marital status, general health, job demands, supervisor support, and corresponding baseline measure of the outcome variable. Significant effects are in bold;. A negative Be`ta (B) means less exhaustion, detachment and relaxation at work and after work, small breaks, stair climbing, active commuting, leisure activities, sports, light physical activity, moderate physical activity, vigorous physical activity and sedentary behavior in the intervention group compared to the control group. [B5Be`ta, CI5Confidence Interval, p-value is significant,0.05].
Table 5.Crude and adjusted effects on exhaustion, small breaks, stair climbing, active commuting, leisure activities, sport activities, vigorous physical activity, sedentary behavior at work between the intervention groups and control group found significant at 6 and/or 12 months follow-up.
Social & Physical environment
intervention Social environment intervention Physical environment intervention
B 95% CI p-value B 95% CI
p-value B 95% CI
p-value
Work-related stress
Exhaustion (1–4)
6 months crude
20.2 20.0–20.3 ,0.01 20.0 20.1–0.1 0.97 20.0 20.1–0.1 0.5
6 months adjusted 20.2 20.0–20.3 ,0.01 0.0 20.1–0.1 0.99 20.0 20.1–0.1 0.5 12 months crude 20.2 20.1–20.3 ,0.01 20.1 20.2–20.0 ,0.01 20.1 20.2–0.0 0.06 12 months adjusted 20.2 0.1–1.3 ,0.01 20.1 20.2–20.0 ,0.01 20.1 20.2–0.0 0.06
Small Breaks at work (0–30)
6 months crude
0.7 0.1–1.3 0.02 0.7 0.2–1.2 ,0.01 20.1 20.6–0.5 0.84
6 months adjusted 0.8 0.1–1.4 0.02 0.7 0.2–1.2 ,0.01 20.1 20.7–0.5 0.74 12 months crude 0.8 0.1–1.4 0.01 0.1 20.4–0.7 0.67 20.3 20.9–0.2 0.26 12 months adjusted 0.8 0.2–1.5 0.01 0.1 20.4–0.6 0.72 20.3 20.9–0.3 0.38 Physical activityStair
climbing at work (0-20)
6 months crude
0.4 20.2–1.0 0.19 20.1 20.7–0.4 0.63 1.3 0.7–1.8 ,0.01
6 months adjusted 0.6 20.0–1.2 0.07 20.0 20.6–0.5 0.94 1.3 0.7–1.8 ,0.01
12 months crude 0.3 20.3–1.0 0.32 20.3 20.9–0.2 0.25 0.7 0.1–1.3 0.02
12 months adjusted 0.5 20.1–1.1 0.13 20.2 20.8–0.3 0.41 0.8 0.2–1.3 0.01 Active commutingA6
months crude
177.2 8.2–346.1 0.04 60.0 2108.5–228.6 0.48 255.3 2227.2–116.6 0.53
6 months adjusted 175.1 4.3–346.0 ,0.05 50.1 2121.3–221.5 0.57 252.8 2227.3–121.8 0.56 12 months crude 96.9 295.1–288.8 0.32 253.5 2219.5–112.6 0.53 234.1 55.4–412.8 0.01
12 months adjusted 98.1 295.9–292.2 0.32 266.3 2236.1–103.5 0.45 252.1 71.0–433.3 ,0.01 Leisure activitiesA6
months crude
49.4 2100.4–199.1 0.52 180.9 60.0–310.8 ,0.01 106.9 232.4–246.3 0.13
6 months adjusted 48.2 2101.5–198.0 0.53 132.9 1.4–264.4 ,0.05 48.2 2101.5–198.0 0.53
Sport activitiesA12 months crude
232.7 2103.5–38.0 0.36 65.8 4.2–127.4 0.04 5.0 261.1–71.0 0.88
12 months adjusted 233.7 2104.9–37.6 0.35 59.9 22.7–122.5 0.06 1.4 265.2–67.9 0.73
Vigorous physical activityA
6 months crude
264.9 2123.3–26.5 0.03 243.4 2101.6–15.1 0.14 224.3 284.3–35.9 0.43
6 months adjusted 262.6 2120.9–23.9 0.03 253.6 2111.3–4.1 0.07 230.5 289.2–28.2 0.31
Sedentary behavior at workB 12 months crude
236.1 2103.6–31.4 0.29 250.1 2108.8–8.7 0.10 253.5 2116.7–9.7 0.10
12 months adjusted 236.0 2103.3–31.3 0.29 266.2 2125.4–27.0 0.03 261.4 2124.5–1.7 0.06
A
minutes per week,
Bminutes per day. Adjusted for confounders age, gender, education, marital status, general health, job demands, supervisor support, and corresponding baseline measure of the outcome variable. Significant effects are in bold. A negative Be`ta (B) means less exhaustion, small breaks, stair climbing, active commuting, leisure activities, sport activities, vigorous physical activity, sedentary behavior in the intervention group compared to the control group. [B5
Be`ta, CI5Confidence Interval, p-value is significant,0.05].
with a significant lower overall level of exhaustion (b:20.2, 95%CI:20.03;20.1), which was persistent at 6 and 12 months.
Small breaks
Both the combined and the social intervention showed a significant increase in small breaks at work (b: range 0.7 to 0.8 on a scale of 0–30). For the combined intervention this significant effect was persistent at 6 and 12 months, for the social intervention significancy persisted only at 6 months.
Physical activity outcomes
The interventions did not result in any significant effect for light or moderate intensity physical activity. The combined intervention showed a significant increase in active commuting (b: 175.1, 95%CI: 4.3;2346.0) and a reduction in vigorous physical activity at 6 months (b: 262.6, 95%CI: 2120.9; 23.9). The social intervention showed a significant increase in leisure activities at 6 months (b: 132.9, 95%CI: 1.4; 264.4). In the physical intervention, an overall increase in stair climbing at work was found (b: 1.0, 95%CI: 0.5; 1.5), which was persistent at both 6 and 12 months follow-up. Further, a significant increase in active
commuting was found at 12 months (b: 252.1, 95%CI: 71.0; 433.3).
Sedentary time at work
The social intervention showed a significant reduction in sedentary time at 12 months (b: 266.2, 95%CI: 2125.4; 27.0). For the physical intervention, an overall reduction in sedentary time at work was found (b:257.9, 95%CI:2111.7;
24.2), but no effects were found at the two respective follow-up periods.
Discussion
The results of this study showed that none of the interventions was effective in improving the need for recovery among office workers compared to the control group. Nevertheless, all outcomes changed into the expected, favourable direction. We did find statistically significant, but small, decreases in exhaustion, vigorous physical activity and sedentary behavior at work, and statistically significant increases in small breaks at work, active commuting, stair climbing at work, and leisure activities.
Need for recovery
this topic is scarce, this non-significant result is in line with two recent other studies: one among construction employees (that provided empowerment training and training guided by a physical therapist) [55] which showed an odds ratio of 0.88 at 12 months (an odds ratio (OR) above 1 indicates that employees in the intervention group had on average higher need for recovery compared to the control group). Another study among employees of two Dutch research institutes (mindfulness intervention) showed a non-significant increase at 12 months (b: 1.3, 95%CI: 23.7; 6.3) [56]. Even more scarce are studies involving the effect of changes in the physical environment on need for recovery. Only one study was found [57], where the effects of a so-called innovative office concept (e.g., open-office plan and flexible workplaces) on need for recovery among Dutch open-office employees was studied. They have found no significant improvements in need for recovery (mean at T0: 22.6 and at T2: 22.3) at 15 months follow-up [57].
The present study directed efforts at a healthy population, instead of a population with mental or physical health problems [58]. A downside of this focus is that it may offer relatively small health benefits and subjects are less motivated [59]. The participants of our study had relatively low baseline values (i.e., favourable) on need for recovery (M533.2, SD529.3), compared to average norm scores (M538.1) [60]. A possible explanation for this finding might be that employees with healthy lifestyles are more likely to participate, because they are more motivated to pursue and maintain their good health [61]. Due to these favourable baseline values, a significant decline in need for recovery as a result of the intervention is difficult to obtain (bottom effects). To have larger effects, efforts should be directed at a selection of participants with high need for recovery.
Work-related stress
Baseline values for exhaustion were generally low in all intervention groups and in the control group. Nevertheless, in the combined intervention, we did find a small significant reduction, which was present both at 6 months and at 12 months. In the social intervention, a small significant reduction at 12 months was found. The effect was considered not relevant, because it was smaller than 10%. Exhaustion was measured using the OLdenburg Burnout Inventory (OLBI) [45]. Information about norm scores of this scale is unknown. A study among healthcare employees, recruited on the basis of a high level of exhaustion, found that peer-support groups could be helpful in reducing levels of exhaustion, stress and minimizing work-family conflict [62]. This offers a possible explanation for a small reduction in exhaustion in the combined and social intervention, because both team leaders and colleagues had an active role in stimulating and supporting each other. No such a reduction of exhaustion was found in the physical intervention.
activities people execute for detachment and relaxation, and their interrelation-ships at work and after work, is important for future intervention development. Further, it could be that employees did not feel legitimized to detach or relax during work hours, which could explain that no effects were found on detachment and relaxation. Also, alongside the present trial, a study was executed assessing the measurement properties of the detachment and relaxation scale. The results showed that the scale was internally consistent, reliable and had moderate construct validity [47]. The lack of effect might be explained by the fact that unsatisfactory responsiveness was demonstrated [47]. Therefore, conclusions on detachment and relaxation based on our present results must be drawn with care.
Small breaks
We did find small significant improvements (b: range 0.7 to 0.8 on a scale of 0– 30) in the frequency of small breaks at work in the combined intervention at both time points, and in the social intervention at 6 months. So far, few RCTs have been conducted that investigated the effectiveness of WHP programs on small breaks. In the area of work recovery, one study showed that enjoyable and restful within workday breaks improved the recovery in a group of service employees [65]. Since the short-term benefits of within workday breaks are restorative, refreshing and energizing [66], our small improvement in small breaks (less than 10%) are a step up for future research.
Physical activity
A higher amount of minutes in active commuting and a reduction in vigorous physical activity at 6 months was found in the combined intervention. In the social intervention, the amount of time spent in leisure activities at 6 months was largely increased. The physical intervention showed an increase in stair climbing and active commuting at 6 and 12 months. We did find an unexpected, relatively small, significant reduction in vigorous physical activity at 6 months in the combined intervention. Since we did not focus on vigorous physical activity in particular, it is possible that participants focussed on light to moderate physical activity, therewith reducing their focus on vigorous physical activity.
Sedentary time at work
Furthermore, a small significant reduction (b: range257.9 to266.2) in minutes of sedentary time was shown in the social and the physical intervention, but not in the combined intervention. Previous studies have shown that high amounts of sedentary time increase the risk of morbidity and mortality, irrespective of whether people engage frequently in moderate to vigorous intensity activities
[67,68]. Although the questionnaire on sedentary behavior during work is used
validated. This may have resulted in less reliable findings and the results should be interpreted with caution.
Strengths and limitations
A strength of our study is our study design, in which we applied a 262 factorial
design in which we could randomise the social environment intervention and stratify the physical environment intervention. This enabled us to simultaneously study the effectiveness of the combined, and the social and the physical
environment interventions separately. Another strength is the minimized risk of contamination due to randomisation at department level. Contamination could be of concern when the control group is able to mingle with the intervention group and therefore receive also whole or part of the intervention. Through departmental randomization, cross-over was not expected to be likely. For GMI, no level of contamination was expected as the control group did not have access to GMI. However, it could be that the environment modifications such as table tennis and lounge chairs were also used by the control group.
Moreover, during all analyses, the multilevel procedure was applied. With multilevel analyses, incompleteness of the data is taken into account (i.e., method of maximum likelihood), and imputation of missing data is thus not necessary [69]. The loss-to-follow up at 6 months for the secondary outcome measures (.20%) was considerable, which is a common problem in intervention studies [70]. However, there were no significant differences at baseline between non-responders and non-responders, and therefore it is unlikely that self-selection of participants has influenced our study results.
Further, the present study did not account for cluster-level confounding. However, because we have added random intercepts for the different levels, we adjusted for confounding for that particular level. Nevertheless, there can be some uncontrolled residual confounding on each level which can lead to biased variance estimates and thus biased study inference [71].
According to the executed process evaluation [72], the reach (percentage of participants that used any of the intervention components at least once) for the social and physical intervention ranged between 45–76% and was considered to be reasonable, compared to other workplace health promotion programs (mostly below 50%). A limitation is that reach was assessed by self-report and no objective measurements were used. To illustrate, we were not continuously present to monitor the reach of the social and physical intervention and therefore we needed to rely on self-report information of the participants. As a result, we do not have an appropriate level of reach for both the social and physical intervention.
actual physical activity levels than objectively measured physical activity using accelerometry [75].
Unfortunately, the present study was underpowered regarding the primary outcome measure, need for recovery. Although our total sample size was
sufficient, our smallest intervention group contained 63 instead of the anticipated 76 participants due to a loss-to-follow up at 6 months (29%) and at 12 months (32%). This may have contributed to the fact that we did not find a significant effect on need for recovery in the combined intervention group. However, we do not expect that only a larger sample size would give other results since related studies in ergonomics did not had significant effects either. For example, in a study by Feuerstein et al., [76] on the effectiveness of a single ergonomic approach and of a combined approach offering a job stress management program:
comparable to our study the combined approach was not more effective. This was also seen in a study of Bernaards et al., [77] in which the effectiveness of a workstyle intervention and a workstyle intervention combined with physical activity was evaluated. Also, this study did not show that the combined
intervention was more effective compared to the workstyle intervention alone. An explanation for these findings and the findings of our study is that a combination of interventions could have resulted in a lack of focus, resulting in smaller behavioural changes. Or antagonism of effects could have played a role.
Further, we made use of a minimal intervention strategy for the
GMI-intervention, i.e., a two-day training in GMI, and only four GMI-sessions with the team, due to the restricted time available of both teamleaders and employees. A more extensive program was not feasible in the work setting, as the GMI-sessions were given during work hours and supervisors were reluctant in spending more hours on this intervention.
Although many statistical tests were performed, we did not perform an adjustment for multiple testing. The reason for not doing this was that we were not interested in single significant results, but in the broader picture. Because of multiple testing, single significant results should be interpreted with caution.
Finally, in the current study, multilevel analyses were applied using the maximum likelihood estimation procedure to account for missing data. The results did not show that certain predictor variables were related to missing data and we assumed that missing’s were at random (MAR). Maximum likelihood allows all available data to be used and for this imputation of missing data is considered unnecessary. The maximum likelihood estimate of a parameter is the value of the parameter that is most likely to have resulted in the observed data [78]. It has been revealed that using multilevel analysis for an incomplete dataset is better than applying imputation methods [78,79]. With imputation, multi-variate regression techniques are used to predict missing values on the basis of observed factors and several imputed datasets are created to account for
uncertainty. The difference between the two is that for maximum likelihood no separate model is created, and there is no difference between the imputation model and the analysis model. With the multiple imputation technique,
set of data, one will get slightly different parameter estimates and test statistics. Consequently, researchers applying the same methods to the same data could reach different results. While maximum likelihood always produces the same results for the same set of data. Altogether, we are not able to state which method for handling missing data is outstanding as neither approach is inherently better than the other. Therefore, we encourage further statistical research to examine the methods of treating missing data in multilevel analyses.
Research and practical implications
We believe that the combined social and physical environment intervention has the potential to improve the need for recovery. The present study consisted of a general healthy and well-functioning population, which makes it hard to have a large impact on improving the need for recovery. It is therefore recommended to implement the social and physical environment intervention among a population with higher baseline values on need for recovery. For improving the intervention, we also would suggest to provide a physical activity opportunity in addition to the GMI, for example, organize lunch walking or yoga classes at work.
Further, integration of the social media platform by means of designing a strategic plan, incentives for regular use (promotion codes for free workshops/ trainings, to do a free tests/get advice on a healthy lifestyle, assign for a
competition) and linking to other platforms such as facebook is recommended. Additionally, it is recommended to implement more drastic physical interventions (i.e., restructuring of entire department floor), because the relatively ‘simple’ environment modifications that were used (e.g., placing signs to promote stair use) did not result in changes in need for recovery.
The present study showed that employees and supervisors rated support by the financial service provider and their managers as relatively low. Many organiza-tions are still not convinced that worksite health promotion programs offer advantages (e.g., reducing risk factors, absenteeism and improving performance) for their workforce [80]. Instead, they tend to think that these programs distract people too much from their daily work-tasks [81]. Attention should be paid to improve support levels as previous research showed that commitment of higher management is of utmost importance for successful interventions; ‘board on board’ is needed [82–84].
relaxation. Another recommendation is that objective measurements should be added to assess small breaks at work, stair climbing at work, physical activity and sedentary behavior at work, because self-reports are subject to measurement error.
Conclusion
Strong conclusions about the combined intervention’s effectiveness in improving the need for recovery cannot be made, as we did not find significant effects of our interventions on need for recovery. The present study consisted of a general healthy and well-functioning population, with relatively low and a beneficial need for recovery, which makes it hard to improve the need for recovery any further. It is therefore recommended to implement the social and physical intervention among a population with higher baseline values of need for recovery.
Furthermore, the intervention itself could be improved by increasing the intensity of the intervention (for example weekly GMI-sessions), providing physical activity opportunities and exercise schemes, and by more drastic environment interven-tions (restructuring entire department floor).
Acknowledgments
We would like to thank all teamleaders and employees who participated in this study. The authors also wish to thank Robine van der Starre and Ruben
Kraaijeveld for their help with collecting the data.
Supporting Information
S1 Checklist.
doi:10.1371/journal.pone.0114860.s001 (DOC)
S1 Protocol.
doi:10.1371/journal.pone.0114860.s002 (DOCX)
Author Contributions
Conceived and designed the experiments: JC CB SD WvM IH. Performed the experiments: JC CB SD WvM IH. Analyzed the data: JC JT. Contributed reagents/ materials/analysis tools: JC CB SD WvM IH. Wrote the paper: JC CB SD WvM IH.
References
1. EU-OSHA.European agency for safety and health at work. European Survey on new and emerging risk. Available:https://osha.europa.eu/nl/topics/stress. Accessed 2014 Nov 14.
3. (2005) The Netherlands working conditions survey (nationale enqueˆte arbeidsomstandigheden, NEA).
4. Meijman T, Mulder G(2012) Psychological aspects of workload. In:, Drenth P, Thierry H, , editors., Handbook of work and organizational psychology. Hove, England: Psychology. pp. 5–33.
5. Sonnentag S, Zijlstra F (2006) Job characteristics and off-job activities as predictors of need for recovery, well-being and fatigue. J Appl Psychol 91: 330–50.
6. Lewis G, Wessely S(1992) The epidemiology of fatigue: more questions than answers. J Epidemiol Community Health 46: 92–7.
7. Geurts S, Sonnentag S(2006) Recovery as an explanatory mechanism in the relation between acute stress reactions and chronic health impairment. Scand J Work Environ Health 32: 482–92.
8. Van der Starre RE, Coffeng JK, Hendriksen IJ, van Mechelen W, Boot CR(2013) Associations between overweight, obesity, health measures and need for recovery in office employees: a cross-sectional analysis. BMC Public Health 13: 1207.
9. Sluiter JK, Van der Beek AJ, Frings-Dresen MHW(1999) The influence of work characteristics on the need for recovery and experienced health: A study on coach drivers. Ergonomics 42: 573–83.
10. van Hooff ML, Geurts SA, Kompier MA, Taris TW(2007) Workdays, in- between workdays and the weekend: a diary study on effort and recovery. Int Arch Occup Environ Health 80: 599–613.
11. de Croon EM, Sluiter JK, Frings-Dresen MH(2003) Need for recovery after works predicts sickness absence: a 2-year prospective cohort study in truck drivers. J Psychosom Res 55: 331–9.
12. Rook JW, Zijlstra FRH (2006) The contribution of various types of activities to recovery. European Journal of Work and Organizational Psychology 15: 218–40.
13. Siltaloppi M, Kinnunen U, Feldt T, Tolvanen A(2012) Development of need for recovery from work over one year: a person-centered approach. Anxiety, Stress & Coping 25: 23–42.
14. Sonnentag S(2001) Work, recovery activities, and individual well-being: A diary study. J Occup Health Psychol 6: 196–210.
15. Sonnentag S, Natter E(2004) Flight attendants’ daily recovery from work: Is there no place like home? International Journal of Stress Management 11: 366–91.
16. Norris R, Carroll D, Cochrane R(1990) The effects of aerobic and anaerobic training on fitness, blood pressure, and psychological stress and well-being. J Psychosom Res 34: 367–75.
17. Sonnentag S, Fritz C(2007) The Recovery Experience Questionnaire: Development and Validation of a Measure for Assessing Recuperation and Unwinding From Work. Journal of Occupational Health Psychology 12: 204–221.
18. Hahn VV, Binnewies C, Sonnentag S, Mozja EJ(2011) Learning How To Recover From Job Stress: Effects of a Recovery Training Program on Recovery, Recovery-Related Self-Efficacy, and Well-Being. J Occup Health Psychol 16: 202–16.
19. Binnewies C, Sonnentag S, Mozja EJ(2010) Recovery during the weekend and fluctuations in weekly job performance: a week-level study examining intra-individual relationships. Journal of Occupational and Organizational Psychology 83: 419–41.
20. van Hooff MLM(2013) The daily commute from work to home: examining employees’ experiences in relation to their recovery status. Stress & Health. Epub ahead of print.
21. Strijk JE, Proper KI, Van der Beek AJ, Van Mechelen W (2012) A worksite vitality intervention to improve workers’ lifestyle and vitality-related outcomes. Results of a randomized controlled trial. J Epidemiol Community Health 66: 1071–80.
22. Green LW, Richard L, Potvin L(1996) Ecological foundations of health promotion. Am J Health Promot 10: 270–81.
23. McLeroy K, Bibeau D, Steckler A, Glanz K(1988) An ecological perspective on health promotion programs. Health Educ Q 15: 351–77.
24. Robinson T(2003) Applying the socio-ecological model to improving fruit and vegetable intake among low-income African-Americans. J Community Health 33: 395–406.
26. Townsend N, Foster C(2013) Developing and applying an socio-ecological model to the promotion of healthy eating in the school. Public Health Nutr 16: 1101–8.
27. Bauman AE, Reis RS, Sallis JF, Well JC, Loos RJF, et al.(2012) Correlates of physical activity: why are some people physically active and others not? Lancet 380: 258–71.
28. Richard L, Gauvin L, Raine K(2011) Ecological models revisited: their uses and evoluation in health promotion over two decades. Annu Rev Public Health 32: 307–26.
29. McLaren L, Hawe P(2005) Ecological perspectives in health research. J Epidemiol Community Health 59: 6–14.
30. Coffeng JK, Hendriksen IJM, Duijts SF, Proper KI, van Mechelen W, et al.(2012) The development of the Be Active & Relax ‘Vitality in Practice’ (VIP) project and design of an RCT to reduce the need for recovery in office employees. BMC Public Health 12(1): 592–617.
31. Miller WR, Rollnick S(2002) Motivational Interviewing: Preparing people for change. New York: Guilford Press. 428 p.
32. Bailey KA, Webster RA, Lewin TJ (2004) Pilot Randomized Controlled Trial of a Brief Alcohol Intervention Group for Adolescents. Drug and Alcohol Rev 23: 157–166.
33. Foote J, DeLuca A, Magura S, Warner A, Grand A, et al.(1999) A group motivational treatment for chemical dependency. J Subst Abuse Treat 17: 181–92.
34. Ingersoll KS, Wagner CC, Gharib S(2000) Motivational Groups for Community Substance Abuse Program. Mid-Atlantic Addiction Technology Transfer Center.
35. Lincour P, Kuettel TJ, Bombardier CH (2002) Motivational interviewing in a group setting with mandated clients: A pilot study. Addict Behav 27: 381–91.
36. Van Horn DH, Bux DA(2001) A pilot test of motivational interviewing groups for dually diagnosed inpatients. J Subst Abuse Treat 20: 191–5.
37. Velasquez MM, Stephens NS, Ingersoll KS (2006) Motivational interviewing in groups. Journal of Groups in Addiction & Recovery 1: 27–50.
38. Sluiter JK, Frings-Dresen MHW, Van der Beek AJ, Meijman TF(2001) The relation between work-induced neuroendocrine reactivity and recovery, subjective need for recovery, and health status. J Psychosom Res 50: 29–37.
39. Van Veldhoven M, Broersen S(2003) Measurement quality and validity of the "need for recovery scale. Occup Environ Med 60: 3–9.
40. De Croon EM, Sluiter JK, Frings-Dresen MH(2006) Psychometric properties of the Need for Recovery after work scale: test-retest reliability and sensitivity to detect change. Occup Environ Med 63: 202–6.
41. Kuijer PP, Van der Beek AJ, Van Dieen J, Visser B, Frings-Dresen MHW (2005) Effect of Job Rotation on Need For Recovery, Musculoskeletal Complaints, and Sick Leave Due to Musculoskeletal Complaints: A Prospective Study Among Refuse Collectors. Am J Ind Med 47: 394–402.
42. Kelder SH, Jacobs DR, Jeffery RW, McGovern PG, Forster JL(1993) The worksite component of variance: design effects and the Healthy Worker Project. Health Educ Res 8: 555–66.
43. Martinson BC, Murray DM, Jeffery RW, Henrikus DJ(1999) Intraclass correlation for measures from a worksite health promotion study: Estimates, correlates and applications. Am J Health Promot 13: 347– 57.
44. Murray DM, Blitstein JL (2003) Methods to reduce the impact of intraclass correltaion in group-randomized trials. Eval Rev 27: 79–103.
45. Demerouti E, Bakker AB, Vardakou I, Kantas A (2003) The convergent validity of two burnout instruments: A multitrait-multimethod analysis. European Journal of Psychological Assessment 19: 12– 23.
46. Demerouti E, Bakker AB (2008) The Oldenburg Burnout Inventory: a good alternative to measure burnout and engagement. Handbook of stress and burnout in health care. NY: Nova Science: Hauppauge.
48. Wendel-Vos GC, Schuita AJ, Sarisc WH, Kronmhout D(2003) Reproducibility and relative validity of the Short Questionnaire to Assess Health-enhancing physical activity. J Clin Epidemiol 56: 1163–9.
49. van Poppel MN, Chinapaw MJ, Mokkink LB, van Mechelen W, Terwee CB(2010) Physical activity questionnaire for adults: a systematic review of measurement properties. Sports Med 40: 565–600.
50. Ainsworth BE, Haskell WL, Whitt MC, Irwin ML, Swartz AM, et al.(2000) Compendium of physical activities: an update of activity codes and MET intensities. Med Sci Sports Exerc 32: S498–504.
51. Sedentary Behaviour Research Network (2012) Standardized use of the terms "sedentary" and "sedentary behaviors". Appl Physiol Nutr Metab 37: 540–2.
52. Karasek R, Brisson C, Kawakami N, Houtman I, Bongers P, et al. (1998) The Job content Questionnaire (JCQ): an instrument for internationally comparative assessments of psychosocial job characteristics. J Occup Health Psychol 3: 322–55.
53. Van der Zee K, Sanderman R(1993) Het meten van gezondheidstoestand met de RAND-36: een handleiding (measurement of health condition with the RAND-36: a guideline). Groningen:Noordelijk Centrum voor Gezondheidsvraagstukken.
54. Goldstein H(1995) Multilevel statistical models. London: Edward Arnold. 178p.
55. Oude Hengel KM, Blatter BM, Joling CI, Van der Beek AJ, Bongers PM(2012) Effectiveness of an intervention at construction worksites on work-engagement, social support, physical workload and need for recovery: results from a cluster randomized controlled trial. BMC Public Health 12:1008–18.
56. van Berkel J, Boot CRL, Proper KI, Bongers PM, Van der Beek AJ(2014) Effectiveness of a worksite mindfullness-based intervention on work engagement and mental health: results of a randomized controlled trial. PloS One 9.
57. Meijer EM, Frings-Dresen MH, Sluiter JK(2009) Effects of office innovation on office workers’ health and performance. Ergonomics 1: 1027–38.
58. Goetzel RZ, Jacobsen BH, Aldana SG (1998) Health care costs of worksite health promotion participants and nonparticipants. J Occup Environ Med 40: 341–6.
59. Rose G(2001) Sick individuals and sick populations. Int J Epidemiol 30: 427–32.
60. Jansen NWH, Kant I, Van den Brandt PA(2002) Need for recovery in working population: description and associations with fatigue and psychological distress. Int J Behav Med 4: 322–40.
61. van Dongen JM, van Poppel MNM, Milder IEJ, van Oers HAM, Brug J(2012) Exploring the reach and program use of hello world, an emailbased health promotion program for pregnant women in the Netherlands. BMC Res Notes 5: 514.
62. Peterson U, Bergstrom G, Samuelsson M, Asberg M, Nygren A (2008) Reflecting peer-support groups in the prevention of stress and burnout: randomized controlled trial. J Adv Nurs 63: 506–16.
63. Fritz C, Sonnentag S(2005) Recovery, health, and job performance: Effects of weekend experiences. J Occup Health Psychol 10: 187–99.
64. Sonnentag S, Binnewies C, Mojza EJ(2008) "Did you have a nice evening?" A day-level study on recovery experiences, sleep, and affect. J Appl Psychol 93: 674–84.
65. Trougakos JP, Beal DJ, Green SG, Weiss HM(2008) Making the break count: An episodic examination of recovery activities, emotional experiences, and affective delivery. Academy of Management Journal, 51: 131–1146.
66. Taylor WC(2005) Transforming work breaks to promote health. Am J Prev Med 29: 461–5.
67. Katzmarzyk PT, Church TS, Craig CL, Bouchard C(2009) Sitting time and mortality from all causes, cardiovascular disease, and cancer. Med Sci Sports Exerc 41: 998–1005.
68. Thorp AA, Owen N, Neuhaus M, Dunstan DW(2011) Sedentary behaviors and subsequent health outcomes in adults: a systematic review of longitudinal studies, 1996-2011. Am J Prev Med 41: 207–15.
69. Von Hippel PT(2007) Regression with missing ys: an improved method for analyzing multiply imputed data. Sociological Methodology 37: 83–117.
71. Berlin JA, Kimmel SE, Have TRT, Sammel MD(1999) An empirical comparison of several clustered data approaches under confounding due to cluster effects in the analysis of complications of coronary angioplasty. Biometrics 55: 470–76.
72. Coffeng J, Hendriksen IJM, van Mechelen W, Boot C(2013) Process evaluation of a worksite social and physical environmental intervention. J Occup Environ Med 55: 1409–20.
73. Jacobs DR, Ainsworth BE, Hartman TJ, Leon AS(1993) A simultaneous evaluation of 10 commonly used physical activity questionnaires. Med Sci Sports Exerc 25: 81–91.
74. Engbers LH, van Poppel MN, van Mechelen W(2012) Measuring stair use in two office building: a comparison between an objective and a self-reported method. Scand J Med Sci Sports 17: 165–71.
75. Kwak L, Kremers SP, Brug J, van Baak MA (2007) Measuring physical activity in field studies: comparison of a questionnaire, 24-hour recall and an accelerometer. European Journal of Sport Science 7: 193–201.
76. Feuerstein M, Nicholos RA, Huang GD, Dimberg L, Ali D, et al.(2004) Job stress management and ergonomic intervention for work related upper extermity symptoms. Apll Ergon 35: 565–74.
77. Bernaards CM, Ariens GA, Knol DL, Hildebrandt VH (2007) The effectiveness of a work style intervention and a lifestyle physical activity intervention on the recovery from neck and upper limb symptoms in computer workers. Pain 132: 142–53.
78. Twisk J (2006) Applied multilevel analysis: a practical guide for medical researchers. Cambridge University Press., 196 p.
79. Twisk JWR, de Vente W(2002) Attrition in longitudinal studies. How to deal with missing data. J Clin Epidemiol 55: 329–37.
80. Goetzel RZ(2001) A corporate perspective: reflections from the economic buyer of health promotion programs. Am J Health Promot 15: 357–65.
81. Goetzel RZ, Ozminkowski RJ (2008) The health and cost benefits of work site health-promotion programs. Annu Rev Public Health 29: 303–23.
82. Berwick DM(1989) Continous improvement as in ideal in health care. N Engl J Med 320: 53–6.
83. DeJoy DM, Wilson MG(2003) Organizational health promotion: broadening the horizon of workplace health promotion. Am J Health Promot 17: 337–41.